Sycamore: Fire Incidents, Illinois (IL)
Where are fire incidents reported in Sycamore, IL
Something went wrong! Please refresh the page.
| Fire incidents reported | |
|---|---|
| Sreet name | Count |
| STATE ST | 160 |
| DEKALB AVE | 72 |
| PLANK RD | 56 |
| MAIN ST | 44 |
| BRICKVILLE RD | 42 |
| SWANSON RD | 36 |
| OLD STATE RD | 30 |
| BETHANY RD | 28 |
| PEACE RD | 28 |
| COLTONVILLE RD | 24 |
| STATE RT 64 | 22 |
| BARBER GREENE RD | 20 |
| GRANT ST | 20 |
| SOMONAUK ST | 20 |
| AIRPORT RD | 18 |
| CALIFORNIA ST | 18 |
| ELM ST | 18 |
| EXCHANGE ST | 18 |
| STONEHENGE DR | 18 |
| MT HUNGER RD | 16 |
| PERRY CT | 16 |
| JOHN MARSHALL LN | 14 |
| OTTAWA ST | 14 |
| SYCAMORE ST | 14 |
| DARNELL RD | 12 |
| FIVE POINTS RD | 12 |
| GLIDDEN RD | 12 |
| LINCOLN ST | 12 |
| LONGWOOD DR | 12 |
| LUCAS ST | 12 |
| Other | 55 |
2003 - 2018 National Fire Incident Reporting System (NFIRS) incidents
- Incident types reported to NFIRS in Sycamore, IL
- 6,99464.6%Rescue & EMS
- 1,55314.3%Hazardous Condition
- 8938.2%Fire
- 6486.0%False Alarm
- 5445.0%Good Intent Call
- 1741.6%Service Call
- Fire incident types reported to NFIRS in Sycamore, IL
- 49054.9%Structure Fires
- 25528.6%Outside Fires
- 9410.5%Mobile Property/Vehicle Fires
- 546.0%Other
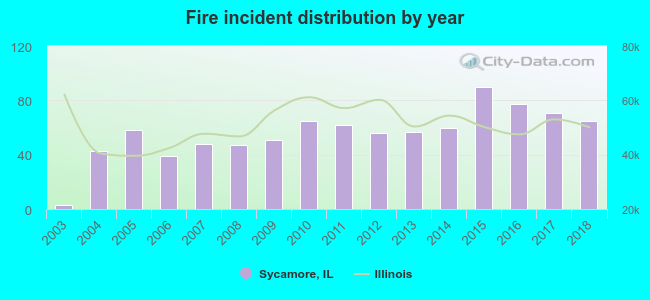 According to the data from the years 2003 - 2018 the average number of fire incidents per year is 56. The highest number of fires - 90 took place in 2015, and the least - 3 in 2003. The data has a rising trend.
The average number of yearly fire incidents per 10k residents in Sycamore, IL compared to nearest cities:
(Note: Based on data for the last 3 years, including only cities with population 5,000 and above)
| Sycamore: | 40.0 |
| DeKalb: | 32.6 |
| Genoa: | 68.9 |
| Hampshire: | 84.2 |
| Elburn: | 84.5 |
| Campton Hills: | 1.3 |
| Pingree Grove: | 36.9 |
| Huntley: | 21.0 |
| Gilberts: | 22.5 |
 The median response time based on all reported fire incidents is 7 minutes. This is higher than the state median value.
The median response time in Sycamore, IL compared to nearest cities:
(Note: Based on data for all years, including only cities with at least 500 fire incidents)
| Sycamore: | 7 minutes |
| DeKalb: | 6 minutes |
| Maple Park: | 12 minutes |
| Genoa: | 11 minutes |
| Hampshire: | 9 minutes |
| Elburn: | 8 minutes |
| Huntley: | 7 minutes |
| Marengo: | 8 minutes |
| Sugar Grove: | 7 minutes |
 Based on the reports from the years 2003 - 2018 the average number of fire-related fatalities per year is 0. The highest number of reported deaths - 2 took place in 2007, and the lowest - 0 in 2003. The data has a constant trend.
 According to the reports from the years 2003 - 2018 the average number of fire-related casualties per year is 1. The highest number of casualties - 2 took place in 2005, and the lowest - 0 in 2003. The data has a rising trend.
The average number of injuries per 1,000 fires is 9. This indicator was the highest - 36 in 2012, and the lowest 0 in 2003. The trend for casualties per 1,000 fires is growing. Compared to the state value the number of casualties per 1,000 fires is about the same.
According to the reports from the years 2003 - 2018 the average number of fire-related casualties per year is 1. The highest number of casualties - 2 took place in 2005, and the lowest - 0 in 2003. The data has a rising trend.
The average number of injuries per 1,000 fires is 9. This indicator was the highest - 36 in 2012, and the lowest 0 in 2003. The trend for casualties per 1,000 fires is growing. Compared to the state value the number of casualties per 1,000 fires is about the same.Casualties per 1,000 incidents in Sycamore, IL compared to nearest cities:
(Note: Based on data for all years, including only cities with at least 500 fire incidents)
| Sycamore: | 10.1 |
| DeKalb: | 38.5 |
| Maple Park: | 1.7 |
| Genoa: | 1.8 |
| Hampshire: | 6.7 |
| Elburn: | 1.0 |
| Huntley: | 1.9 |
| Marengo: | 0.0 |
| Sugar Grove: | 4.3 |
 29.5% incidents where reported in the morning and 70.5% in the evening. The most fires (17.1%) took place on Monday, and the least (11.9%) on Thursday.
 Based on the 893 fires from years 2003 - 2018 most fires (10.3%) took place during April, and the least (6.0%) in November.
 Out of all 10,825 cases reported during the years 2003 - 2018, the most belonged to the categories: Rescue & EMS (64.6%), Hazardous Condition (14.3%), and Fire (8.2%).
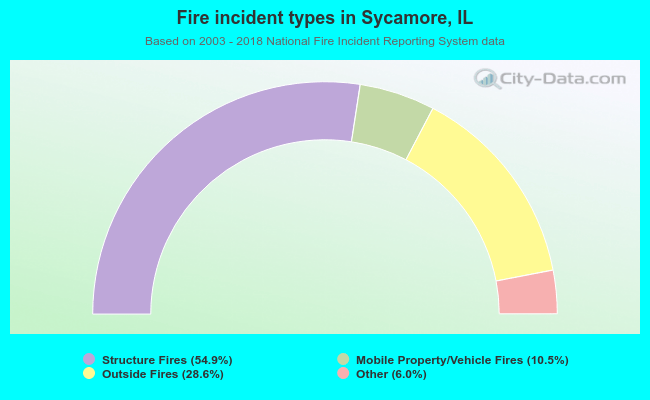 When looking into fire subcategories, the most reports belonged to: Structure Fires (54.9%), and Outside Fires (28.6%).