Huntley: Fire Incidents, Illinois (IL)
Where are fire incidents reported in Huntley, IL
Something went wrong! Please refresh the page.
|
| |||||||||||||||||||||||||||||||||||||||||||||||||||||||||||||||||||||||||||||||||||||||||||||||||||||||||||||
| Other | 66 | |||||||||||||||||||||||||||||||||||||||||||||||||||||||||||||||||||||||||||||||||||||||||||||||||||||||||||||
2002 - 2018 National Fire Incident Reporting System (NFIRS) incidents
- Incident types reported to NFIRS in Huntley, IL
- 11,71760.9%Rescue & EMS
- 2,97915.5%Service Call
- 1,8279.5%False Alarm
- 1,0265.3%Fire
- 9845.1%Hazardous Condition
- 6653.5%Good Intent Call
- Fire incident types reported to NFIRS in Huntley, IL
- 50048.7%Structure Fires
- 36535.6%Outside Fires
- 13713.4%Mobile Property/Vehicle Fires
- 242.3%Other
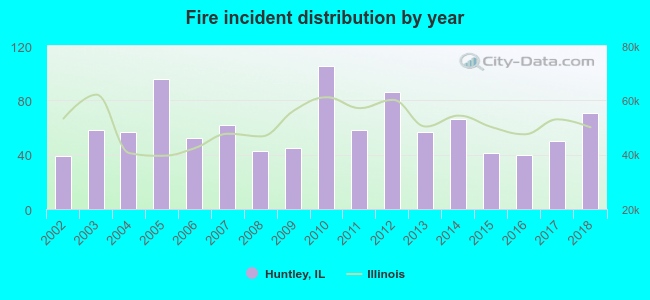 According to the data from the years 2002 - 2018 the average number of fire incidents per year is 60. The highest number of fire incidents - 105 took place in 2010, and the least - 39 in 2002. The data has a rising trend.
The average number of yearly fire incidents per 10k residents in Huntley, IL compared to nearest cities:
(Note: Based on data for the last 3 years, including only cities with population 5,000 and above)
| Huntley: | 21.0 |
| Lake in the Hills: | 10.8 |
| Gilberts: | 22.5 |
| Algonquin: | 14.0 |
| Crystal Lake: | 24.9 |
| Pingree Grove: | 36.9 |
| Hampshire: | 84.2 |
| Carpentersville: | 23.7 |
| West Dundee: | 40.1 |
 The median response time based on all reported fire incidents is 7 minutes. This is higher than the Illinois median value.
The median response time in Huntley, IL compared to nearest cities:
(Note: Based on data for all years, including only cities with at least 500 fire incidents)
| Huntley: | 7 minutes |
| Lake in the Hills: | 5 minutes |
| Algonquin: | 5 minutes |
| Crystal Lake: | 6 minutes |
| Hampshire: | 9 minutes |
| Carpentersville: | 5 minutes |
| Cary: | 5 minutes |
| Woodstock: | 6 minutes |
| Marengo: | 8 minutes |
 33.8% incidents where reported in the morning and 66.2% in the evening. The most fires (18.2%) took place on Monday, and the least (11.7%) on Wednesday.
 According to the 1,026 fire incidents from years 2002 - 2018 most fires (12.3%) took place during April, and the least (5.5%) in December.
 Out of all 19,228 cases reported during the years 2002 - 2018, the most belonged to the categories: Rescue & EMS (60.9%), Service Call (15.5%), and False Alarm (9.5%).
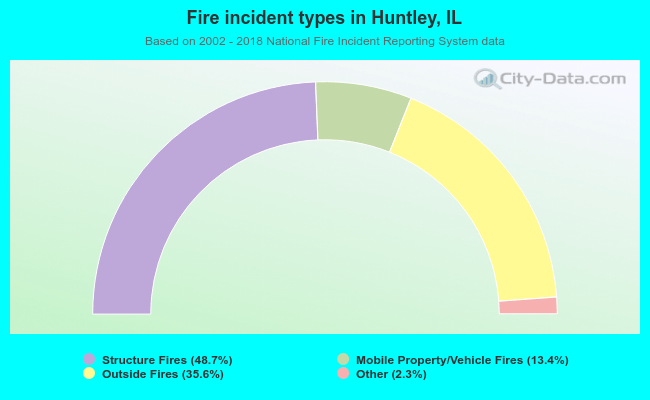 When looking into fire subcategories, the most incidents belonged to: Structure Fires (48.7%), and Outside Fires (35.6%).