Springboro: Fire Incidents, Ohio (OH)
Where are fire incidents reported in Springboro, OH
Something went wrong! Please refresh the page.
| Fire incidents reported | |
|---|---|
| Sreet name | Count |
| CENTRAL AVE | 202 |
| MAIN ST | 102 |
| PIONEER BLVD | 54 |
| BECKLEY FARM WAY | 24 |
| GREENWOOD LN | 24 |
| MARKET ST | 24 |
| CLEARCREEKFRANKLIN RD | 20 |
| EDGEBROOK DR | 20 |
| FACTORY RD | 16 |
| CLEARCREEK-FRANKLIN RD | 14 |
| EAST ST | 14 |
| CROCKETT DR | 12 |
| HIAWATHA TRL | 12 |
| JACAMAR CT | 12 |
| JACKSON LN | 12 |
| LOWER SPRINGBORO RD | 12 |
| PLEASANT VALLEY DR | 12 |
| SHARTS RD | 12 |
| CREEKSIDE DR | 10 |
| GARDNER RD | 10 |
| GILPIN DR | 10 |
| PERTH CT | 10 |
| TAMARACK TRL | 10 |
| TEAKWOOD LN | 10 |
| AMBRIDGE CT | 8 |
| DUNCAN CT | 8 |
| FAIRWAY DR | 8 |
| JANNEY LN | 8 |
| PENNYROYAL RD | 8 |
| REMICK BLVD | 8 |
| Other | 55 |
2002 - 2018 National Fire Incident Reporting System (NFIRS) incidents
- Incident types reported to NFIRS in Springboro, OH
- 5,08259.6%Rescue & EMS
- 1,08912.8%Hazardous Condition
- 7618.9%Fire
- 6918.1%Service Call
- 4745.6%False Alarm
- 4094.8%Good Intent Call
- 210.2%Severe Weather
- Fire incident types reported to NFIRS in Springboro, OH
- 42555.8%Structure Fires
- 26735.1%Outside Fires
- 678.8%Mobile Property/Vehicle Fires
- 20.3%Other
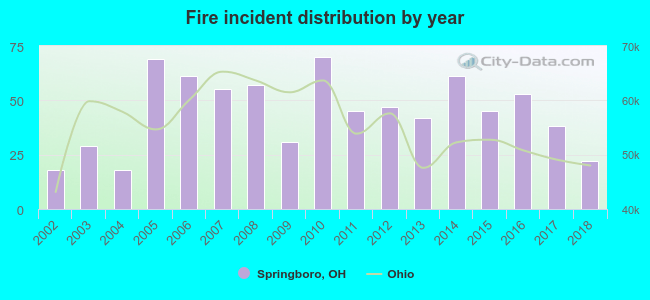 According to the data from the years 2002 - 2018 the average number of fire incidents per year is 45. The highest number of fire incidents - 70 took place in 2010, and the least - 18 in 2002. The data has an increasing trend.
The average number of yearly fire incidents per 10k residents in Springboro, OH compared to nearest cities:
(Note: Based on data for the last 3 years, including only cities with population 5,000 and above)
| Springboro: | 20.9 |
| Franklin: | 54.2 |
| Carlisle: | 41.7 |
| Miamisburg: | 56.7 |
| Centerville: | 14.6 |
| West Carrollton City: | 1.2 |
| West Carrollton: | 35.8 |
| Germantown: | 65.4 |
| Middletown: | 44.0 |
 The median response time based on all reported fire incidents is 6 minutes. This is about the same as the state median value.
The median response time in Springboro, OH compared to nearest cities:
(Note: Based on data for all years, including only cities with at least 500 fire incidents)
| Springboro: | 6 minutes |
| Franklin: | 5 minutes |
| Carlisle: | 6 minutes |
| Miamisburg: | 6 minutes |
| Centerville: | 7 minutes |
| West Carrollton: | 5 minutes |
| Germantown: | 7 minutes |
| Middletown: | 5 minutes |
| Moraine: | 5 minutes |
 According to the reports from the years 2002 - 2018 the average number of fire-related yearly casualties is 1. The highest number of injuries - 3 took place in 2017, and the lowest - 0 in 2002. The data has a growing trend.
The average number of injuries per 1,000 fires is 12. This indicator was the highest - 79 in 2017, and the lowest 0 in 2002. The trend for injuries per 1,000 fires is increasing. Compared to the Ohio value the number of casualties per 1,000 incidents is lower.
According to the reports from the years 2002 - 2018 the average number of fire-related yearly casualties is 1. The highest number of injuries - 3 took place in 2017, and the lowest - 0 in 2002. The data has a growing trend.
The average number of injuries per 1,000 fires is 12. This indicator was the highest - 79 in 2017, and the lowest 0 in 2002. The trend for injuries per 1,000 fires is increasing. Compared to the Ohio value the number of casualties per 1,000 incidents is lower.Casualties per 1,000 incidents in Springboro, OH compared to nearest cities:
(Note: Based on data for all years, including only cities with at least 500 fire incidents)
| Springboro: | 11.8 |
| Franklin: | 21.5 |
| Carlisle: | 31.9 |
| Miamisburg: | 14.3 |
| Centerville: | 33.9 |
| West Carrollton: | 23.9 |
| Germantown: | 28.0 |
| Middletown: | 30.9 |
| Moraine: | 20.1 |
 28.0% incidents where reported in the morning and 72.0% in the evening. The most fires (16.7%) took place on Thursday, and the least (11.0%) on Saturday.
 According to the 761 reports from years 2002 - 2018 most fires (13.3%) took place during April, and the least (5.8%) in July.
 Out of all 8,534 cases reported during the years 2002 - 2018, the most belonged to the categories: Rescue & EMS (59.6%), Hazardous Condition (12.8%), and Fire (8.9%).
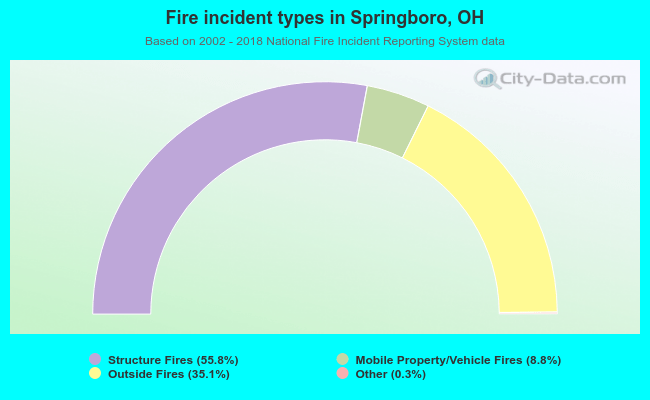 When looking into fire subcategories, the most reports belonged to: Structure Fires (55.8%), and Outside Fires (35.1%).