West Carrollton: Fire Incidents, Ohio (OH)
Where are fire incidents reported in West Carrollton, OH
Something went wrong! Please refresh the page.
| Fire incidents reported | |
|---|---|
| Sreet name | Count |
| CENTRAL AVE | 120 |
| ALEX RD | 86 |
| INFIRMARY RD | 82 |
| SPRINGBORO PIKE | 62 |
| DIXIE DR | 58 |
| GAWAIN CIR | 48 |
| ELM ST | 46 |
| SIDNEYWOOD RD | 44 |
| ALEX-BELL RD | 34 |
| MAIN ST | 34 |
| REDBLUFF DR | 32 |
| SHAWNEE RUN | 32 |
| PEASE AVE | 28 |
| INTERSTATE 75 | 26 |
| SHAWNEE RUN | 26 |
| BISHOP DR | 22 |
| STUDENT ST | 22 |
| HYDRAULIC RD | 20 |
| I-75 | 20 |
| ROBERT ST | 20 |
| SHERWOOD FOREST DR | 18 |
| TONYWOOD CIR | 18 |
| WOODHILLS BLVD | 18 |
| COTTAGE AVE | 16 |
| HOME AVE | 16 |
| LINDBERGH BLVD | 16 |
| WATERTOWER LN | 16 |
| DINSMORE RD | 14 |
| IRONWOOD DR | 14 |
| MIAMI AVE | 14 |
| Other | 23 |
2002 - 2018 National Fire Incident Reporting System (NFIRS) incidents
- Incident types reported to NFIRS in West Carrollton, OH
- 7,98466.2%Rescue & EMS
- 1,1089.2%Hazardous Condition
- 1,0458.7%Fire
- 8487.0%Service Call
- 6135.1%Good Intent Call
- 4343.6%False Alarm
- 150.1%Overpressure Rupture
- Fire incident types reported to NFIRS in West Carrollton, OH
- 45443.4%Structure Fires
- 38837.1%Outside Fires
- 19818.9%Mobile Property/Vehicle Fires
- 50.5%Other
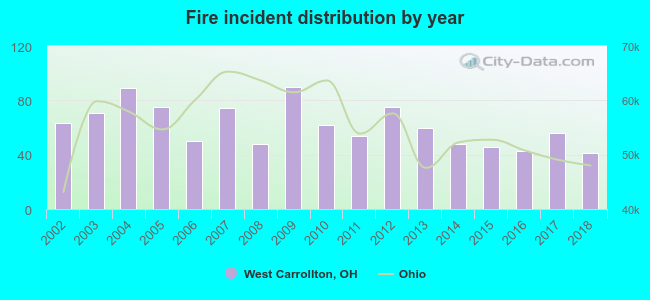 According to the data from the years 2002 - 2018 the average number of fire incidents per year is 61. The highest number of reported fire incidents - 90 took place in 2009, and the least - 41 in 2018. The data has a decreasing trend.
The average number of yearly fire incidents per 10k residents in West Carrollton, OH compared to nearest cities:
(Note: Based on data for the last 3 years, including only cities with population 5,000 and above)
| West Carrollton: | 35.8 |
| West Carrollton City: | 1.2 |
| Moraine: | 108.9 |
| Miamisburg: | 56.7 |
| Oakwood: | 46.2 |
| Kettering: | 14.8 |
| Centerville: | 14.6 |
| Germantown: | 65.4 |
| Dayton: | 44.3 |
 The median response time based on all reported fire incidents is 5 minutes. This is lower compared to the state median value.
The median response time in West Carrollton, OH compared to nearest cities:
(Note: Based on data for all years, including only cities with at least 500 fire incidents)
| West Carrollton: | 5 minutes |
| Moraine: | 5 minutes |
| Miamisburg: | 6 minutes |
| Oakwood: | 5 minutes |
| Kettering: | 6 minutes |
| Centerville: | 7 minutes |
| Germantown: | 7 minutes |
| Dayton: | 5 minutes |
| Carlisle: | 6 minutes |
 According to the reports from the years 2002 - 2018 the average number of fire-related casualties per year is 1. The highest number of reported casualties - 4 took place in 2009, and the lowest - 0 in 2006. The data has a declining trend.
The average number of casualties per 1,000 fire incidents is 23. This indicator was the highest - 70 in 2016, and the lowest 0 in 2006. The trend for casualties per 1,000 incidents is dropping. Compared to the state value the number of casualties per 1,000 incidents is higher.
According to the reports from the years 2002 - 2018 the average number of fire-related casualties per year is 1. The highest number of reported casualties - 4 took place in 2009, and the lowest - 0 in 2006. The data has a declining trend.
The average number of casualties per 1,000 fire incidents is 23. This indicator was the highest - 70 in 2016, and the lowest 0 in 2006. The trend for casualties per 1,000 incidents is dropping. Compared to the state value the number of casualties per 1,000 incidents is higher.Casualties per 1,000 incidents in West Carrollton, OH compared to nearest cities:
(Note: Based on data for all years, including only cities with at least 500 fire incidents)
| West Carrollton: | 23.9 |
| Moraine: | 20.1 |
| Miamisburg: | 14.3 |
| Oakwood: | 2.1 |
| Kettering: | 25.7 |
| Centerville: | 33.9 |
| Germantown: | 28.0 |
| Dayton: | 20.5 |
| Carlisle: | 31.9 |
 31.1% incidents where reported in the morning and 68.9% in the evening. The most fires (15.6%) took place on Friday, and the least (12.7%) on Tuesday.
 According to the 1,045 fire incidents from years 2002 - 2018 most fires (10.2%) took place during October, and the least (5.4%) in January.
 Out of all 12,060 cases reported during the years 2002 - 2018, the most belonged to the categories: Rescue & EMS (66.2%), Hazardous Condition (9.2%), and Fire (8.7%).
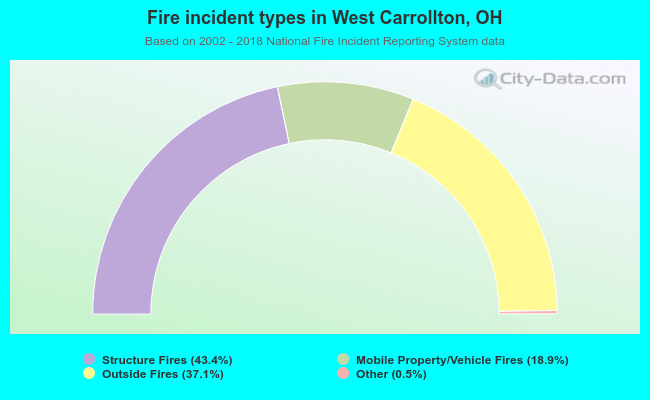 When looking into fire subcategories, the most reports belonged to: Structure Fires (43.4%), and Outside Fires (37.1%).