Snyder: Fire Incidents, Texas (TX)
Where are fire incidents reported in Snyder, TX
Something went wrong! Please refresh the page.
| Fire incidents reported | |
|---|---|
| Sreet name | Count |
| HWY 180 | 176 |
| HWY 84 | 172 |
| FM1606 | 108 |
| COLLEGE AVE. | 86 |
| HWY 208 | 58 |
| FM1611 | 50 |
| 37TH STREET | 44 |
| OLD LUBBOCK HWY | 42 |
| 25TH STREET | 40 |
| AVE. R | 32 |
| 26TH STREET | 30 |
| 27TH STREET | 28 |
| COLLEGE AVE | 28 |
| 20TH STREET | 26 |
| 23RD STREET | 26 |
| 24TH STREET | 26 |
| AVE. O | 26 |
| AVE. U | 26 |
| BRICK PLANT ROAD | 26 |
| 35TH STREET | 24 |
| 28TH STREET | 22 |
| 29TH STREET | 20 |
| 40TH STREET | 20 |
| AVE. M | 20 |
| FM1609 | 20 |
| 30TH STREET | 18 |
| 31ST STREET | 18 |
| 34TH STREET | 18 |
| 39TH STREET | 18 |
| 41ST STREET | 18 |
| Other | 888 |
2002 - 2018 National Fire Incident Reporting System (NFIRS) incidents
- Incident types reported to NFIRS in Snyder, TX
- 2,15448.6%Fire
- 1,37130.9%Hazardous Condition
- 3527.9%Good Intent Call
- 2826.4%Rescue & EMS
- 1824.1%Service Call
- 591.3%False Alarm
- 110.2%Overpressure Rupture
- 110.2%Special Incident
- 90.2%Severe Weather
- Fire incident types reported to NFIRS in Snyder, TX
- 1,58273.4%Outside Fires
- 35716.6%Structure Fires
- 1637.6%Mobile Property/Vehicle Fires
- 522.4%Other
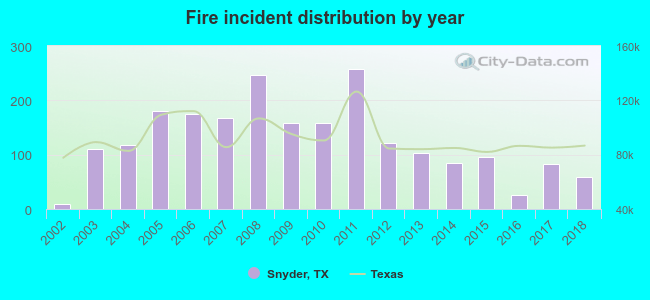 According to the data from the years 2002 - 2018 the average number of fires per year is 127. The highest number of fire incidents - 258 took place in 2011, and the least - 10 in 2002. The data has an increasing trend.
The average number of yearly fire incidents per 10k residents in Snyder, TX compared to nearest cities:
(Note: Based on data for the last 3 years, including only cities with population 5,000 and above)
| Snyder: | 47.5 |
| Sweetwater: | 113.2 |
| Big Spring: | 67.3 |
| Lamesa: | 108.8 |
| Slaton: | 57.1 |
| Abilene: | 41.0 |
| Lubbock: | 35.6 |
| Midland: | 23.6 |
| Brownfield: | 72.7 |
 The median response time based on all reported fire incidents is 9 minutes. This is higher than the state median value.
The median response time in Snyder, TX compared to nearest cities:
(Note: Based on data for all years, including only cities with at least 500 fire incidents)
| Snyder: | 9 minutes |
| Colorado City: | 6 minutes |
| Sweetwater: | 4 minutes |
| Big Spring: | 7 minutes |
| Lamesa: | 6 minutes |
| Slaton: | 5 minutes |
| Stamford: | 9 minutes |
| Abilene: | 5 minutes |
| Lubbock: | 5 minutes |
 According to the data from the years 2002 - 2018 the average number of fire-related fatalities per year is 0. The highest number of reported deaths - 4 took place in 2003, and the lowest - 0 in 2002. The data has a constant trend.
 Based on the reports from the years 2002 - 2018 the average number of fire-related yearly casualties is 0. The highest number of reported injuries - 2 took place in 2009, and the lowest - 0 in 2002. The data has a constant trend.
The average number of injuries per 1,000 fires is 3. This indicator was the highest - 13 in 2009, and the lowest 0 in 2002. The trend for casualties per 1,000 fires is constant. Compared to the Texas value the number of injuries per 1,000 fire incidents is much lower.
Based on the reports from the years 2002 - 2018 the average number of fire-related yearly casualties is 0. The highest number of reported injuries - 2 took place in 2009, and the lowest - 0 in 2002. The data has a constant trend.
The average number of injuries per 1,000 fires is 3. This indicator was the highest - 13 in 2009, and the lowest 0 in 2002. The trend for casualties per 1,000 fires is constant. Compared to the Texas value the number of injuries per 1,000 fire incidents is much lower.Casualties per 1,000 incidents in Snyder, TX compared to nearest cities:
(Note: Based on data for all years, including only cities with at least 500 fire incidents)
| Snyder: | 3.2 |
| Colorado City: | 0.0 |
| Sweetwater: | 0.6 |
| Big Spring: | 1.0 |
| Lamesa: | 5.9 |
| Slaton: | 0.0 |
| Stamford: | 17.4 |
| Abilene: | 19.9 |
| Lubbock: | 12.3 |
 25.9% incidents where reported in the morning and 74.1% in the evening. The most fires (15.2%) took place on Saturday, and the least (12.9%) on Tuesday.
 According to the 2,154 fire incidents from years 2002 - 2018 most fires (11.8%) took place during July, and the least (5.3%) in November.
 Out of all 4,431 cases reported during the years 2002 - 2018, the most belonged to the categories: Fire (48.6%), Hazardous Condition (30.9%), and Good Intent Call (7.9%).
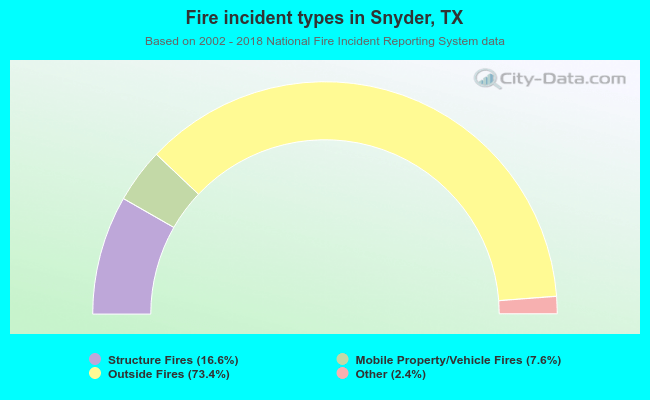 When looking into fire subcategories, the most incidents belonged to: Outside Fires (73.4%), and Structure Fires (16.6%).