Big Spring: Fire Incidents, Texas (TX)
Where are fire incidents reported in Big Spring, TX
Something went wrong! Please refresh the page.
| Fire incidents reported | |
|---|---|
| Sreet name | Count |
| I20 | 326 |
| I-20 | 118 |
| GREGG | 92 |
| 821 | 90 |
| FM 700 | 90 |
| 350 | 84 |
| S 87 | 76 |
| N 87 | 74 |
| JOHNSON | 58 |
| WASSON | 58 |
| 176 | 48 |
| GOLIAD | 46 |
| HWY 80 | 46 |
| RUNNELS | 46 |
| SYCAMORE | 42 |
| HWY 176 | 40 |
| NOLAN | 40 |
| 2ND | 38 |
| LANCASTER | 38 |
| CHANNING | 36 |
| MAIN | 36 |
| HAMILTON | 34 |
| HWY 350 | 34 |
| SCURRY | 34 |
| 8TH | 32 |
| N SERVICE RD | 32 |
| FM 821 | 30 |
| BIRDWELL | 28 |
| E HOWARD FIELD RD | 28 |
| 3RD | 26 |
| Other | 1,210 |
2003 - 2018 National Fire Incident Reporting System (NFIRS) incidents
- Incident types reported to NFIRS in Big Spring, TX
- 4,79450.6%Rescue & EMS
- 3,01031.8%Fire
- 7558.0%Hazardous Condition
- 3964.2%False Alarm
- 3743.9%Good Intent Call
- 991.0%Service Call
- 200.2%Overpressure Rupture
- 160.2%Special Incident
- Fire incident types reported to NFIRS in Big Spring, TX
- 1,88462.6%Outside Fires
- 57219.0%Structure Fires
- 38512.8%Mobile Property/Vehicle Fires
- 1695.6%Other
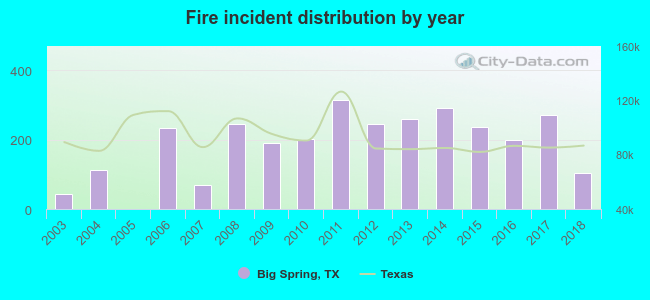 According to the data from the years 2003 - 2018 the average number of fire incidents per year is 188. The highest number of fires - 313 took place in 2011, and the least - 0 in 2005. The data has a growing trend.
The average number of yearly fire incidents per 10k residents in Big Spring, TX compared to nearest cities:
(Note: Based on data for the last 3 years, including only cities with population 5,000 and above)
| Big Spring: | 67.3 |
| Midland: | 23.6 |
| Lamesa: | 108.8 |
| Snyder: | 47.5 |
| Odessa: | 55.7 |
| Andrews: | 141.4 |
| Sweetwater: | 113.2 |
| West Odessa: | 36.0 |
| Seminole: | 2.8 |
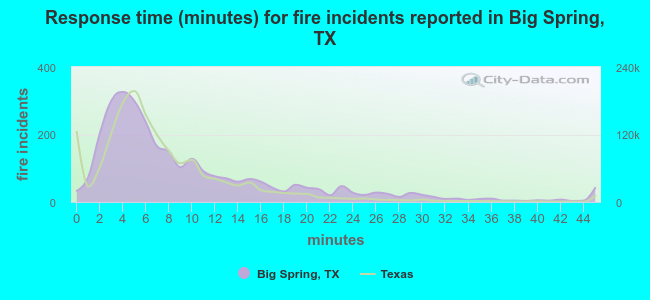 The median response time based on all reported fire incidents is 7 minutes. This is about the same as the state median value.
The median response time in Big Spring, TX compared to nearest cities:
(Note: Based on data for all years, including only cities with at least 500 fire incidents)
| Big Spring: | 7 minutes |
| Colorado City: | 6 minutes |
| Midland: | 6 minutes |
| Lamesa: | 6 minutes |
| Snyder: | 9 minutes |
| Odessa: | 6 minutes |
| Andrews: | 13 minutes |
| Sweetwater: | 4 minutes |
| Brownfield: | 6 minutes |
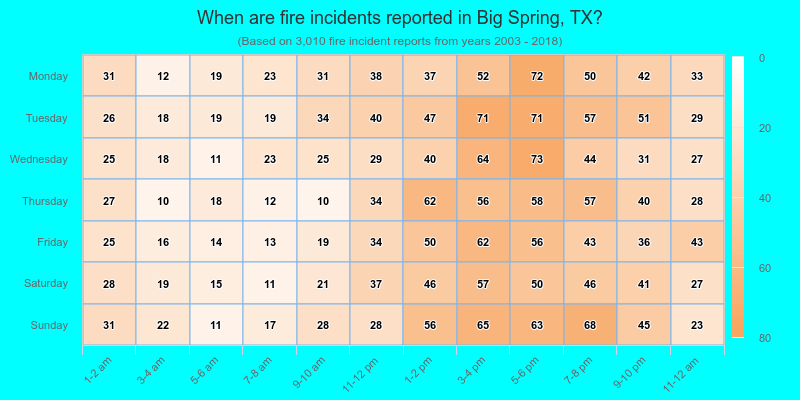
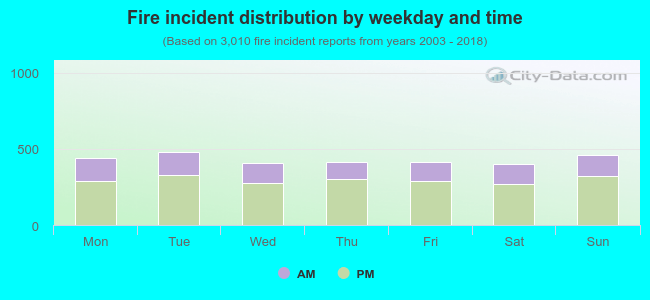 31.3% incidents where reported in the morning and 68.7% in the evening. The most fires (16.0%) took place on Tuesday, and the least (13.2%) on Saturday.
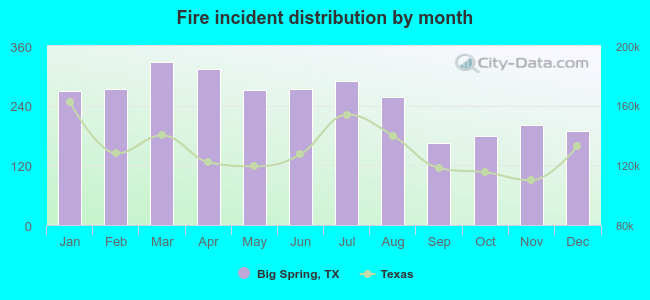 According to the 3,010 fires from years 2003 - 2018 most fires (10.9%) took place during March, and the least (5.5%) in September.
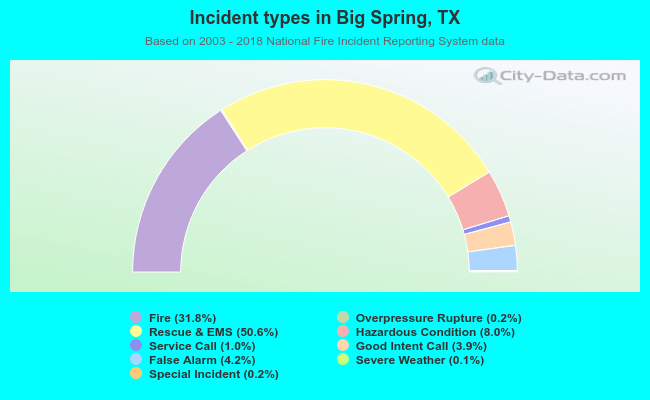 Out of all 9,470 cases reported during the years 2003 - 2018, the most belonged to the categories: Rescue & EMS (50.6%), Fire (31.8%), and Hazardous Condition (8.0%).
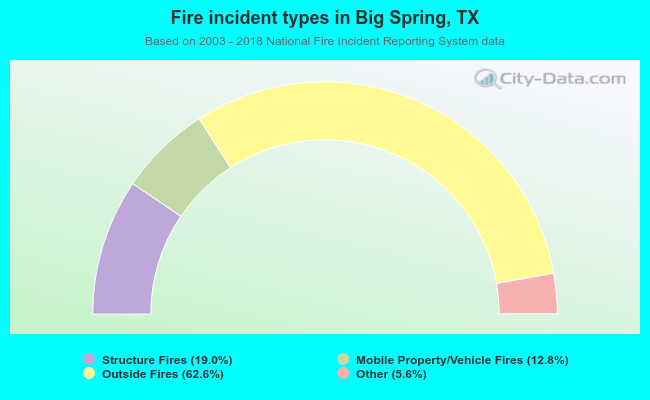 When looking into fire subcategories, the most reports belonged to: Outside Fires (62.6%), and Structure Fires (19.0%).