Pomona: Fire Incidents, California (CA)
Where are fire incidents reported in Pomona, CA
Something went wrong! Please refresh the page.
| Fire incidents reported | |
|---|---|
| Sreet name | Count |
| GAREY | 384 |
| HOLT | 322 |
| MISSION | 308 |
| TEMPLE | 238 |
| TOWNE | 192 |
| GRAND | 142 |
| KINGSLEY | 126 |
| WHITE | 124 |
| PARK | 116 |
| PHILLIPS | 116 |
| 2ND | 114 |
| RESERVOIR | 114 |
| SAN ANTONIO | 114 |
| 9TH | 100 |
| FOOTHILL | 94 |
| 1ST | 92 |
| 3RD | 88 |
| INDIAN HILL | 82 |
| ARROW | 76 |
| ORANGE GROVE | 72 |
| VALLEY | 72 |
| MONTEREY | 70 |
| EAST END | 62 |
| HAMILTON | 62 |
| PASADENA | 62 |
| BONITA | 60 |
| SAN BERNARDINO | 60 |
| LA VERNE | 56 |
| LEXINGTON | 56 |
| DUDLEY | 52 |
| Other | 389 |
2005 - 2018 National Fire Incident Reporting System (NFIRS) incidents
- Incident types reported to NFIRS in Pomona, CA
- 44,53365.2%Rescue & EMS
- 11,95017.5%Good Intent Call
- 4,0756.0%False Alarm
- 4,0155.9%Fire
- 1,9782.9%Hazardous Condition
- 1,5822.3%Service Call
- 1010.1%Special Incident
- Fire incident types reported to NFIRS in Pomona, CA
- 1,96849.0%Outside Fires
- 92223.0%Mobile Property/Vehicle Fires
- 86321.5%Structure Fires
- 2626.5%Other
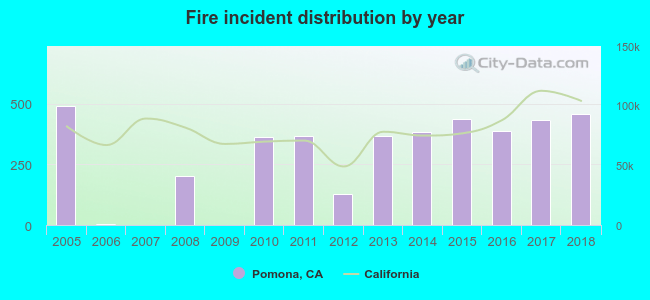 Based on the data from the years 2005 - 2018 the average number of fire incidents per year is 287. The highest number of reported fire incidents - 492 took place in 2005, and the least - 0 in 2007. The data has a declining trend.
The average number of yearly fire incidents per 10k residents in Pomona, CA compared to nearest cities:
(Note: Based on data for the last 3 years, including only cities with population 5,000 and above)
| Pomona: | 27.8 |
| Montclair: | 3.8 |
| La Verne: | 17.0 |
| Claremont: | 16.7 |
| San Dimas: | 14.6 |
| Chino: | 11.2 |
| Diamond Bar: | 9.5 |
| Chino Hills: | 5.7 |
| Walnut: | 8.6 |
 The median response time based on all reported fire incidents is 5 minutes. This is lower than the California median value.
The median response time in Pomona, CA compared to nearest cities:
(Note: Based on data for all years, including only cities with at least 500 fire incidents)
| Pomona: | 5 minutes |
| Montclair: | 6 minutes |
| La Verne: | 5 minutes |
| Claremont: | 5 minutes |
| San Dimas: | 5 minutes |
| Chino: | 6 minutes |
| Diamond Bar: | 6 minutes |
| Ontario: | 6 minutes |
| Covina: | 4 minutes |
 37.2% incidents where reported in the morning and 62.8% in the evening. The most fires (15.4%) took place on Sunday, and the least (13.0%) on Thursday.
 Based on the 4,015 fire incidents from years 2005 - 2018 most fires (9.7%) took place during January, and the least (6.6%) in December.
 Out of all 68,261 cases reported during the years 2005 - 2018, the most belonged to the categories: Rescue & EMS (65.2%), Good Intent Call (17.5%), and False Alarm (6.0%).
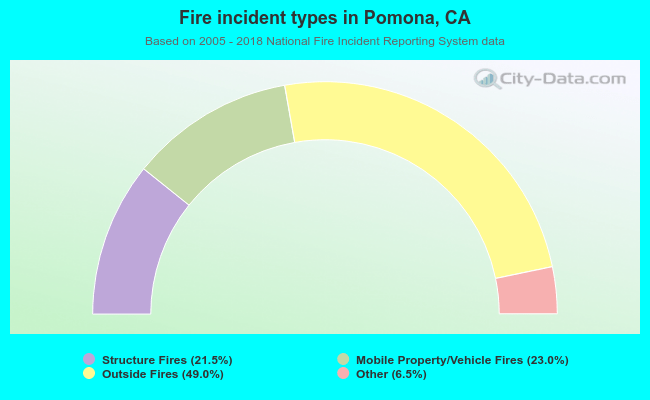 When looking into fire subcategories, the most incidents belonged to: Outside Fires (49.0%), and Mobile Property/Vehicle Fires (23.0%).