Chino Hills: Fire Incidents, California (CA)
Where are fire incidents reported in Chino Hills, CA
Something went wrong! Please refresh the page.
|
| |||||||||||||||||||||||||||||||||||||||||||||||||||||||||||||||||||||||||||||||||||||||||||||||||||||||||||||
2005 - 2018 National Fire Incident Reporting System (NFIRS) incidents
- Incident types reported to NFIRS in Chino Hills, CA
- 4,57372.2%Rescue & EMS
- 6139.7%Good Intent Call
- 4447.0%Service Call
- 3635.7%False Alarm
- 2023.2%Fire
- 1242.0%Hazardous Condition
- Fire incident types reported to NFIRS in Chino Hills, CA
- 7436.6%Outside Fires
- 7235.6%Structure Fires
- 5125.2%Mobile Property/Vehicle Fires
- 52.5%Other
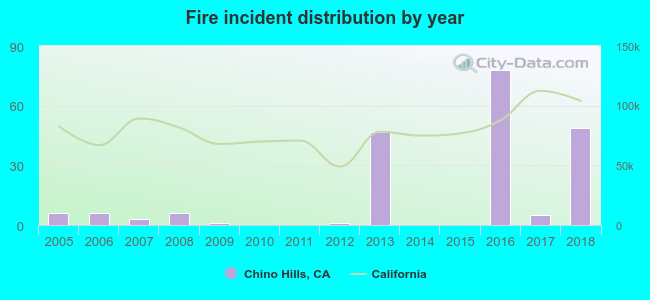 According to the data from the years 2005 - 2018 the average number of fire incidents per year is 14. The highest number of reported fire incidents - 78 took place in 2016, and the least - 0 in 2010. The data has a rising trend.
The average number of yearly fire incidents per 10k residents in Chino Hills, CA compared to nearest cities:
(Note: Based on data for the last 3 years, including only cities with population 5,000 and above)
| Chino Hills: | 5.7 |
| Chino: | 11.2 |
| Diamond Bar: | 9.5 |
| Pomona: | 27.8 |
| Montclair: | 3.8 |
| Yorba Linda: | 6.8 |
| Ontario: | 9.3 |
| Eastvale: | 0.2 |
| Walnut: | 8.6 |
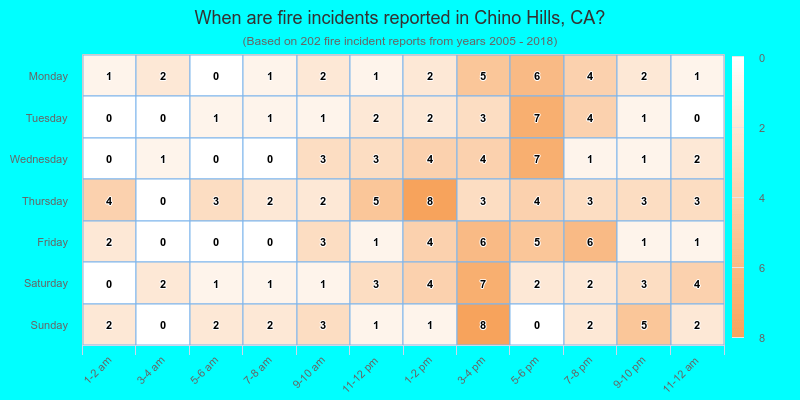
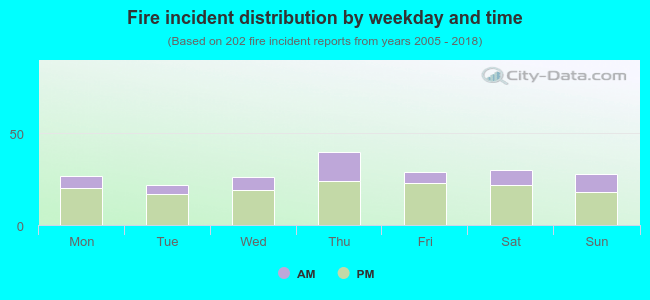 29.2% incidents where reported in the morning and 70.8% in the evening. The most fires (19.8%) took place on Thursday, and the least (10.9%) on Tuesday.
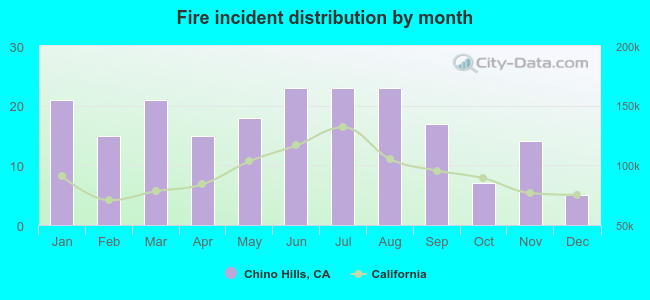 According to the 202 fire incidents from years 2005 - 2018 most fires (11.4%) took place during June, and the least (2.5%) in December.
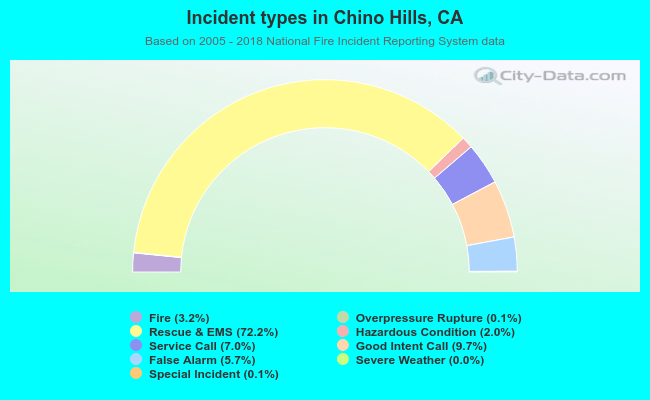 Out of all 6,330 cases reported during the years 2005 - 2018, the most belonged to the categories: Rescue & EMS (72.2%), Good Intent Call (9.7%), and Service Call (7.0%).
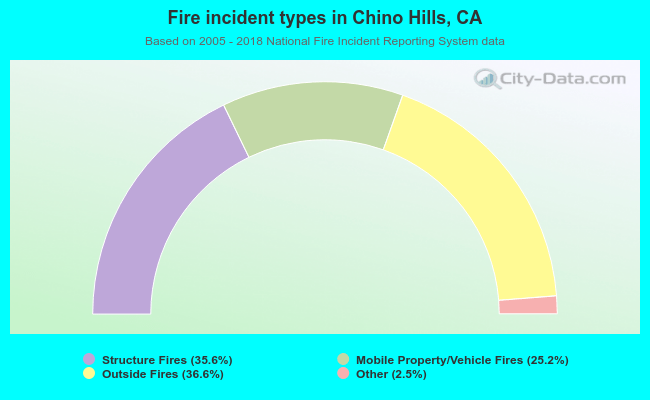 When looking into fire subcategories, the most reports belonged to: Outside Fires (36.6%), and Structure Fires (35.6%).