Menasha: Fire Incidents, Wisconsin (WI)
Where are fire incidents reported in Menasha, WI
Something went wrong! Please refresh the page.
| Fire incidents reported | |
|---|---|
| Sreet name | Count |
| THIRD ST | 134 |
| LAKE ST | 52 |
| APPLETON RD | 46 |
| AIRPORT RD | 42 |
| LUCERNE DR | 40 |
| MIDWAY RD | 36 |
| RACINE ST | 36 |
| RACINE RD | 34 |
| BROAD ST | 30 |
| SIXTH ST | 30 |
| PLANK RD | 28 |
| MAIN ST | 26 |
| SEVENTH ST | 26 |
| TAYCO ST | 22 |
| WASHINGTON ST | 22 |
| EARL ST | 20 |
| FIRST ST | 20 |
| GENEVA RD | 20 |
| LAKESHORE DR | 20 |
| VALLEY RD | 16 |
| APPLETON ST | 14 |
| DE PERE ST | 14 |
| MANITOWOC RD | 14 |
| BRIGHTON BEACH RD | 12 |
| GROVE ST | 12 |
| MILWAUKEE ST | 12 |
| ONEIDA ST | 12 |
| CHUTE ST | 10 |
| SECOND ST | 10 |
| WARSAW ST | 10 |
2002 - 2018 National Fire Incident Reporting System (NFIRS) incidents
- Incident types reported to NFIRS in Menasha, WI
- 4,31058.3%Rescue & EMS
- 85611.6%Hazardous Condition
- 7299.9%Fire
- 6468.7%False Alarm
- 5026.8%Service Call
- 2323.1%Good Intent Call
- 1021.4%Special Incident
- 150.2%Overpressure Rupture
- Fire incident types reported to NFIRS in Menasha, WI
- 43359.4%Structure Fires
- 16322.4%Outside Fires
- 10514.4%Mobile Property/Vehicle Fires
- 283.8%Other
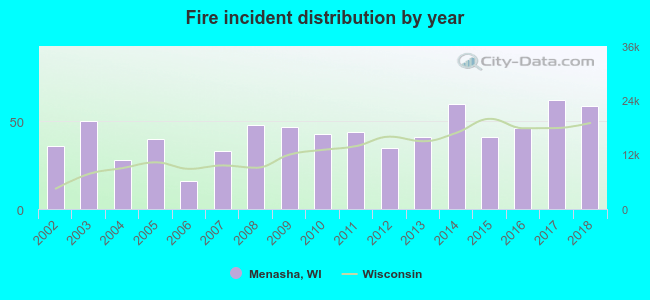 Based on the data from the years 2002 - 2018 the average number of fires per year is 43. The highest number of fire incidents - 62 took place in 2017, and the least - 16 in 2006. The data has a rising trend.
The average number of yearly fire incidents per 10k residents in Menasha, WI compared to nearest cities:
(Note: Based on data for the last 3 years, including only cities with population 5,000 and above)
| Menasha: | 31.6 |
| Neenah: | 32.4 |
| Appleton: | 17.6 |
| Grand Chute: | 32.3 |
| Harrison: | 9.8 |
| Kimberly: | 14.9 |
| Buchanan: | 1.5 |
| Little Chute: | 11.4 |
| Greenville: | 20.4 |
 The median response time based on all reported fire incidents is 5 minutes. This is lower than the state median value.
 According to the reports from the years 2002 - 2018 the average number of fire-related yearly casualties is 1. The highest number of casualties - 6 took place in 2005, and the lowest - 0 in 2002. The data has a growing trend.
The average number of casualties per 1,000 fires is 23. This indicator was the highest - 150 in 2005, and the lowest 0 in 2002. The trend for casualties per 1,000 fires is increasing. Compared to the Wisconsin value the number of injuries per 1,000 fire incidents is much higher.
According to the reports from the years 2002 - 2018 the average number of fire-related yearly casualties is 1. The highest number of casualties - 6 took place in 2005, and the lowest - 0 in 2002. The data has a growing trend.
The average number of casualties per 1,000 fires is 23. This indicator was the highest - 150 in 2005, and the lowest 0 in 2002. The trend for casualties per 1,000 fires is increasing. Compared to the Wisconsin value the number of injuries per 1,000 fire incidents is much higher.
 31.8% incidents where reported in the morning and 68.2% in the evening. The most fires (16.7%) took place on Friday, and the least (12.5%) on Tuesday.
 According to the 729 reports from years 2002 - 2018 most fires (11.4%) took place during June, and the least (4.5%) in November.
 Out of all 7,393 cases reported during the years 2002 - 2018, the most belonged to the categories: Rescue & EMS (58.3%), Hazardous Condition (11.6%), and Fire (9.9%).
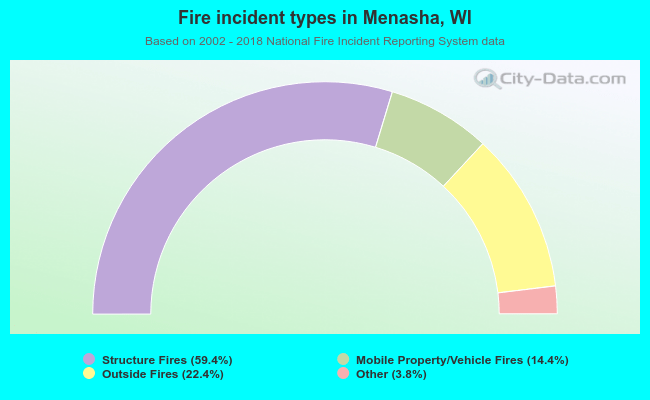 When looking into fire subcategories, the most reports belonged to: Structure Fires (59.4%), and Outside Fires (22.4%).