Grand Chute: Fire Incidents, Wisconsin (WI)
Where are fire incidents reported in Grand Chute, WI
Something went wrong! Please refresh the page.
| Fire incidents reported | |
|---|---|
| Sreet name | Count |
| WISCONSIN AVE | 140 |
| HWY 41 | 132 |
| COLLEGE AVE | 98 |
| CASALOMA DR | 72 |
| SPENCER ST | 66 |
| BLUEMOUND DR | 46 |
| NICOLET RD | 46 |
| WESTHILL BLVD | 46 |
| FOURTH ST | 42 |
| RICHMOND ST | 38 |
| BROADWAY DR | 32 |
| MICHAELS DR | 32 |
| NEUBERT RD | 30 |
| LAWRENCE ST | 26 |
| LYNNDALE DR | 26 |
| MAYFLOWER DR | 26 |
| MUTUAL WAY | 26 |
| PERKINS ST | 24 |
| RUSSET CT | 24 |
| GREEN MEADOW DR | 22 |
| MCCARTHY RD | 22 |
| PERSHING ST | 22 |
| EDGEWOOD DR | 20 |
| GILLETT ST | 18 |
| GLENPARK DR | 18 |
| KOOLS ST | 18 |
| PARKRIDGE AVE | 18 |
| GLEN CREEK PL | 16 |
| NORTHLAND AVE | 16 |
| PENNSYLVANIA AVE | 16 |
2002 - 2018 National Fire Incident Reporting System (NFIRS) incidents
- Incident types reported to NFIRS in Grand Chute, WI
- 5,95049.7%Rescue & EMS
- 1,91816.0%Hazardous Condition
- 1,44412.1%Good Intent Call
- 9688.1%Fire
- 8827.4%False Alarm
- 7676.4%Service Call
- 200.2%Overpressure Rupture
- 140.1%Special Incident
- Fire incident types reported to NFIRS in Grand Chute, WI
- 41843.2%Structure Fires
- 27027.9%Outside Fires
- 26026.9%Mobile Property/Vehicle Fires
- 202.1%Other
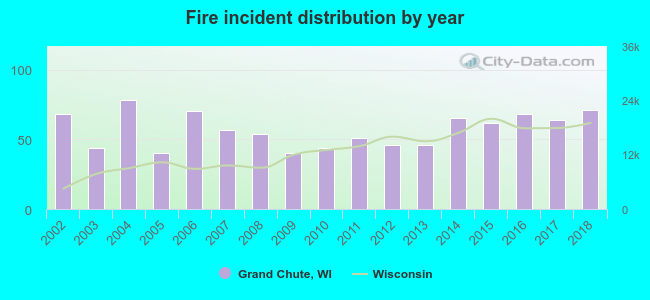 According to the data from the years 2002 - 2018 the average number of fires per year is 57. The highest number of fires - 78 took place in 2004, and the least - 40 in 2005. The data has an increasing trend.
The average number of yearly fire incidents per 10k residents in Grand Chute, WI compared to nearest cities:
(Note: Based on data for the last 3 years, including only cities with population 5,000 and above)
| Grand Chute: | 32.3 |
| Appleton: | 17.6 |
| Menasha: | 31.6 |
| Kimberly: | 14.9 |
| Greenville: | 20.4 |
| Little Chute: | 11.4 |
| Buchanan: | 1.5 |
| Harrison: | 9.8 |
| Neenah: | 32.4 |
 The median response time based on all reported fire incidents is 5 minutes. This is lower than the state median value.
The median response time in Grand Chute, WI compared to nearest cities:
(Note: Based on data for all years, including only cities with at least 500 fire incidents)
| Grand Chute: | 5 minutes |
| Appleton: | 5 minutes |
| Menasha: | 5 minutes |
| Neenah: | 5 minutes |
| Kaukauna: | 6 minutes |
| Oshkosh: | 5 minutes |
| De Pere: | 6 minutes |
| Green Bay: | 5 minutes |
 Based on the data from the years 2002 - 2018 the average number of fire-related yearly casualties is 2. The highest number of reported casualties - 5 took place in 2016, and the lowest - 0 in 2003. The data has an increasing trend.
The average number of casualties per 1,000 fire incidents is 37. This indicator was the highest - 100 in 2009, and the lowest 0 in 2003. The trend for injuries per 1,000 fire incidents is rising. Compared to the Wisconsin value the number of injuries per 1,000 fires is much higher.
Based on the data from the years 2002 - 2018 the average number of fire-related yearly casualties is 2. The highest number of reported casualties - 5 took place in 2016, and the lowest - 0 in 2003. The data has an increasing trend.
The average number of casualties per 1,000 fire incidents is 37. This indicator was the highest - 100 in 2009, and the lowest 0 in 2003. The trend for injuries per 1,000 fire incidents is rising. Compared to the Wisconsin value the number of injuries per 1,000 fires is much higher.
 33.5% incidents where reported in the morning and 66.5% in the evening. The most fires (18.2%) took place on Saturday, and the least (12.2%) on Sunday.
 Based on the 968 fires from years 2002 - 2018 most fires (10.6%) took place during April, and the least (5.6%) in September.
 Out of all 11,971 cases reported during the years 2002 - 2018, the most belonged to the categories: Rescue & EMS (49.7%), Hazardous Condition (16.0%), and Good Intent Call (12.1%).
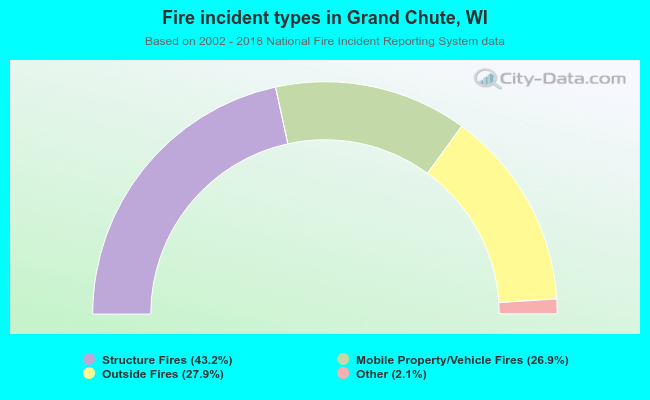 When looking into fire subcategories, the most reports belonged to: Structure Fires (43.2%), and Outside Fires (27.9%).