Irving: Fire Incidents, Texas (TX)
Where are fire incidents reported in Irving, TX
Something went wrong! Please refresh the page.
| Fire incidents reported | |
|---|---|
| Sreet name | Count |
| N MACARTHUR BLVD | 348 |
| N BELTLINE RD | 278 |
| W AIRPORT FRWY | 270 |
| W PIONEER DR | 270 |
| W WALNUT HILL LN | 252 |
| W NORTHGATE DR | 242 |
| ESTERS RD | 208 |
| MACARTHUR BLVD | 190 |
| N OCONNOR RD | 180 |
| NORTHGATE DR | 170 |
| BELT LINE RD | 166 |
| W ROCHELLE RD | 150 |
| PIONEER DR | 144 |
| STORY RD | 144 |
| ESTRADA PKWY | 134 |
| WALNUT HILL LN | 130 |
| N NURSERY RD | 116 |
| ESTERS RD | 112 |
| ROCK ISLAND RD | 108 |
| BLOCK DR | 104 |
| E GRAUWYLER RD | 102 |
| E NORTHGATE DR | 96 |
| E AIRPORT FRWY | 92 |
| FINLEY RD | 88 |
| W SHADY GROVE RD | 84 |
| OCONNOR RD | 82 |
| ROCHELLE RD | 82 |
| NURSERY RD | 80 |
| W IRVING BLVD | 80 |
| AIRPORT | 78 |
| Other | 3,611 |
2003 - 2018 National Fire Incident Reporting System (NFIRS) incidents
- Incident types reported to NFIRS in Irving, TX
- 68,89160.8%Rescue & EMS
- 11,80910.4%False Alarm
- 11,0839.8%Hazardous Condition
- 8,6997.7%Service Call
- 8,1917.2%Fire
- 4,1293.6%Good Intent Call
- 3090.3%Overpressure Rupture
- 1180.1%Special Incident
- Fire incident types reported to NFIRS in Irving, TX
- 3,34540.8%Outside Fires
- 2,45830.0%Structure Fires
- 1,83022.3%Mobile Property/Vehicle Fires
- 5586.8%Other
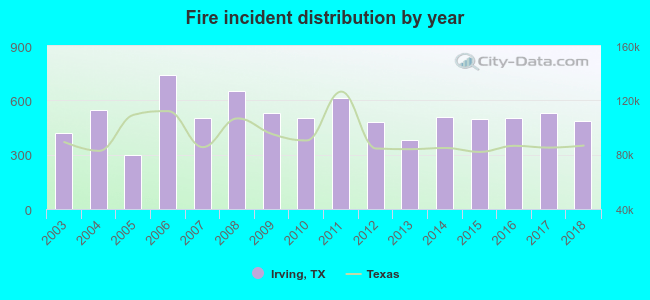 Based on the data from the years 2003 - 2018 the average number of fires per year is 512. The highest number of fires - 741 took place in 2006, and the least - 299 in 2005. The data has an increasing trend.
The average number of yearly fire incidents per 10k residents in Irving, TX compared to nearest cities:
(Note: Based on data for the last 3 years, including only cities with population 5,000 and above)
| Irving: | 21.8 |
| Euless: | 29.7 |
| Farmers Branch: | 29.3 |
| Coppell: | 20.3 |
| Grapevine: | 35.5 |
| Grand Prairie: | 27.7 |
| Highland Park: | 13.0 |
| Bedford: | 29.2 |
| University Park: | 15.3 |
 The median response time based on all reported fire incidents is 5 minutes. This is lower than the state median value.
The median response time in Irving, TX compared to nearest cities:
(Note: Based on data for all years, including only cities with at least 500 fire incidents)
| Irving: | 5 minutes |
| Euless: | 5 minutes |
| Farmers Branch: | 5 minutes |
| Coppell: | 5 minutes |
| Grapevine: | 5 minutes |
| Grand Prairie: | 7 minutes |
| Bedford: | 4 minutes |
| University Park: | 5 minutes |
| Carrollton: | 5 minutes |
 According to the reports from the years 2003 - 2018 the average number of fire-related fatalities per year is 0. The highest number of deaths - 2 took place in 2015, and the lowest - 0 in 2003. The data has a constant trend.
The average number of deaths per 1,000 fires is 1. This indicator was the highest - 4 in 2015, and the lowest 0 in 2003. The trend for fatalities per 1,000 fires is dropping. Compared to the Texas value the number of fatalities per 1,000 fires is much lower.
According to the reports from the years 2003 - 2018 the average number of fire-related fatalities per year is 0. The highest number of deaths - 2 took place in 2015, and the lowest - 0 in 2003. The data has a constant trend.
The average number of deaths per 1,000 fires is 1. This indicator was the highest - 4 in 2015, and the lowest 0 in 2003. The trend for fatalities per 1,000 fires is dropping. Compared to the Texas value the number of fatalities per 1,000 fires is much lower.Deaths per 1,000 incidents in Irving, TX compared to nearest cities:
(Note: Based on data for all years, including only cities with at least 2,500 fire incidents)
| Irving: | 0.7 |
| Euless: | 1.3 |
| Grapevine: | 0.6 |
| Grand Prairie: | 3.9 |
| Bedford: | 1.5 |
| Carrollton: | 1.7 |
| Dallas: | 1.5 |
| Arlington: | 1.9 |
| Lewisville: | 2.2 |
 Based on the data from the years 2003 - 2018 the average number of fire-related yearly casualties is 4. The highest number of injuries - 10 took place in 2015, and the lowest - 0 in 2011. The data has a decreasing trend.
The average number of injuries per 1,000 fires is 7. This indicator was the highest - 20 in 2015, and the lowest 0 in 2011. The trend for casualties per 1,000 fire incidents is dropping. Compared to the state value the number of injuries per 1,000 fire incidents is about the same.
Based on the data from the years 2003 - 2018 the average number of fire-related yearly casualties is 4. The highest number of injuries - 10 took place in 2015, and the lowest - 0 in 2011. The data has a decreasing trend.
The average number of injuries per 1,000 fires is 7. This indicator was the highest - 20 in 2015, and the lowest 0 in 2011. The trend for casualties per 1,000 fire incidents is dropping. Compared to the state value the number of injuries per 1,000 fire incidents is about the same.Casualties per 1,000 incidents in Irving, TX compared to nearest cities:
(Note: Based on data for all years, including only cities with at least 500 fire incidents)
| Irving: | 7.0 |
| Euless: | 35.9 |
| Farmers Branch: | 14.7 |
| Coppell: | 8.6 |
| Grapevine: | 9.2 |
| Grand Prairie: | 20.4 |
| Bedford: | 30.9 |
| University Park: | 5.9 |
| Carrollton: | 14.1 |
 30.9% incidents where reported in the morning and 69.1% in the evening. The most fires (15.7%) took place on Sunday, and the least (13.2%) on Friday.
 According to the 8,191 reports from years 2003 - 2018 most fires (10.6%) took place during July, and the least (6.8%) in April.
 Out of all 113,266 cases reported during the years 2003 - 2018, the most belonged to the categories: Rescue & EMS (60.8%), False Alarm (10.4%), and Hazardous Condition (9.8%).
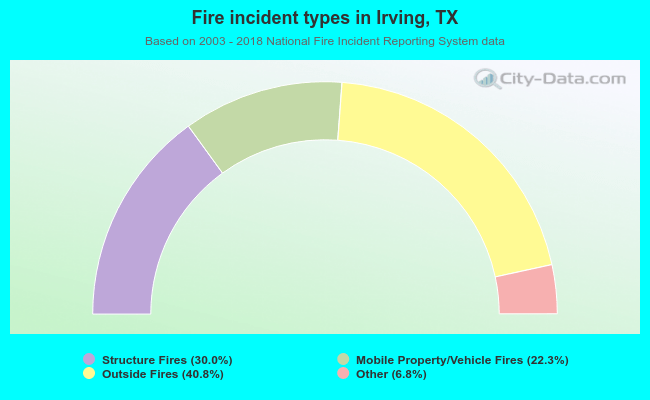 When looking into fire subcategories, the most reports belonged to: Outside Fires (40.8%), and Structure Fires (30.0%).