Farmers Branch: Fire Incidents, Texas (TX)
Where are fire incidents reported in Farmers Branch, TX
Something went wrong! Please refresh the page.
| Fire incidents reported | |
|---|---|
| Sreet name | Count |
| VALLEY VIEW LN | 114 |
| STEMMONS | 106 |
| MIDWAY RD | 84 |
| SPRING VALLEY RD | 78 |
| HERITAGE CIR | 72 |
| JOSEY LN | 72 |
| LBJ FWY | 72 |
| LBJ | 62 |
| COOKSCREEK PL | 56 |
| LUNA RD | 48 |
| STEMMONS FWY | 42 |
| ALPHA RD | 38 |
| VALLEY BRANCH LN | 36 |
| DENTON DR | 34 |
| VALLEY VIEW LANE | 34 |
| FYKE RD | 32 |
| VALWOOD PKWY | 32 |
| JOSEY LANE | 30 |
| ST LAWRENCE CIR | 30 |
| WEBB CHAPEL RD | 30 |
| DIPLOMAT DR | 28 |
| ENTERPRISE DR | 28 |
| INWOOD RD | 28 |
| HEARTSIDE PL | 26 |
| SPRING VALLEY ROAD | 26 |
| BELT LINE RD | 22 |
| GARDEN BROOK DR | 22 |
| SENLAC DR | 22 |
| BEE ST | 20 |
| BIRCHLAWN DR | 18 |
| Other | 89 |
2002 - 2018 National Fire Incident Reporting System (NFIRS) incidents
- Incident types reported to NFIRS in Farmers Branch, TX
- 12,17553.5%Rescue & EMS
- 2,58511.3%False Alarm
- 2,45510.8%Hazardous Condition
- 2,30110.1%Service Call
- 1,7647.7%Good Intent Call
- 1,4316.3%Fire
- 570.3%Overpressure Rupture
- Fire incident types reported to NFIRS in Farmers Branch, TX
- 55238.6%Structure Fires
- 51636.1%Outside Fires
- 28820.1%Mobile Property/Vehicle Fires
- 755.2%Other
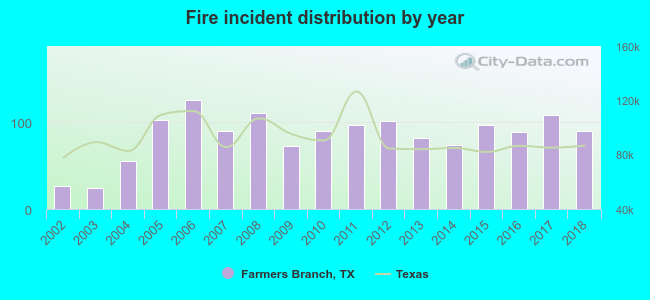 Based on the data from the years 2002 - 2018 the average number of fire incidents per year is 84. The highest number of reported fires - 125 took place in 2006, and the least - 24 in 2003. The data has a rising trend.
The average number of yearly fire incidents per 10k residents in Farmers Branch, TX compared to nearest cities:
(Note: Based on data for the last 3 years, including only cities with population 5,000 and above)
| Farmers Branch: | 29.3 |
| Addison: | 50.9 |
| Carrollton: | 24.4 |
| Coppell: | 20.3 |
| University Park: | 15.3 |
| Irving: | 21.8 |
| Highland Park: | 13.0 |
| Richardson: | 18.0 |
| Dallas: | 16.3 |
 The median response time based on all reported fire incidents is 5 minutes. This is lower compared to the Texas median value.
The median response time in Farmers Branch, TX compared to nearest cities:
(Note: Based on data for all years, including only cities with at least 500 fire incidents)
| Farmers Branch: | 5 minutes |
| Addison: | 5 minutes |
| Carrollton: | 5 minutes |
| Coppell: | 5 minutes |
| University Park: | 5 minutes |
| Irving: | 5 minutes |
| Richardson: | 5 minutes |
| Dallas: | 4 minutes |
| Lewisville: | 5 minutes |
 According to the reports from the years 2002 - 2018 the average number of fire-related yearly casualties is 1. The highest number of injuries - 4 took place in 2016, and the lowest - 0 in 2002. The data has an increasing trend.
The average number of casualties per 1,000 fires is 14. This indicator was the highest - 45 in 2016, and the lowest 0 in 2002. The trend for casualties per 1,000 incidents is rising. Compared to the state value the number of casualties per 1,000 incidents is higher.
According to the reports from the years 2002 - 2018 the average number of fire-related yearly casualties is 1. The highest number of injuries - 4 took place in 2016, and the lowest - 0 in 2002. The data has an increasing trend.
The average number of casualties per 1,000 fires is 14. This indicator was the highest - 45 in 2016, and the lowest 0 in 2002. The trend for casualties per 1,000 incidents is rising. Compared to the state value the number of casualties per 1,000 incidents is higher.Casualties per 1,000 incidents in Farmers Branch, TX compared to nearest cities:
(Note: Based on data for all years, including only cities with at least 500 fire incidents)
| Farmers Branch: | 14.7 |
| Addison: | 4.6 |
| Carrollton: | 14.1 |
| Coppell: | 8.6 |
| University Park: | 5.9 |
| Irving: | 7.0 |
| Richardson: | 24.9 |
| Dallas: | 5.8 |
| Lewisville: | 8.1 |
 32.4% incidents where reported in the morning and 67.6% in the evening. The most fires (16.1%) took place on Thursday, and the least (12.6%) on Tuesday.
 According to the 1,431 reports from years 2002 - 2018 most fires (10.6%) took place during June, and the least (6.6%) in May.
 Out of all 22,777 cases reported during the years 2002 - 2018, the most belonged to the categories: Rescue & EMS (53.5%), False Alarm (11.3%), and Hazardous Condition (10.8%).
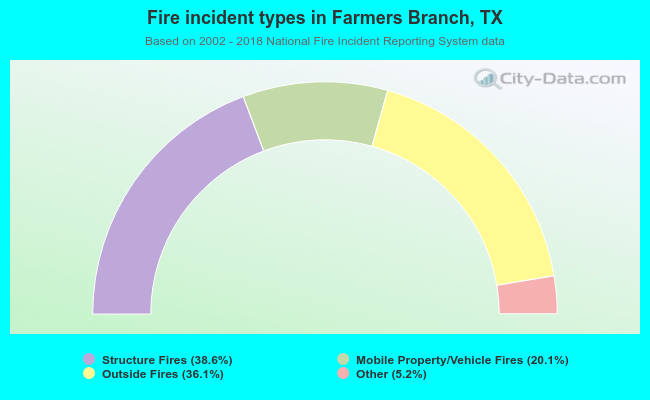 When looking into fire subcategories, the most reports belonged to: Structure Fires (38.6%), and Outside Fires (36.1%).