Hillside: Fire Incidents, Illinois (IL)
Where are fire incidents reported in Hillside, IL
Something went wrong! Please refresh the page.
| Fire incidents reported | |
|---|---|
| Sreet name | Count |
| WOLF RD | 352 |
| FRONTAGE RD | 148 |
| MANNHEIM RD | 126 |
| BUTTERFIELD RD | 94 |
| ROOSEVELT RD | 54 |
| BUTTERFIELD | 50 |
| HILLSIDE AVE | 38 |
| FRONTAGE | 34 |
| HARRISON ST | 32 |
| WOLF | 30 |
| HILLSIDE | 28 |
| CLAYTON RD | 24 |
| EAST END AVE | 24 |
| LIND AVE | 24 |
| WARREN | 24 |
| JACKSON BLVD | 22 |
| TAFT AVE | 20 |
| EAST END | 18 |
| FOREST | 18 |
| TERRACE | 18 |
| WARREN AVE | 16 |
| WASHINGTON BLVD | 16 |
| ELM ST | 14 |
| IROQUOIS | 14 |
| LAVERNE | 14 |
| MANNHEIM | 14 |
| MAPLE | 14 |
| ELECTRIC AVE | 12 |
| MELROSE | 12 |
| ORCHARD | 12 |
2002 - 2018 National Fire Incident Reporting System (NFIRS) incidents
- Incident types reported to NFIRS in Hillside, IL
- 6,74154.8%Rescue & EMS
- 1,40011.4%False Alarm
- 1,34110.9%Hazardous Condition
- 1,1169.1%Fire
- 8336.8%Service Call
- 8096.6%Good Intent Call
- 380.3%Special Incident
- 190.2%Overpressure Rupture
- Fire incident types reported to NFIRS in Hillside, IL
- 69862.5%Structure Fires
- 18016.1%Outside Fires
- 16815.1%Mobile Property/Vehicle Fires
- 706.3%Other
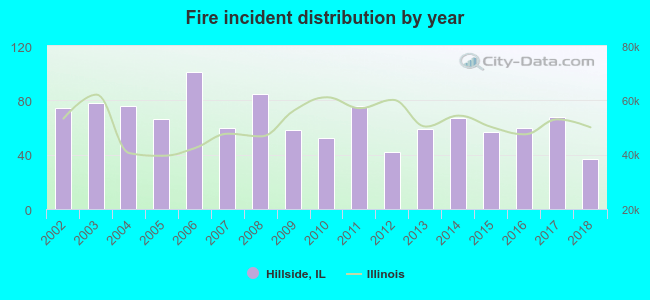 Based on the data from the years 2002 - 2018 the average number of fire incidents per year is 66. The highest number of reported fire incidents - 101 took place in 2006, and the least - 37 in 2018. The data has a dropping trend.
The average number of yearly fire incidents per 10k residents in Hillside, IL compared to nearest cities:
(Note: Based on data for the last 3 years, including only cities with population 5,000 and above)
| Hillside: | 67.1 |
| Berkeley: | 82.2 |
| Bellwood: | 43.3 |
| Westchester: | 37.1 |
| Elmhurst: | 18.9 |
| Broadview: | 57.0 |
| Northlake: | 33.7 |
| Melrose Park: | 35.1 |
| Maywood: | 58.8 |
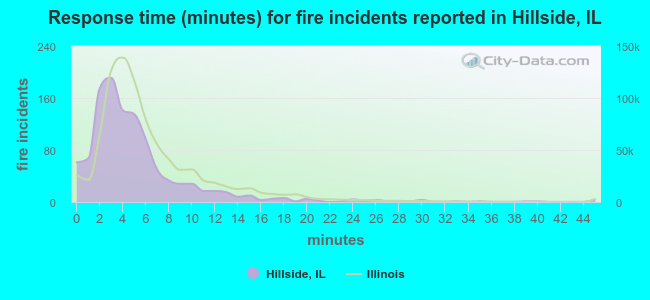 The median response time based on all reported fire incidents is 4 minutes. This is lower compared to the Illinois median value.
The median response time in Hillside, IL compared to nearest cities:
(Note: Based on data for all years, including only cities with at least 500 fire incidents)
| Hillside: | 4 minutes |
| Berkeley: | 4 minutes |
| Bellwood: | 3 minutes |
| Westchester: | 4 minutes |
| Elmhurst: | 5 minutes |
| Broadview: | 3 minutes |
| Northlake: | 5 minutes |
| Melrose Park: | 4 minutes |
| Maywood: | 3 minutes |
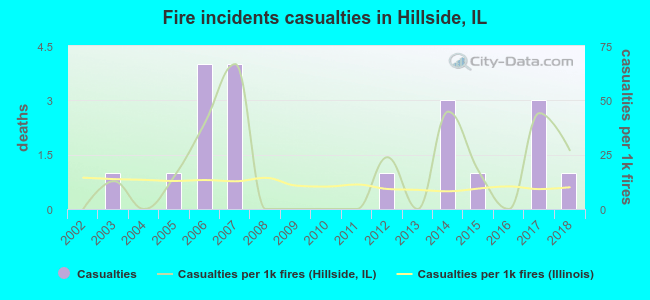 According to the reports from the years 2002 - 2018 the average number of fire-related casualties per year is 1. The highest number of injuries - 4 took place in 2006, and the lowest - 0 in 2002. The data has an increasing trend.
The average number of casualties per 1,000 fire incidents is 17. This indicator was the highest - 67 in 2007, and the lowest 0 in 2002. The trend for injuries per 1,000 incidents is rising. Compared to the state value the number of casualties per 1,000 fires is higher.
According to the reports from the years 2002 - 2018 the average number of fire-related casualties per year is 1. The highest number of injuries - 4 took place in 2006, and the lowest - 0 in 2002. The data has an increasing trend.
The average number of casualties per 1,000 fire incidents is 17. This indicator was the highest - 67 in 2007, and the lowest 0 in 2002. The trend for injuries per 1,000 incidents is rising. Compared to the state value the number of casualties per 1,000 fires is higher.Casualties per 1,000 incidents in Hillside, IL compared to nearest cities:
(Note: Based on data for all years, including only cities with at least 500 fire incidents)
| Hillside: | 17.0 |
| Berkeley: | 7.5 |
| Bellwood: | 5.1 |
| Westchester: | 15.6 |
| Elmhurst: | 9.7 |
| Broadview: | 17.9 |
| Northlake: | 4.7 |
| Melrose Park: | 12.3 |
| Maywood: | 6.1 |
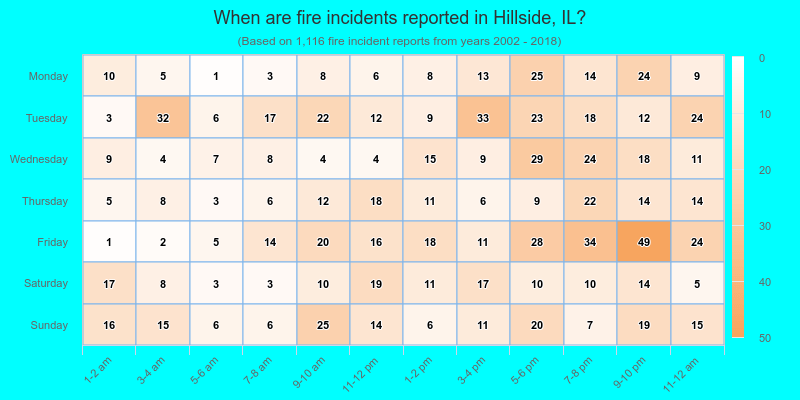
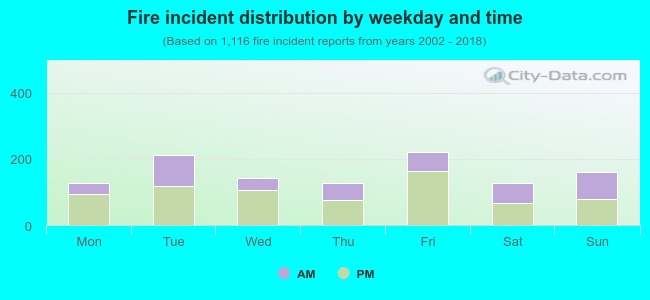 37.0% incidents where reported in the morning and 63.0% in the evening. The most fires (19.9%) took place on Friday, and the least (11.3%) on Monday.
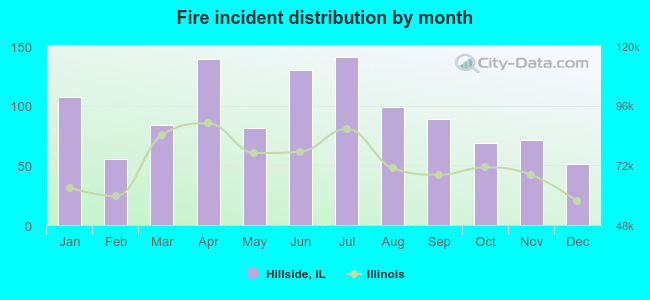 According to the 1,116 fires from years 2002 - 2018 most fires (12.6%) took place during July, and the least (4.6%) in December.
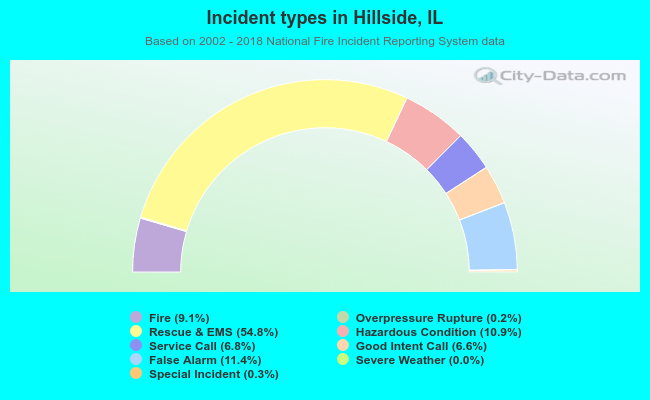 Out of all 12,301 cases reported during the years 2002 - 2018, the most belonged to the categories: Rescue & EMS (54.8%), False Alarm (11.4%), and Hazardous Condition (10.9%).
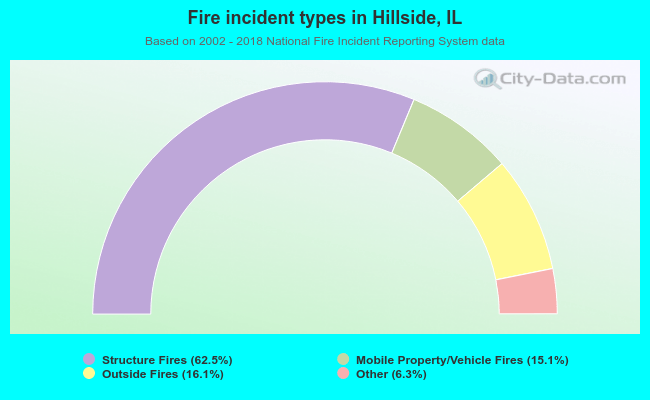 When looking into fire subcategories, the most reports belonged to: Structure Fires (62.5%), and Outside Fires (16.1%).