Elmhurst: Fire Incidents, Illinois (IL)
Where are fire incidents reported in Elmhurst, IL
Something went wrong! Please refresh the page.
| Fire incidents reported | |
|---|---|
| Sreet name | Count |
| YORK RD | 192 |
| I290 | 172 |
| I 290 | 94 |
| NORTH AVE | 80 |
| RTE. 83 | 66 |
| ST CHARLES RD | 66 |
| YORK | 62 |
| BUTTERFIELD RD | 56 |
| LAKE ST | 54 |
| SPRING RD | 48 |
| YORK ST | 46 |
| RTE 83 | 42 |
| FIRST ST | 40 |
| GRAND AVE | 38 |
| SCHILLER ST | 34 |
| KENILWORTH AVE | 30 |
| FAIRFIELD AVE | 28 |
| INDUSTRIAL DR | 28 |
| ROOSEVELT RD | 28 |
| WILLOW RD | 28 |
| ADDISON AVE | 24 |
| MITCHELL | 24 |
| OAKLAWN AVE | 24 |
| POPLAR AVE | 22 |
| ST. CHARLES RD | 22 |
| CRESCENT AVE | 20 |
| LARCH AVE | 20 |
| PROSPECT AVE | 20 |
| THIRD ST | 20 |
| VALLETTE ST | 20 |
| Other | 201 |
2002 - 2018 National Fire Incident Reporting System (NFIRS) incidents
- Incident types reported to NFIRS in Elmhurst, IL
- 10,10943.0%Rescue & EMS
- 4,11817.5%Hazardous Condition
- 4,05117.2%False Alarm
- 1,8477.9%Service Call
- 1,6637.1%Good Intent Call
- 1,6497.0%Fire
- 330.1%Overpressure Rupture
- Fire incident types reported to NFIRS in Elmhurst, IL
- 70943.0%Structure Fires
- 52431.8%Outside Fires
- 36121.9%Mobile Property/Vehicle Fires
- 553.3%Other
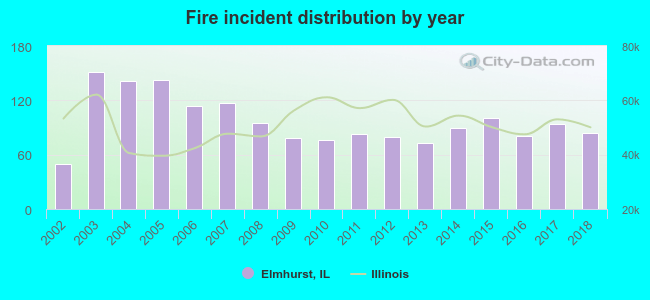 According to the data from the years 2002 - 2018 the average number of fire incidents per year is 97. The highest number of fire incidents - 151 took place in 2003, and the least - 50 in 2002. The data has a rising trend.
The average number of yearly fire incidents per 10k residents in Elmhurst, IL compared to nearest cities:
(Note: Based on data for the last 3 years, including only cities with population 5,000 and above)
| Elmhurst: | 18.9 |
| Berkeley: | 82.2 |
| Villa Park: | 40.8 |
| Hillside: | 67.1 |
| Northlake: | 33.7 |
| Bellwood: | 43.3 |
| Oak Brook: | 71.9 |
| Lombard: | 27.0 |
| Addison: | 33.4 |
 The median response time based on all reported fire incidents is 5 minutes. This is comparable to the state median value.
The median response time in Elmhurst, IL compared to nearest cities:
(Note: Based on data for all years, including only cities with at least 500 fire incidents)
| Elmhurst: | 5 minutes |
| Berkeley: | 4 minutes |
| Villa Park: | 4 minutes |
| Hillside: | 4 minutes |
| Northlake: | 5 minutes |
| Bellwood: | 3 minutes |
| Oak Brook: | 5 minutes |
| Lombard: | 5 minutes |
| Addison: | 5 minutes |
 Based on the reports from the years 2002 - 2018 the average number of fire-related casualties per year is 1. The highest number of reported casualties - 7 took place in 2006, and the lowest - 0 in 2003. The data has a dropping trend.
The average number of injuries per 1,000 fires is 11. This indicator was the highest - 61 in 2006, and the lowest 0 in 2003. The trend for casualties per 1,000 incidents is declining. Compared to the Illinois value the number of injuries per 1,000 fires is similar.
Based on the reports from the years 2002 - 2018 the average number of fire-related casualties per year is 1. The highest number of reported casualties - 7 took place in 2006, and the lowest - 0 in 2003. The data has a dropping trend.
The average number of injuries per 1,000 fires is 11. This indicator was the highest - 61 in 2006, and the lowest 0 in 2003. The trend for casualties per 1,000 incidents is declining. Compared to the Illinois value the number of injuries per 1,000 fires is similar.
 33.3% incidents where reported in the morning and 66.7% in the evening. The most fires (15.3%) took place on Saturday, and the least (11.6%) on Tuesday.
 Based on the 1,649 fires from years 2002 - 2018 most fires (10.4%) took place during August, and the least (5.1%) in February.
 Out of all 23,493 cases reported during the years 2002 - 2018, the most belonged to the categories: Rescue & EMS (43.0%), Hazardous Condition (17.5%), and False Alarm (17.2%).
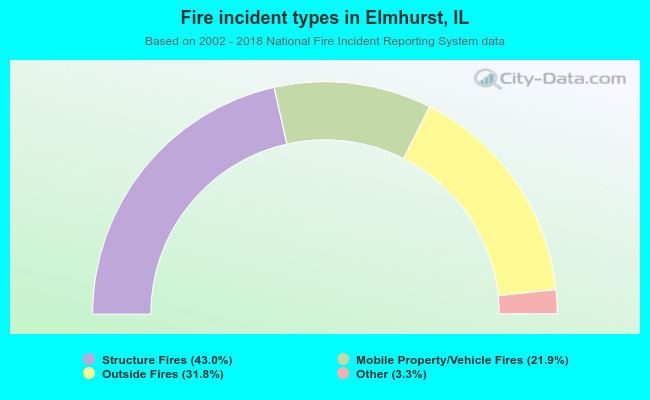 When looking into fire subcategories, the most reports belonged to: Structure Fires (43.0%), and Outside Fires (31.8%).