Hanford: Fire Incidents, California (CA)
Where are fire incidents reported in Hanford, CA
Something went wrong! Please refresh the page.
| Fire incidents reported | |
|---|---|
| Sreet name | Count |
| LACEY BLVD | 188 |
| 11TH AVE | 154 |
| 10TH AVE | 150 |
| 12TH AVE | 134 |
| GRANGEVILLE BLVD | 124 |
| HOUSTON AVE | 118 |
| HIGHWAY 198 | 106 |
| HANFORD ARMONA RD | 104 |
| HIGHWAY 43 | 82 |
| KANSAS AVE | 76 |
| 13TH AVE | 74 |
| 14TH AVE | 66 |
| EXCELSIOR AVE | 66 |
| 7TH AVE | 58 |
| 9TH AVE | 56 |
| IONA AVE | 56 |
| FLINT AVE | 54 |
| IDAHO AVE | 52 |
| SIXTH ST | 52 |
| 3RD PL | 48 |
| CAMPUS DR | 46 |
| 8TH AVE | 44 |
| 6TH AVE | 42 |
| SEVENTH ST | 40 |
| 16TH AVE | 38 |
| DOUTY ST | 36 |
| MYRTLE ST | 36 |
| FARGO AVE | 34 |
| KENT AVE | 34 |
| 10 AND ONE HALF AVE | 32 |
| Other | 224 |
2005 - 2018 National Fire Incident Reporting System (NFIRS) incidents
- Incident types reported to NFIRS in Hanford, CA
- 12,20053.8%Rescue & EMS
- 4,71920.8%Good Intent Call
- 2,42410.7%Fire
- 1,2365.5%Service Call
- 1,1605.1%Hazardous Condition
- 8223.6%False Alarm
- 910.4%Overpressure Rupture
- 260.1%Special Incident
- Fire incident types reported to NFIRS in Hanford, CA
- 1,27552.6%Outside Fires
- 57123.6%Structure Fires
- 48219.9%Mobile Property/Vehicle Fires
- 964.0%Other
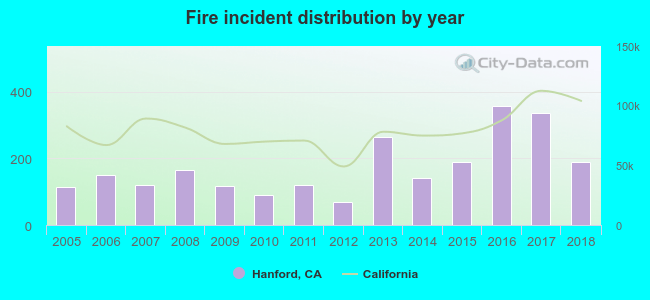 Based on the data from the years 2005 - 2018 the average number of fires per year is 173. The highest number of fires - 358 took place in 2016, and the least - 70 in 2012. The data has a growing trend.
The average number of yearly fire incidents per 10k residents in Hanford, CA compared to nearest cities:
(Note: Based on data for the last 3 years, including only cities with population 5,000 and above)
| Hanford: | 53.5 |
| Lemoore: | 32.6 |
| Kingsburg: | 79.8 |
| Selma: | 122.0 |
| Corcoran: | 23.5 |
| Visalia: | 41.3 |
| Tulare: | 50.4 |
| Parlier: | 45.4 |
| Fowler: | 80.0 |
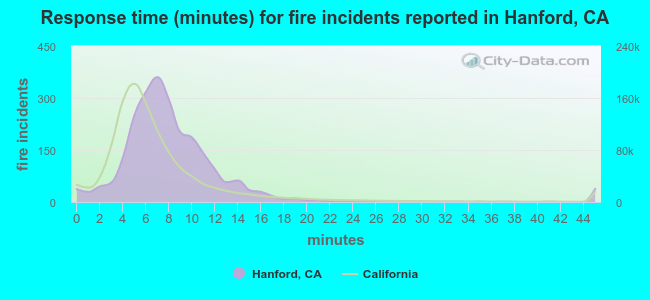 The median response time based on all reported fire incidents is 7 minutes. This is comparable to the state median value.
The median response time in Hanford, CA compared to nearest cities:
(Note: Based on data for all years, including only cities with at least 500 fire incidents)
| Hanford: | 7 minutes |
| Lemoore: | 7 minutes |
| Riverdale: | 14 minutes |
| Kingsburg: | 7 minutes |
| Selma: | 6 minutes |
| Corcoran: | 6 minutes |
| Caruthers: | 10 minutes |
| Visalia: | 6 minutes |
| Tulare: | 5 minutes |
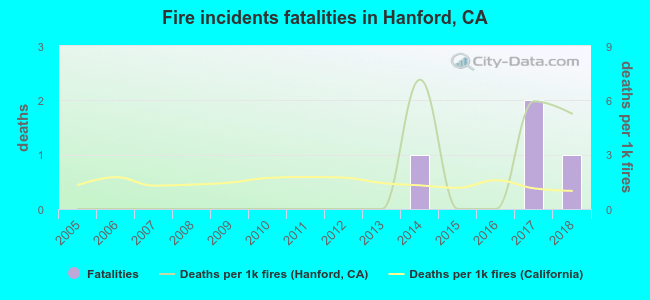 Based on the reports from the years 2005 - 2018 the average number of fire-related fatalities per year is 0. The highest number of deaths - 2 took place in 2017, and the lowest - 0 in 2005. The data has a growing trend.
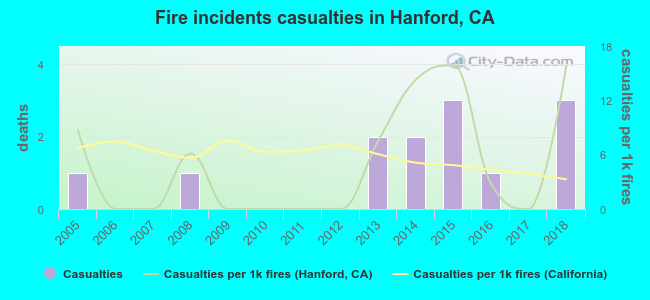 Based on the reports from the years 2005 - 2018 the average number of fire-related yearly casualties is 1. The highest number of injuries - 3 took place in 2015, and the lowest - 0 in 2006. The data has a rising trend.
The average number of injuries per 1,000 fires is 5. This indicator was the highest - 16 in 2015, and the lowest 0 in 2006. The trend for injuries per 1,000 fire incidents is rising. Compared to the state value the number of injuries per 1,000 fire incidents is similar.
Based on the reports from the years 2005 - 2018 the average number of fire-related yearly casualties is 1. The highest number of injuries - 3 took place in 2015, and the lowest - 0 in 2006. The data has a rising trend.
The average number of injuries per 1,000 fires is 5. This indicator was the highest - 16 in 2015, and the lowest 0 in 2006. The trend for injuries per 1,000 fire incidents is rising. Compared to the state value the number of injuries per 1,000 fire incidents is similar.
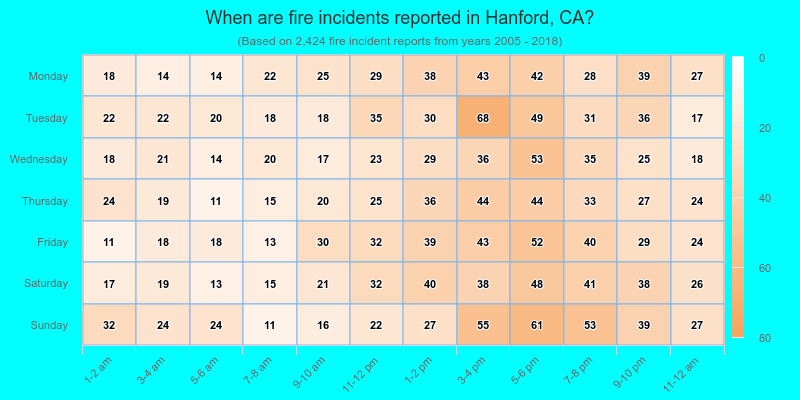
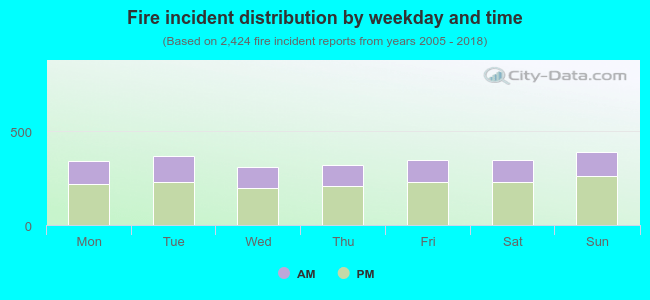 35.1% incidents where reported in the morning and 64.9% in the evening. The most fires (16.1%) took place on Sunday, and the least (12.7%) on Wednesday.
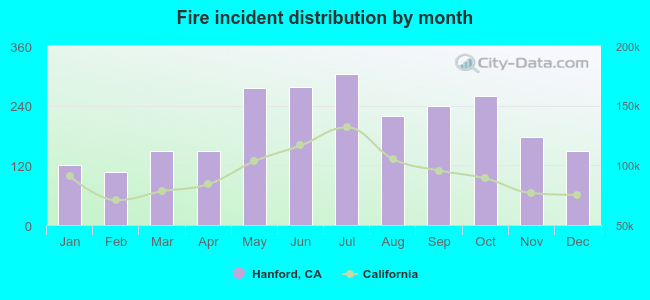 Based on the 2,424 fires from years 2005 - 2018 most fires (12.5%) took place during July, and the least (4.4%) in February.
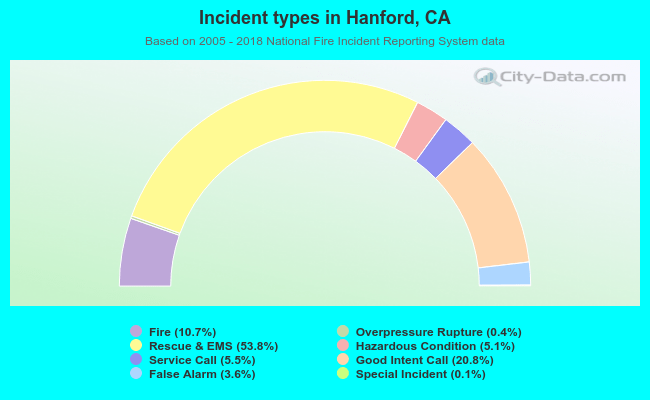 Out of all 22,678 cases reported during the years 2005 - 2018, the most belonged to the categories: Rescue & EMS (53.8%), Good Intent Call (20.8%), and Fire (10.7%).
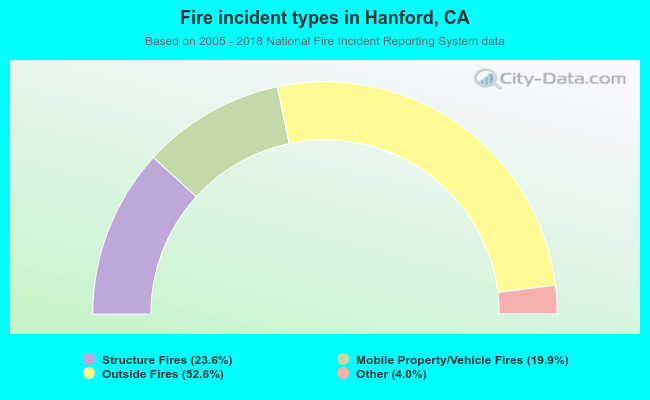 When looking into fire subcategories, the most reports belonged to: Outside Fires (52.6%), and Structure Fires (23.6%).