Corcoran: Fire Incidents, California (CA)
Where are fire incidents reported in Corcoran, CA
Something went wrong! Please refresh the page.
| Fire incidents reported | |
|---|---|
| Sreet name | Count |
| DAIRY AVE | 174 |
| WHITLEY AVE | 162 |
| LETTS AVE | 56 |
| ORANGE AVE | 56 |
| SHERMAN AVE | 56 |
| HIGHWAY 43 | 46 |
| 7TH AVE | 40 |
| NORTH AVE | 40 |
| PATTERSON AVE | 38 |
| 6TH AVE | 36 |
| OTIS AVE | 32 |
| BELL AVE | 30 |
| CHITTENDEN AVE | 30 |
| HANNA AVE | 30 |
| PICKERELL AVE | 28 |
| BAINUM AVE | 24 |
| GARVEY AVE | 24 |
| JEPSEN AVE | 24 |
| 10TH AVE | 22 |
| 5 AND ONE HALF AVE | 22 |
| OREGON AVE | 22 |
| HALL AVE | 20 |
| INDUSTRIAL AVE | 20 |
| BROKAW AVE | 18 |
| ESTES AVE | 18 |
| NEVADA AVE | 18 |
| VAN DORSTEN AVE | 18 |
| WIGDAL AVE | 18 |
| DORAN AVE | 16 |
| JAMES AVE | 16 |
2005 - 2018 National Fire Incident Reporting System (NFIRS) incidents
- Incident types reported to NFIRS in Corcoran, CA
- 3,23854.9%Rescue & EMS
- 99116.8%Fire
- 5779.8%Good Intent Call
- 4768.1%Service Call
- 4227.1%Hazardous Condition
- 1903.2%False Alarm
- 60.1%Overpressure Rupture
- Fire incident types reported to NFIRS in Corcoran, CA
- 52452.9%Outside Fires
- 26726.9%Structure Fires
- 16817.0%Mobile Property/Vehicle Fires
- 323.2%Other
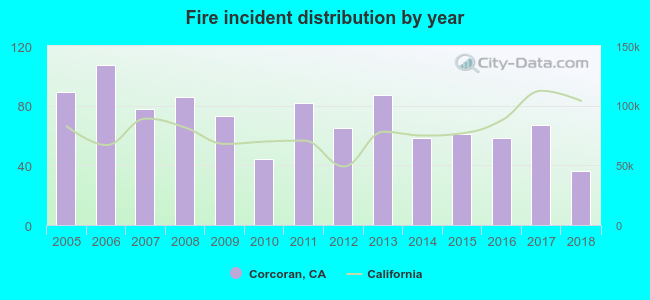 According to the data from the years 2005 - 2018 the average number of fires per year is 71. The highest number of fires - 107 took place in 2006, and the least - 36 in 2018. The data has a declining trend.
The average number of yearly fire incidents per 10k residents in Corcoran, CA compared to nearest cities:
(Note: Based on data for the last 3 years, including only cities with population 5,000 and above)
| Corcoran: | 23.5 |
| Tulare: | 50.4 |
| Hanford: | 53.5 |
| Lemoore: | 32.6 |
| Visalia: | 41.3 |
| Earlimart: | 91.4 |
| Farmersville: | 36.5 |
| Exeter: | 87.5 |
| Lindsay: | 35.6 |
 The median response time based on all reported fire incidents is 6 minutes. This is comparable to the California median value.
The median response time in Corcoran, CA compared to nearest cities:
(Note: Based on data for all years, including only cities with at least 500 fire incidents)
| Corcoran: | 6 minutes |
| Tulare: | 5 minutes |
| Hanford: | 7 minutes |
| Lemoore: | 7 minutes |
| Visalia: | 6 minutes |
| Earlimart: | 8 minutes |
| Farmersville: | 5 minutes |
| Exeter: | 7 minutes |
| Lindsay: | 8 minutes |
 Based on the reports from the years 2005 - 2018 the average number of fire-related yearly deaths is 0. The highest number of reported deaths - 2 took place in 2012, and the lowest - 0 in 2005. The data has a constant trend.
 According to the reports from the years 2005 - 2018 the average number of fire-related casualties per year is 1. The highest number of reported injuries - 3 took place in 2009, and the lowest - 0 in 2008. The data has a declining trend.
The average number of casualties per 1,000 fire incidents is 11. This indicator was the highest - 41 in 2009, and the lowest 0 in 2008. The trend for casualties per 1,000 fire incidents is declining. Compared to the state value the number of injuries per 1,000 incidents is much higher.
According to the reports from the years 2005 - 2018 the average number of fire-related casualties per year is 1. The highest number of reported injuries - 3 took place in 2009, and the lowest - 0 in 2008. The data has a declining trend.
The average number of casualties per 1,000 fire incidents is 11. This indicator was the highest - 41 in 2009, and the lowest 0 in 2008. The trend for casualties per 1,000 fire incidents is declining. Compared to the state value the number of injuries per 1,000 incidents is much higher.
 32.4% incidents where reported in the morning and 67.6% in the evening. The most fires (15.6%) took place on Monday, and the least (11.4%) on Wednesday.
 Based on the 991 fires from years 2005 - 2018 most fires (13.4%) took place during July, and the least (4.6%) in February.
 Out of all 5,903 cases reported during the years 2005 - 2018, the most belonged to the categories: Rescue & EMS (54.9%), Fire (16.8%), and Good Intent Call (9.8%).
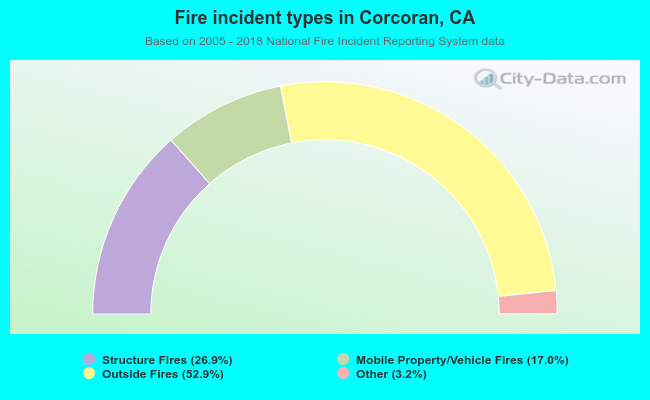 When looking into fire subcategories, the most incidents belonged to: Outside Fires (52.9%), and Structure Fires (26.9%).