Greenville: Fire Incidents, Ohio (OH)
Where are fire incidents reported in Greenville, OH
Something went wrong! Please refresh the page.
| Fire incidents reported | |
|---|---|
| Sreet name | Count |
| WAGNER AVE | 208 |
| JACKSON ST | 86 |
| FOURTH ST | 80 |
| SWEITZER ST | 80 |
| MARTIN ST | 62 |
| MAIN ST | 60 |
| CENTRAL AVE | 46 |
| WASHINGTON AVE | 44 |
| ARCANUM BEARS MILL RD | 42 |
| BROADWAY | 42 |
| GRAY AVE | 40 |
| HARRISON AVE | 38 |
| STATE ROUTE 121 | 38 |
| STATE ROUTE 571 | 36 |
| HOGPATH RD | 34 |
| CHILDRENS HOME BRADFORD RD | 32 |
| WAYNE AVE | 32 |
| THIRD ST | 30 |
| STATE ROUTE 49 | 28 |
| WATER ST | 28 |
| LAKE AVE | 26 |
| OHIO ST | 26 |
| RUSS RD | 26 |
| ST RT 49 | 26 |
| ST RT 571 | 26 |
| CHESTNUT ST | 24 |
| GREEN ST | 24 |
| OLIVER RD | 24 |
| ROUTZONG RD | 24 |
| SATER ST | 24 |
| Other | 866 |
2002 - 2018 National Fire Incident Reporting System (NFIRS) incidents
- Incident types reported to NFIRS in Greenville, OH
- 2,56135.4%Hazardous Condition
- 2,20230.4%Fire
- 1,03514.3%Rescue & EMS
- 5948.2%Good Intent Call
- 4366.0%Service Call
- 3214.4%False Alarm
- 600.8%Severe Weather
- 190.3%Special Incident
- 80.1%Overpressure Rupture
- Fire incident types reported to NFIRS in Greenville, OH
- 1,27257.8%Structure Fires
- 68531.1%Outside Fires
- 23910.9%Mobile Property/Vehicle Fires
- 60.3%Other
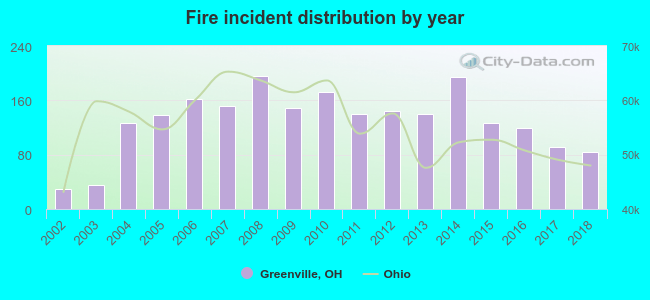 Based on the data from the years 2002 - 2018 the average number of fire incidents per year is 130. The highest number of reported fire incidents - 196 took place in 2008, and the least - 29 in 2002. The data has an increasing trend.
The average number of yearly fire incidents per 10k residents in Greenville, OH compared to nearest cities:
(Note: Based on data for the last 3 years, including only cities with population 5,000 and above)
| Greenville: | 75.4 |
| Piqua: | 52.7 |
| Brookville: | 101.8 |
| Union: | 18.8 |
| Troy: | 30.9 |
| Englewood: | 42.9 |
| Clayton: | 22.0 |
| Eaton: | 75.9 |
| Tipp City: | 55.5 |
 The median response time based on all reported fire incidents is 8 minutes. This is higher compared to the state median value.
The median response time in Greenville, OH compared to nearest cities:
(Note: Based on data for all years, including only cities with at least 500 fire incidents)
| Greenville: | 8 minutes |
| Ansonia: | 11 minutes |
| Arcanum: | 10 minutes |
| Union City: | 10 minutes |
| Lewisburg: | 8 minutes |
| Winchester: | 4 minutes |
| New Paris: | 12 minutes |
| Piqua: | 8 minutes |
| Brookville: | 7 minutes |
 According to the data from the years 2002 - 2018 the average number of fire-related casualties per year is 2. The highest number of reported casualties - 7 took place in 2007, and the lowest - 0 in 2002. The data has a growing trend.
The average number of injuries per 1,000 fire incidents is 12. This indicator was the highest - 46 in 2007, and the lowest 0 in 2002. The trend for casualties per 1,000 fire incidents is rising. Compared to the state value the number of injuries per 1,000 fires is similar.
According to the data from the years 2002 - 2018 the average number of fire-related casualties per year is 2. The highest number of reported casualties - 7 took place in 2007, and the lowest - 0 in 2002. The data has a growing trend.
The average number of injuries per 1,000 fire incidents is 12. This indicator was the highest - 46 in 2007, and the lowest 0 in 2002. The trend for casualties per 1,000 fire incidents is rising. Compared to the state value the number of injuries per 1,000 fires is similar.Casualties per 1,000 incidents in Greenville, OH compared to nearest cities:
(Note: Based on data for all years, including only cities with at least 500 fire incidents)
| Greenville: | 12.7 |
| Ansonia: | 5.8 |
| Arcanum: | 4.8 |
| Union City: | 8.6 |
| Lewisburg: | 2.9 |
| Winchester: | 12.3 |
| New Paris: | 1.8 |
| Piqua: | 12.0 |
| Brookville: | 5.1 |
 32.7% incidents where reported in the morning and 67.3% in the evening. The most fires (14.9%) took place on Monday, and the least (12.8%) on Thursday.
 Based on the 2,202 fire incident reports from years 2002 - 2018 most fires (10.9%) took place during October, and the least (5.9%) in August.
 Out of all 7,236 cases reported during the years 2002 - 2018, the most belonged to the categories: Hazardous Condition (35.4%), Fire (30.4%), and Rescue & EMS (14.3%).
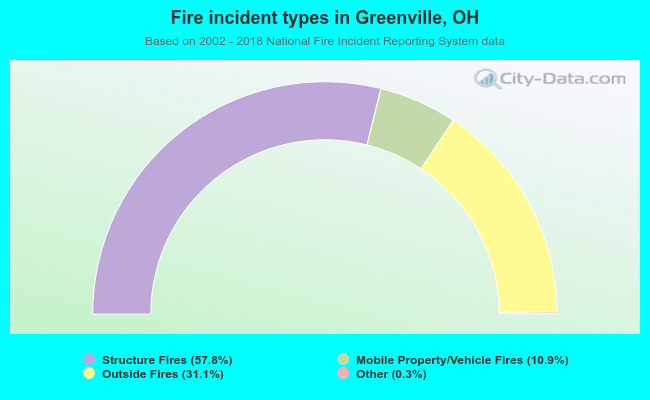 When looking into fire subcategories, the most reports belonged to: Structure Fires (57.8%), and Outside Fires (31.1%).