Eaton: Fire Incidents, Ohio (OH)
Where are fire incidents reported in Eaton, OH
Something went wrong! Please refresh the page.
| Fire incidents reported | |
|---|---|
| Sreet name | Count |
| BARRON ST | 168 |
| RICHMOND PIKE | 64 |
| MAPLE ST | 56 |
| MAIN ST | 52 |
| EATON LEWISBURG RD | 42 |
| SOMERS ST | 40 |
| CONCORD RD | 38 |
| LAKENGREN DR | 38 |
| DECATUR ST | 34 |
| HIGH ST | 32 |
| AUKERMAN ST | 30 |
| PARK AVE | 30 |
| BEECH ST | 28 |
| EAST AVE | 28 |
| 127 | 26 |
| PAINT CREEK RD | 26 |
| WINNERLINE RD | 24 |
| CHERRY ST | 22 |
| FRANKLIN ST | 22 |
| US RT 127 | 22 |
| WASHINGTON JACKSON RD | 22 |
| 122 RT | 20 |
| CONSOLIDATED RD | 20 |
| I 70 | 20 |
| LEXINGTON RD | 20 |
| SKODBORG DR | 20 |
| 127 RT | 18 |
| HILLCREST DR | 18 |
| MANN RD | 18 |
| STATE ROUTE 732 | 18 |
| Other | 169 |
2002 - 2018 National Fire Incident Reporting System (NFIRS) incidents
- Incident types reported to NFIRS in Eaton, OH
- 10,00169.4%Rescue & EMS
- 1,50810.5%Hazardous Condition
- 1,1858.2%Fire
- 6504.5%Service Call
- 5043.5%False Alarm
- 4613.2%Good Intent Call
- 490.3%Special Incident
- 320.2%Severe Weather
- 170.1%Overpressure Rupture
- Fire incident types reported to NFIRS in Eaton, OH
- 52844.6%Structure Fires
- 42535.9%Outside Fires
- 21618.2%Mobile Property/Vehicle Fires
- 161.4%Other
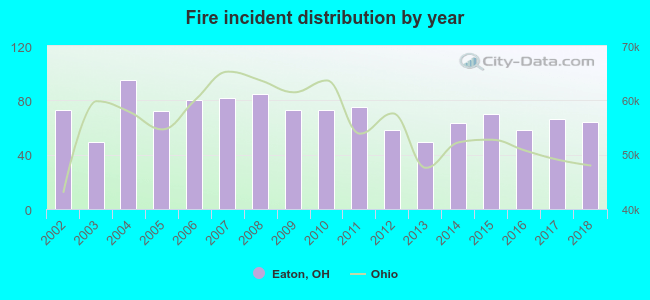 According to the data from the years 2002 - 2018 the average number of fires per year is 70. The highest number of fires - 95 took place in 2004, and the least - 49 in 2003. The data has a dropping trend.
The average number of yearly fire incidents per 10k residents in Eaton, OH compared to nearest cities:
(Note: Based on data for the last 3 years, including only cities with population 5,000 and above)
| Eaton: | 75.9 |
| Brookville: | 101.8 |
| Germantown: | 65.4 |
| Oxford: | 50.0 |
| Trotwood: | 55.3 |
| Clayton: | 22.0 |
| Englewood: | 42.9 |
| Union: | 18.8 |
| Carlisle: | 41.7 |
 The median response time based on all reported fire incidents is 7 minutes. This is about the same as the state median value.
The median response time in Eaton, OH compared to nearest cities:
(Note: Based on data for all years, including only cities with at least 500 fire incidents)
| Eaton: | 7 minutes |
| Camden: | 10 minutes |
| Lewisburg: | 8 minutes |
| New Paris: | 12 minutes |
| New Lebanon: | 7 minutes |
| Brookville: | 7 minutes |
| Richmond: | 4 minutes |
| Germantown: | 7 minutes |
| Arcanum: | 10 minutes |
 According to the data from the years 2002 - 2018 the average number of fire-related yearly casualties is 1. The highest number of reported injuries - 6 took place in 2006, and the lowest - 0 in 2002. The data has a constant trend.
The average number of injuries per 1,000 fire incidents is 12. This indicator was the highest - 75 in 2006, and the lowest 0 in 2002. The trend for injuries per 1,000 incidents is constant. Compared to the state value the number of injuries per 1,000 incidents is about the same.
According to the data from the years 2002 - 2018 the average number of fire-related yearly casualties is 1. The highest number of reported injuries - 6 took place in 2006, and the lowest - 0 in 2002. The data has a constant trend.
The average number of injuries per 1,000 fire incidents is 12. This indicator was the highest - 75 in 2006, and the lowest 0 in 2002. The trend for injuries per 1,000 incidents is constant. Compared to the state value the number of injuries per 1,000 incidents is about the same.Casualties per 1,000 incidents in Eaton, OH compared to nearest cities:
(Note: Based on data for all years, including only cities with at least 500 fire incidents)
| Eaton: | 12.7 |
| Camden: | 8.3 |
| Lewisburg: | 2.9 |
| New Paris: | 1.8 |
| New Lebanon: | 12.0 |
| Brookville: | 5.1 |
| Richmond: | 12.1 |
| Germantown: | 28.0 |
| Arcanum: | 4.8 |
 31.1% incidents where reported in the morning and 68.9% in the evening. The most fires (15.9%) took place on Thursday, and the least (12.7%) on Saturday.
 According to the 1,185 fire incident reports from years 2002 - 2018 most fires (11.0%) took place during October, and the least (5.7%) in December.
 Out of all 14,407 cases reported during the years 2002 - 2018, the most belonged to the categories: Rescue & EMS (69.4%), Hazardous Condition (10.5%), and Fire (8.2%).
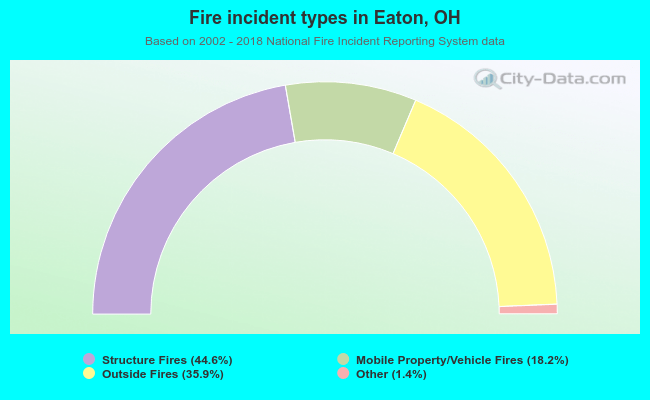 When looking into fire subcategories, the most incidents belonged to: Structure Fires (44.6%), and Outside Fires (35.9%).