Corona: Fire Incidents, California (CA)
Where are fire incidents reported in Corona, CA
Something went wrong! Please refresh the page.
| Fire incidents reported | |
|---|---|
| Sreet name | Count |
| SIXTH ST | 110 |
| MAIN ST | 72 |
| EB | 68 |
| WB | 68 |
| GREEN RIVER RD | 56 |
| SB | 56 |
| RIVER RD | 42 |
| MCKINLEY ST | 38 |
| EB FWY | 36 |
| NB | 36 |
| CAJALCO RD | 32 |
| MAGNOLIA AV | 32 |
| RINCON ST | 28 |
| MAGNOLIA AVE | 26 |
| TEMESCAL CANYON RD | 26 |
| BAYWOOD DR | 22 |
| FIFTH ST | 22 |
| WB FWY | 22 |
| CIRCLE CITY DR | 20 |
| NB FWY | 20 |
| SB FWY | 20 |
| SIXTH | 20 |
| EIGHTH ST | 18 |
| THIRD ST | 18 |
| LINCOLN | 16 |
| RIMPAU AV | 16 |
| RIMPAU AVE | 16 |
| AVENIDA DEL VISTA | 14 |
| GOLDEN RIDGE | 14 |
| LINCOLN AVE | 14 |
| Other | 521 |
2005 - 2018 National Fire Incident Reporting System (NFIRS) incidents
- Incident types reported to NFIRS in Corona, CA
- 13,40368.0%Rescue & EMS
- 2,19611.1%Good Intent Call
- 1,5197.7%Fire
- 1,2966.6%Service Call
- 7123.6%Hazardous Condition
- 5572.8%False Alarm
- Fire incident types reported to NFIRS in Corona, CA
- 65242.9%Outside Fires
- 44029.0%Structure Fires
- 38425.3%Mobile Property/Vehicle Fires
- 432.8%Other
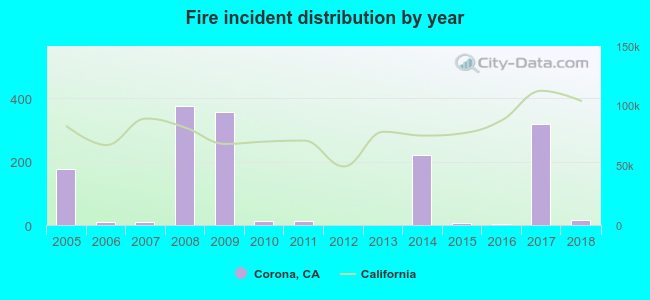 According to the data from the years 2005 - 2018 the average number of fires per year is 109. The highest number of fires - 376 took place in 2008, and the least - 1 in 2012. The data has a declining trend.
The average number of yearly fire incidents per 10k residents in Corona, CA compared to nearest cities:
(Note: Based on data for the last 3 years, including only cities with population 5,000 and above)
| Corona: | 7.0 |
| Home Gardens: | 0.9 |
| Norco: | 1.0 |
| Eastvale: | 0.2 |
| Temescal Valley: | 0.9 |
| Jurupa: | 0.1 |
| Riverside: | 29.1 |
| Chino Hills: | 5.7 |
| Woodcrest: | 1.0 |
 The median response time based on all reported fire incidents is 6 minutes. This is comparable to the California median value.
The median response time in Corona, CA compared to nearest cities:
(Note: Based on data for all years, including only cities with at least 500 fire incidents)
| Corona: | 6 minutes |
| Riverside: | 6 minutes |
| Chino: | 6 minutes |
| Yorba Linda: | 7 minutes |
| Ontario: | 6 minutes |
| Montclair: | 6 minutes |
| Orange: | 5 minutes |
| Placentia: | 5 minutes |
| Tustin: | 6 minutes |
 Based on the reports from the years 2005 - 2018 the average number of fire-related yearly casualties is 2. The highest number of reported injuries - 11 took place in 2008, and the lowest - 0 in 2006. The data has a declining trend.
The average number of casualties per 1,000 fires is 5. This indicator was the highest - 29 in 2008, and the lowest 0 in 2006. The trend for injuries per 1,000 fire incidents is decreasing. Compared to the state value the number of casualties per 1,000 fires is much higher.
Based on the reports from the years 2005 - 2018 the average number of fire-related yearly casualties is 2. The highest number of reported injuries - 11 took place in 2008, and the lowest - 0 in 2006. The data has a declining trend.
The average number of casualties per 1,000 fires is 5. This indicator was the highest - 29 in 2008, and the lowest 0 in 2006. The trend for injuries per 1,000 fire incidents is decreasing. Compared to the state value the number of casualties per 1,000 fires is much higher.
 32.5% incidents where reported in the morning and 67.5% in the evening. The most fires (15.6%) took place on Monday, and the least (12.3%) on Friday.
 Based on the 1,519 fire incident reports from years 2005 - 2018 most fires (12.2%) took place during May, and the least (4.7%) in December.
 Out of all 19,714 cases reported during the years 2005 - 2018, the most belonged to the categories: Rescue & EMS (68.0%), Good Intent Call (11.1%), and Fire (7.7%).
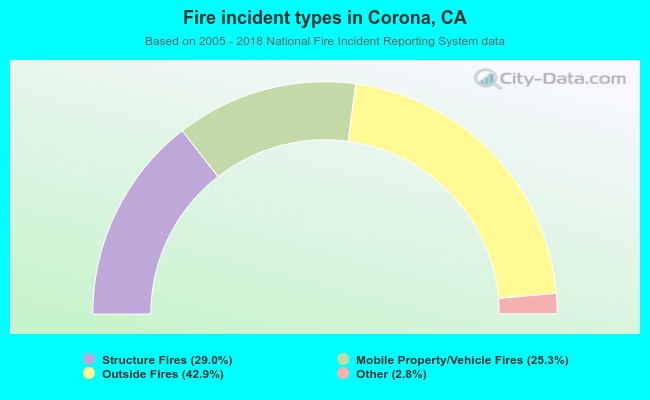 When looking into fire subcategories, the most incidents belonged to: Outside Fires (42.9%), and Structure Fires (29.0%).