Bridge City: Fire Incidents, Texas (TX)
Where are fire incidents reported in Bridge City, TX
Something went wrong! Please refresh the page.
| Fire incidents reported | |
|---|---|
| Sreet name | Count |
| TEXAS AVENUE | 168 |
| HIGHWAY 62 | 88 |
| HIGHWAY 105 | 58 |
| HIGHWAY 87 | 48 |
| JONES | 48 |
| E. ROUNDBUNCH | 36 |
| WOODCOCK | 36 |
| W. ROUNDBUNCH | 34 |
| BOWER | 32 |
| HIGHWAY 408 | 32 |
| CARIBOU | 30 |
| BLUEBERRY | 28 |
| PATILLO | 28 |
| HIGHWAY 1442 | 26 |
| BESSIE HEIGHTS ROAD | 22 |
| OILLA ROAD | 22 |
| WISE | 22 |
| CACTUS | 20 |
| DUGAS | 20 |
| GRANGER ROAD | 20 |
| LAKE STREET | 20 |
| RACHAL | 20 |
| W ROUNDBUNCH | 20 |
| CARLENE | 18 |
| ELK | 18 |
| GARRISON | 18 |
| GUM | 18 |
| W. DARBY | 18 |
| CLAIR | 16 |
| LIVE OAK | 16 |
| Other | 741 |
2002 - 2018 National Fire Incident Reporting System (NFIRS) incidents
- Incident types reported to NFIRS in Bridge City, TX
- 3,87246.7%Rescue & EMS
- 1,74121.0%Fire
- 1,07913.0%Hazardous Condition
- 7629.2%Good Intent Call
- 6087.3%Service Call
- 2172.6%False Alarm
- Fire incident types reported to NFIRS in Bridge City, TX
- 1,10063.2%Outside Fires
- 36821.1%Structure Fires
- 19811.4%Mobile Property/Vehicle Fires
- 754.3%Other
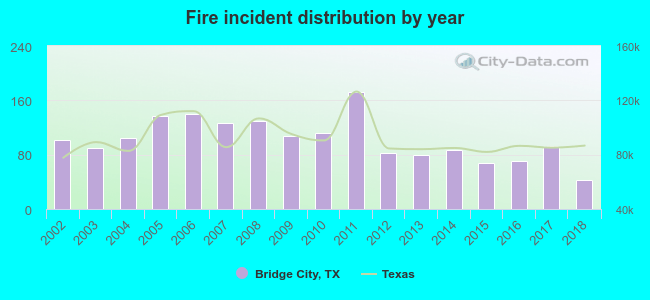 According to the data from the years 2002 - 2018 the average number of fire incidents per year is 102. The highest number of fire incidents - 173 took place in 2011, and the least - 43 in 2018. The data has a declining trend.
The average number of yearly fire incidents per 10k residents in Bridge City, TX compared to nearest cities:
(Note: Based on data for the last 3 years, including only cities with population 5,000 and above)
| Bridge City: | 86.7 |
| Orange: | 82.5 |
| Groves: | 63.1 |
| Port Neches: | 43.6 |
| Nederland: | 62.2 |
| Vidor: | 261.3 |
| Port Arthur: | 65.2 |
| Beaumont: | 45.4 |
| Lumberton: | 3.5 |
 The median response time based on all reported fire incidents is 8 minutes. This is higher compared to the state median value.
The median response time in Bridge City, TX compared to nearest cities:
(Note: Based on data for all years, including only cities with at least 500 fire incidents)
| Bridge City: | 8 minutes |
| Orange: | 5 minutes |
| Groves: | 4 minutes |
| Port Neches: | 5 minutes |
| Nederland: | 5 minutes |
| Vidor: | 7 minutes |
| Port Arthur: | 4 minutes |
| Beaumont: | 4 minutes |
| Vinton: | 7 minutes |
 23.2% incidents where reported in the morning and 76.8% in the evening. The most fires (16.5%) took place on Sunday, and the least (12.3%) on Friday.
 Based on the 1,741 fire incidents from years 2002 - 2018 most fires (12.1%) took place during October, and the least (6.7%) in November.
 Out of all 8,295 cases reported during the years 2002 - 2018, the most belonged to the categories: Rescue & EMS (46.7%), Fire (21.0%), and Hazardous Condition (13.0%).
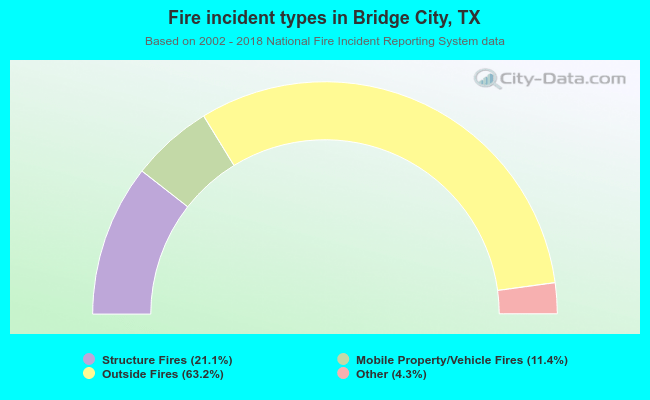 When looking into fire subcategories, the most reports belonged to: Outside Fires (63.2%), and Structure Fires (21.1%).