Beaumont: Fire Incidents, Texas (TX)
Where are fire incidents reported in Beaumont, TX
Something went wrong! Please refresh the page.
| Fire incidents reported | |
|---|---|
| Sreet name | Count |
| IH 10 | 372 |
| EASTEX FWY | 282 |
| COLLEGE ST | 252 |
| COLLEGE | 230 |
| EASTEX FRWY | 226 |
| MAJOR DR | 204 |
| WASHINGTON BLVD | 168 |
| DOWLEN RD | 164 |
| 11TH ST | 162 |
| I10 S | 162 |
| CARDINAL DR | 140 |
| MAGNOLIA AVE | 138 |
| MLK PKWY S | 124 |
| CONCORD RD | 120 |
| EASTEX | 118 |
| CALDER AVE | 116 |
| DOWLEN RD | 116 |
| PHELAN BLVD | 112 |
| PINE ST | 108 |
| LUCAS DR | 104 |
| CARDINAL DR W | 102 |
| MAGNOLIA | 100 |
| MARTIN LUTHER KING PKWY | 96 |
| INTERSTATE 10 | 94 |
| WASHINGTON BLVD | 92 |
| CROW RD | 86 |
| FANNETT RD | 86 |
| I10 N | 86 |
| FANNETT RD | 84 |
| CALDER | 82 |
| Other | 5,150 |
2002 - 2018 National Fire Incident Reporting System (NFIRS) incidents
- Incident types reported to NFIRS in Beaumont, TX
- 55,50947.3%Rescue & EMS
- 16,82514.3%Hazardous Condition
- 15,66213.3%False Alarm
- 11,99210.2%Service Call
- 9,4768.1%Fire
- 7,5966.5%Good Intent Call
- 1800.2%Special Incident
- Fire incident types reported to NFIRS in Beaumont, TX
- 3,98642.1%Structure Fires
- 3,13133.0%Outside Fires
- 2,15322.7%Mobile Property/Vehicle Fires
- 2062.2%Other
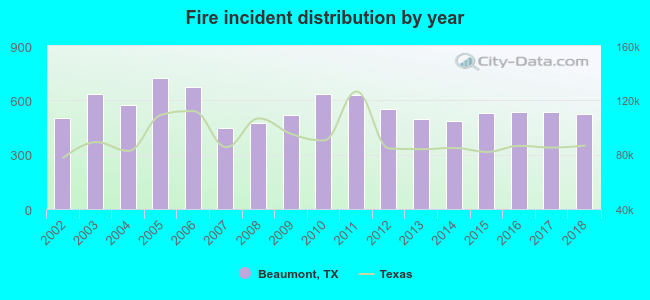 Based on the data from the years 2002 - 2018 the average number of fires per year is 557. The highest number of reported fires - 723 took place in 2005, and the least - 447 in 2007. The data has a rising trend.
The average number of yearly fire incidents per 10k residents in Beaumont, TX compared to nearest cities:
(Note: Based on data for the last 3 years, including only cities with population 5,000 and above)
| Beaumont: | 45.4 |
| Vidor: | 261.3 |
| Nederland: | 62.2 |
| Port Neches: | 43.6 |
| Lumberton: | 3.5 |
| Groves: | 63.1 |
| Bridge City: | 86.7 |
| Port Arthur: | 65.2 |
| Silsbee: | 174.8 |
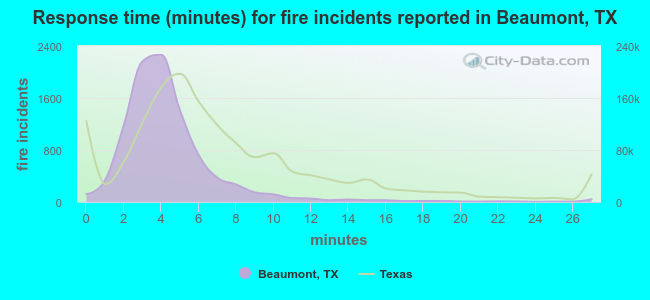 The median response time based on all reported fire incidents is 4 minutes. This is lower compared to the state median value.
The median response time in Beaumont, TX compared to nearest cities:
(Note: Based on data for all years, including only cities with at least 500 fire incidents)
| Beaumont: | 4 minutes |
| Vidor: | 7 minutes |
| Nederland: | 5 minutes |
| Port Neches: | 5 minutes |
| Lumberton: | 8 minutes |
| Groves: | 4 minutes |
| Bridge City: | 8 minutes |
| Port Arthur: | 4 minutes |
| Silsbee: | 5 minutes |
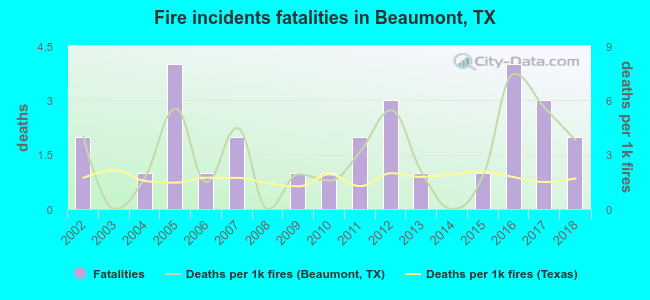 According to the data from the years 2002 - 2018 the average number of fire-related fatalities per year is 2. The highest number of deaths - 4 took place in 2005, and the lowest - 0 in 2003. The data has a constant trend.
The average number of deaths per 1,000 fire incidents is 3. This indicator was the highest - 7 in 2016, and the lowest 0 in 2003. The trend for fatalities per 1,000 incidents is dropping. Compared to the Texas value the number of fatalities per 1,000 fire incidents is higher.
According to the data from the years 2002 - 2018 the average number of fire-related fatalities per year is 2. The highest number of deaths - 4 took place in 2005, and the lowest - 0 in 2003. The data has a constant trend.
The average number of deaths per 1,000 fire incidents is 3. This indicator was the highest - 7 in 2016, and the lowest 0 in 2003. The trend for fatalities per 1,000 incidents is dropping. Compared to the Texas value the number of fatalities per 1,000 fire incidents is higher.Deaths per 1,000 incidents in Beaumont, TX compared to nearest cities:
(Note: Based on data for all years, including only cities with at least 2,500 fire incidents)
| Beaumont: | 3.0 |
| Vidor: | 2.6 |
| Port Arthur: | 1.5 |
| Orange: | 2.6 |
| Baytown: | 2.5 |
| Crosby: | 2.0 |
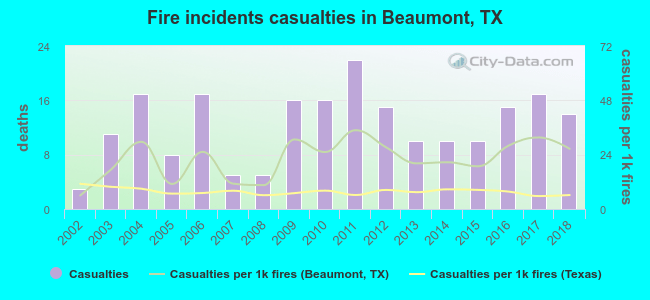 According to the data from the years 2002 - 2018 the average number of fire-related yearly casualties is 12. The highest number of reported injuries - 22 took place in 2011, and the lowest - 3 in 2002. The data has an increasing trend.
The average number of casualties per 1,000 fires is 22. This indicator was the highest - 35 in 2011, and the lowest 6 in 2002. The trend for casualties per 1,000 incidents is rising. Compared to the state value the number of casualties per 1,000 incidents is much higher.
According to the data from the years 2002 - 2018 the average number of fire-related yearly casualties is 12. The highest number of reported injuries - 22 took place in 2011, and the lowest - 3 in 2002. The data has an increasing trend.
The average number of casualties per 1,000 fires is 22. This indicator was the highest - 35 in 2011, and the lowest 6 in 2002. The trend for casualties per 1,000 incidents is rising. Compared to the state value the number of casualties per 1,000 incidents is much higher.Casualties per 1,000 incidents in Beaumont, TX compared to nearest cities:
(Note: Based on data for all years, including only cities with at least 500 fire incidents)
| Beaumont: | 22.3 |
| Vidor: | 4.2 |
| Nederland: | 11.5 |
| Port Neches: | 10.4 |
| Lumberton: | 1.5 |
| Groves: | 8.5 |
| Bridge City: | 0.6 |
| Port Arthur: | 5.5 |
| Silsbee: | 1.4 |
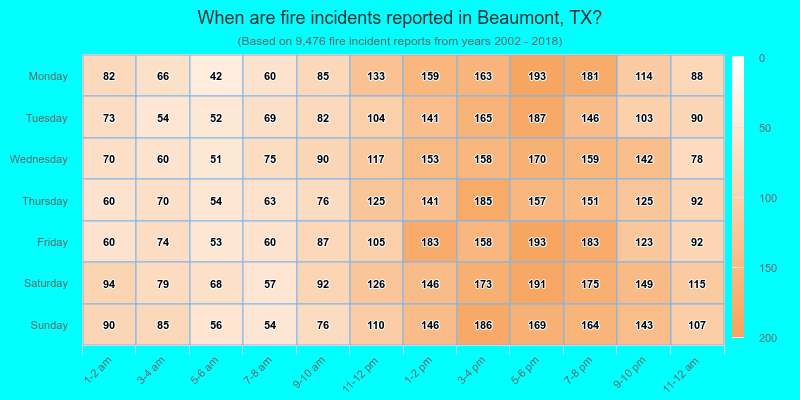
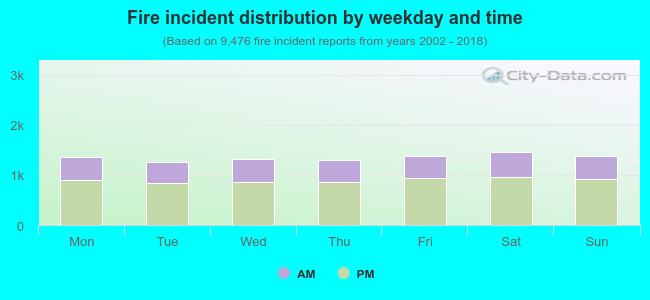 34.2% incidents where reported in the morning and 65.8% in the evening. The most fires (15.5%) took place on Saturday, and the least (13.4%) on Tuesday.
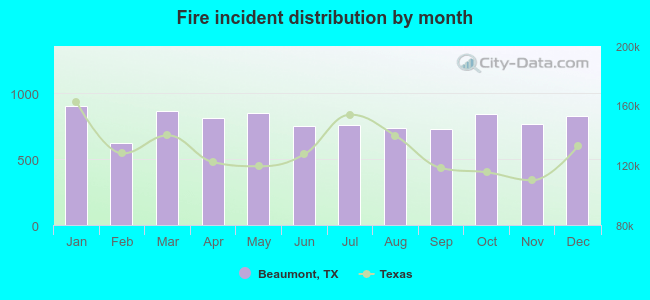 Based on the 9,476 fires from years 2002 - 2018 most fires (9.6%) took place during January, and the least (6.6%) in February.
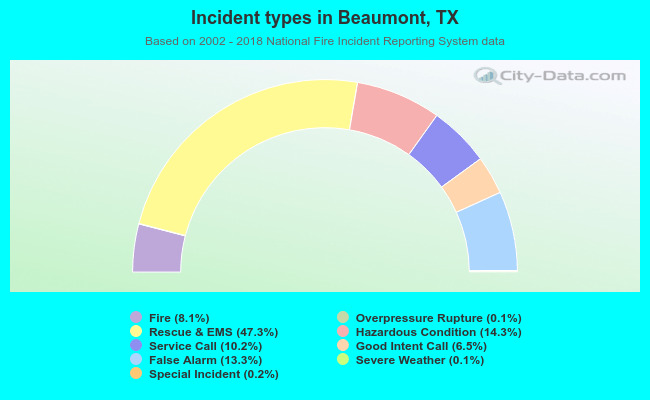 Out of all 117,417 cases reported during the years 2002 - 2018, the most belonged to the categories: Rescue & EMS (47.3%), Hazardous Condition (14.3%), and False Alarm (13.3%).
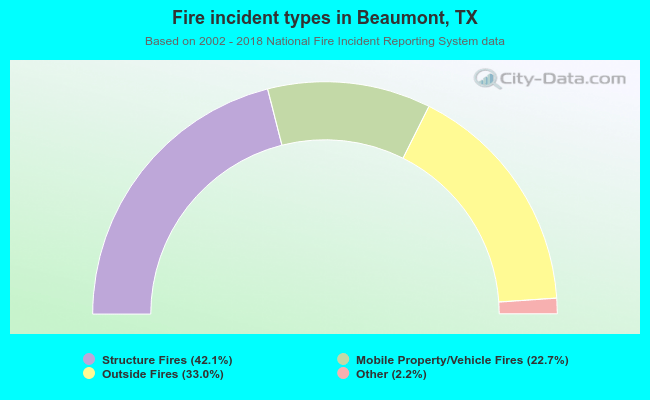 When looking into fire subcategories, the most reports belonged to: Structure Fires (42.1%), and Outside Fires (33.0%).