Aurora: Fire Incidents, Ohio (OH)
Where are fire incidents reported in Aurora, OH
Something went wrong! Please refresh the page.
| Fire incidents reported | |
|---|---|
| Sreet name | Count |
| CHILLICOTHE RD | 142 |
| BARRINGTON TOWN SQUARE DR | 64 |
| GARFIELD RD | 60 |
| EAST BLVD | 52 |
| AURORA (460-) RD | 42 |
| MARKET PLACE DRIVE | 32 |
| MONETA AVE | 30 |
| LLOYD AVE | 28 |
| ORCHARD AVE | 28 |
| BISSELL RD | 26 |
| PIONEER TR | 24 |
| MENNONITE RD | 22 |
| AURORA HUDSON RD | 20 |
| AURORA460 RD | 20 |
| ROBINHOOD DR | 20 |
| BRYCE AVE | 18 |
| PARKER RD | 18 |
| AURORA ROAD | 16 |
| AURORA RD | 14 |
| CHATHAM DR | 14 |
| CRACKEL RD | 14 |
| PAGE RD | 14 |
| SHERWOOD DR | 14 |
| SYCAMORE DR | 14 |
| AURORA (13-395) RD | 12 |
| AURORA LAKE RD | 12 |
| HAMPTON CIR | 12 |
| LENA DR | 12 |
| MANCHESTER | 12 |
| SUSSEX CT | 12 |
2002 - 2018 National Fire Incident Reporting System (NFIRS) incidents
- Incident types reported to NFIRS in Aurora, OH
- 1,58130.2%Rescue & EMS
- 1,00019.1%False Alarm
- 91617.5%Hazardous Condition
- 79715.2%Fire
- 54910.5%Service Call
- 3336.4%Good Intent Call
- 250.5%Severe Weather
- 200.4%Overpressure Rupture
- 180.3%Special Incident
- Fire incident types reported to NFIRS in Aurora, OH
- 40851.2%Structure Fires
- 30538.3%Outside Fires
- 779.7%Mobile Property/Vehicle Fires
- 70.9%Other
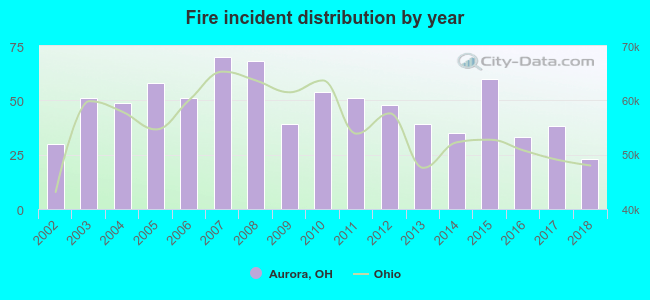 Based on the data from the years 2002 - 2018 the average number of fire incidents per year is 47. The highest number of reported fire incidents - 70 took place in 2007, and the least - 23 in 2018. The data has a declining trend.
The average number of yearly fire incidents per 10k residents in Aurora, OH compared to nearest cities:
(Note: Based on data for the last 3 years, including only cities with population 5,000 and above)
| Aurora: | 19.9 |
| Twinsburg: | 40.7 |
| Streetsboro: | 35.3 |
| Solon: | 38.6 |
| Hudson: | 12.2 |
| Macedonia: | 29.9 |
| Bedford Heights: | 28.7 |
| Bedford: | 51.5 |
| Stow: | 18.6 |
 The median response time based on all reported fire incidents is 5 minutes. This is lower than the Ohio median value.
The median response time in Aurora, OH compared to nearest cities:
(Note: Based on data for all years, including only cities with at least 500 fire incidents)
| Aurora: | 5 minutes |
| Twinsburg: | 5 minutes |
| Streetsboro: | 6 minutes |
| Bainbridge: | 15 minutes |
| Solon: | 6 minutes |
| Hudson: | 6 minutes |
| Mantua: | 9 minutes |
| Macedonia: | 5 minutes |
| Bedford: | 4 minutes |
 Based on the data from the years 2002 - 2018 the average number of fire-related casualties per year is 2. The highest number of reported injuries - 7 took place in 2002, and the lowest - 0 in 2004. The data has a dropping trend.
The average number of casualties per 1,000 fires is 42. This indicator was the highest - 233 in 2002, and the lowest 0 in 2004. The trend for casualties per 1,000 fire incidents is decreasing. Compared to the Ohio value the number of casualties per 1,000 fires is much higher.
Based on the data from the years 2002 - 2018 the average number of fire-related casualties per year is 2. The highest number of reported injuries - 7 took place in 2002, and the lowest - 0 in 2004. The data has a dropping trend.
The average number of casualties per 1,000 fires is 42. This indicator was the highest - 233 in 2002, and the lowest 0 in 2004. The trend for casualties per 1,000 fire incidents is decreasing. Compared to the Ohio value the number of casualties per 1,000 fires is much higher.Casualties per 1,000 incidents in Aurora, OH compared to nearest cities:
(Note: Based on data for all years, including only cities with at least 500 fire incidents)
| Aurora: | 37.6 |
| Twinsburg: | 17.0 |
| Streetsboro: | 10.4 |
| Bainbridge: | 2.3 |
| Solon: | 12.9 |
| Hudson: | 1.6 |
| Mantua: | 17.9 |
| Macedonia: | 2.9 |
| Bedford: | 17.1 |
 31.5% incidents where reported in the morning and 68.5% in the evening. The most fires (17.3%) took place on Sunday, and the least (12.3%) on Thursday.
 Based on the 797 fire incidents from years 2002 - 2018 most fires (11.8%) took place during July, and the least (5.9%) in January.
 Out of all 5,239 cases reported during the years 2002 - 2018, the most belonged to the categories: Rescue & EMS (30.2%), False Alarm (19.1%), and Hazardous Condition (17.5%).
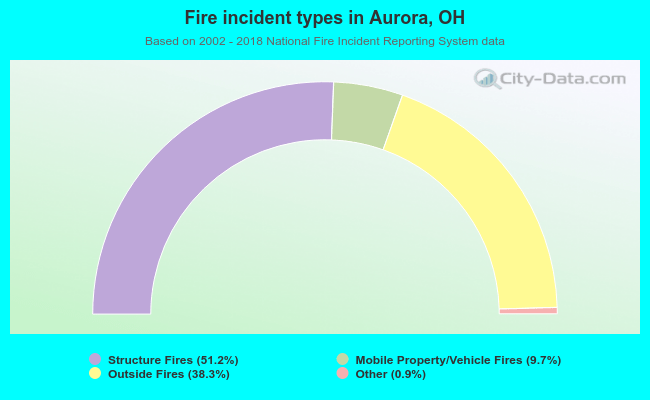 When looking into fire subcategories, the most incidents belonged to: Structure Fires (51.2%), and Outside Fires (38.3%).