Stow: Fire Incidents, Ohio (OH)
Where are fire incidents reported in Stow, OH
Something went wrong! Please refresh the page.
| Fire incidents reported | |
|---|---|
| Sreet name | Count |
| KENT RD | 76 |
| GRAHAM | 62 |
| GRAHAM RD | 54 |
| KENT | 54 |
| STATE ROUTE 8 | 46 |
| DARROW RD | 42 |
| DARROW | 38 |
| FISHCREEK RD | 34 |
| HUDSON | 32 |
| HUDSON DR | 32 |
| FISHCREEK | 30 |
| STEELS POINTE | 28 |
| MAPLEPARK RD | 22 |
| STEELS CORNERS RD | 22 |
| STOW RD | 22 |
| NORTON RD | 20 |
| BRIDGEWATER | 18 |
| UNIONDALE DR | 18 |
| RITCHIE RD | 16 |
| YOUNG RD | 16 |
| MARSH RD | 14 |
| BENT TREE LN | 12 |
| CROWN POINTE DR | 12 |
| ECHO VALLEY DR | 12 |
| MCTAGGART RD | 12 |
| NORMAN DR | 12 |
| STEELS CORNERS | 12 |
| COX DR | 10 |
| ENGLEWOOD DR | 10 |
| LILLIAN RD | 10 |
2005 - 2018 National Fire Incident Reporting System (NFIRS) incidents
- Incident types reported to NFIRS in Stow, OH
- 11,81670.4%Rescue & EMS
- 1,5859.4%Service Call
- 1,0926.5%Hazardous Condition
- 1,0686.4%False Alarm
- 7434.4%Fire
- 4322.6%Good Intent Call
- 240.1%Severe Weather
- Fire incident types reported to NFIRS in Stow, OH
- 35748.0%Structure Fires
- 27937.6%Outside Fires
- 10514.1%Mobile Property/Vehicle Fires
- 20.3%Other
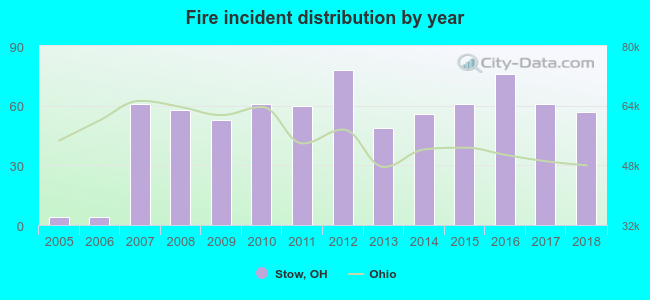 Based on the data from the years 2005 - 2018 the average number of fires per year is 53. The highest number of reported fires - 78 took place in 2012, and the least - 4 in 2005. The data has an increasing trend.
The average number of yearly fire incidents per 10k residents in Stow, OH compared to nearest cities:
(Note: Based on data for the last 3 years, including only cities with population 5,000 and above)
| Stow: | 18.6 |
| Munroe Falls: | 12.6 |
| Cuyahoga Falls: | 24.9 |
| Kent: | 26.5 |
| Hudson: | 12.2 |
| Tallmadge: | 28.1 |
| Streetsboro: | 35.3 |
| Akron: | 43.8 |
| Fairlawn: | 48.5 |
 The median response time based on all reported fire incidents is 5 minutes. This is lower than the Ohio median value.
The median response time in Stow, OH compared to nearest cities:
(Note: Based on data for all years, including only cities with at least 500 fire incidents)
| Stow: | 5 minutes |
| Cuyahoga Falls: | 4 minutes |
| Kent: | 6 minutes |
| Hudson: | 6 minutes |
| Tallmadge: | 5 minutes |
| Streetsboro: | 6 minutes |
| Brimfield: | 6 minutes |
| Akron: | 5 minutes |
| Mogadore: | 6 minutes |
 According to the data from the years 2005 - 2018 the average number of fire-related yearly casualties is 2. The highest number of reported casualties - 6 took place in 2011, and the lowest - 0 in 2005. The data has a rising trend.
The average number of injuries per 1,000 fires is 39. This indicator was the highest - 100 in 2011, and the lowest 0 in 2005. The trend for casualties per 1,000 fire incidents is growing. Compared to the Ohio value the number of casualties per 1,000 fire incidents is much higher.
According to the data from the years 2005 - 2018 the average number of fire-related yearly casualties is 2. The highest number of reported casualties - 6 took place in 2011, and the lowest - 0 in 2005. The data has a rising trend.
The average number of injuries per 1,000 fires is 39. This indicator was the highest - 100 in 2011, and the lowest 0 in 2005. The trend for casualties per 1,000 fire incidents is growing. Compared to the Ohio value the number of casualties per 1,000 fire incidents is much higher.Casualties per 1,000 incidents in Stow, OH compared to nearest cities:
(Note: Based on data for all years, including only cities with at least 500 fire incidents)
| Stow: | 43.1 |
| Cuyahoga Falls: | 41.0 |
| Kent: | 12.9 |
| Hudson: | 1.6 |
| Tallmadge: | 23.7 |
| Streetsboro: | 10.4 |
| Brimfield: | 3.9 |
| Akron: | 35.0 |
| Mogadore: | 10.3 |
 25.2% incidents where reported in the morning and 74.8% in the evening. The most fires (17.0%) took place on Saturday, and the least (12.7%) on Friday.
 According to the 743 fire incident reports from years 2005 - 2018 most fires (12.5%) took place during April, and the least (5.0%) in February.
 Out of all 16,782 cases reported during the years 2005 - 2018, the most belonged to the categories: Rescue & EMS (70.4%), Service Call (9.4%), and Hazardous Condition (6.5%).
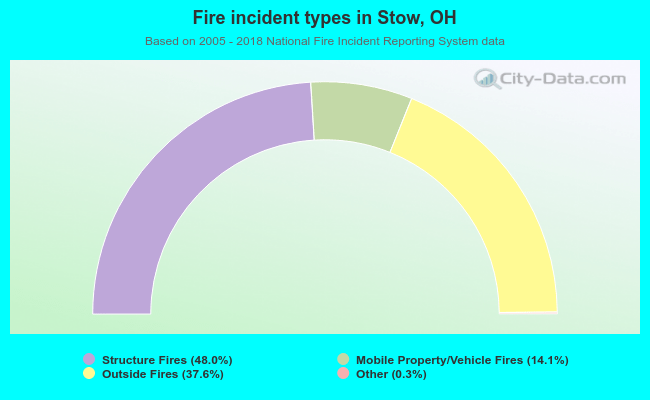 When looking into fire subcategories, the most incidents belonged to: Structure Fires (48.0%), and Outside Fires (37.6%).