Estimated zip code population in 2022: 7,844 Zip code population in 2010: 6,757 Zip code population in 2000: 5,789
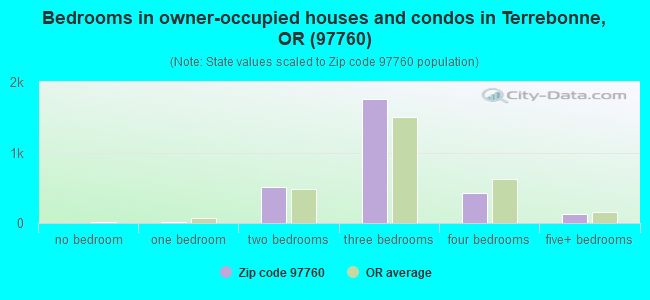
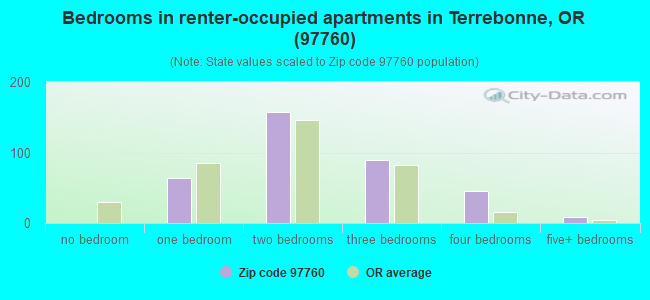
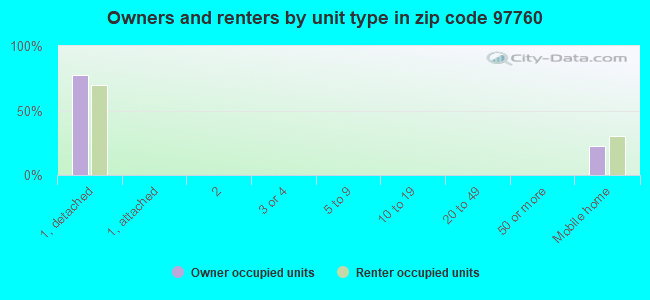
Houses and condos: 3,621 Renter-occupied apartments: 367
% of renters here:
11%
State:
37%
March 2022 cost of living index in zip code 97760: 92.1 (less than average, U.S. average is 100)
Land area: 96.8 sq. mi. Water area: 0.2 sq. mi.
Population density: 81 people per square mile
(very low).
OSM Map
General Map
Google Map
MSN Map
OSM Map
General Map
Google Map
MSN Map
OSM Map
General Map
Google Map
MSN Map
OSM Map
General Map
Google Map
MSN Map
Please wait while loading the map...
Real estate property taxes paid for housing units in 2022:
This zip code:
0.6% ($2,836)
Oregon:
0.8% ($3,646)
Median real estate property taxes paid for housing units with mortgages in 2022: $2,797 (0.6%) Median real estate property taxes paid for housing units with no mortgage in 2022: $2,908 (0.6%)
Averages for the 2020 tax year for zip code 97760, filed in 2021:
Average Adjusted Gross Income (AGI) in 2020: $72,541 (Individual Income Tax Returns)
Here:
$72,541
State:
$76,001
Salary/wage: $53,965 (reported on 70.3% of returns)
Here:
$53,965
State:
$61,959
(% of AGI for various income ranges: 1116.9% for AGIs below $25k, 3360.2% for AGIs $25k-50k, 5948.9% for AGIs $50k-75k, 7920.3% for AGIs $75k-100k, 17583.3% for AGIs $100k-200k, 53032.5% for AGIs over 200k)
Taxable interest for individuals: $1,849 (reported on 35.9% of returns)
This zip code:
$1,849
Oregon:
$1,628
(% of AGI for various income ranges: 23.6% for AGIs below $25k, 27.2% for AGIs $25k-50k, 63.4% for AGIs $50k-75k, 58.3% for AGIs $75k-100k, 162.3% for AGIs $100k-200k, 3500.0% for AGIs over 200k)
Ordinary dividends: $4,195 (reported on 18.7% of returns)
Here:
$4,195
State:
$7,165
(% of AGI for various income ranges: 51.6% for AGIs below $25k, 50.2% for AGIs $25k-50k, 93.6% for AGIs $50k-75k, 119.7% for AGIs $75k-100k, 226.7% for AGIs $100k-200k, 2535.0% for AGIs over 200k)
Net capital gain/loss in AGI: +$20,644 (reported on 19.7% of returns)
Here:
+$20,644
State:
+$23,403
(% of AGI for various income ranges: 9.4% for AGIs below $25k, 62.3% for AGIs $25k-50k, 121.6% for AGIs $50k-75k, 361.3% for AGIs $75k-100k, 1201.0% for AGIs $100k-200k, 27040.0% for AGIs over 200k)
Profit/loss from business: +$11,433 (reported on 14.7% of returns)
Here:
+$11,433
State:
+$16,511
(% of AGI for various income ranges: 170.4% for AGIs below $25k, 173.8% for AGIs $25k-50k, 244.8% for AGIs $50k-75k, 192.0% for AGIs $75k-100k, 654.7% for AGIs $100k-200k, 2002.5% for AGIs over 200k)
Taxable individual retirement arrangement distribution: $20,039 (reported on 15.0% of returns)
97760:
$20,039
Oregon:
$20,730
(% of AGI for various income ranges: 144.4% for AGIs below $25k, 198.0% for AGIs $25k-50k, 510.5% for AGIs $50k-75k, 689.7% for AGIs $75k-100k, 1217.3% for AGIs $100k-200k, 4645.0% for AGIs over 200k)
Total itemized deductions: $27,985 (reported on 13.0% of returns)
Here:
$27,985
State:
$31,050
(% of AGI for various income ranges: 120.3% for AGIs below $25k, 261.8% for AGIs $25k-50k, 556.8% for AGIs $50k-75k, 770.7% for AGIs $75k-100k, 1711.7% for AGIs $100k-200k, 5767.5% for AGIs over 200k)
Charity contributions: $5,047 (reported on 9.3% of returns)
Here:
$5,047
State:
$8,791
(% of AGI for various income ranges: 8.2% for AGIs below $25k, 26.9% for AGIs $25k-50k, 35.5% for AGIs $50k-75k, 88.3% for AGIs $75k-100k, 234.0% for AGIs $100k-200k, 1392.5% for AGIs over 200k)
Taxes paid: $7,728 (reported on 13.0% of returns)
97760:
$7,728
State:
$8,487
(% of AGI for various income ranges: 21.3% for AGIs below $25k, 52.0% for AGIs $25k-50k, 160.2% for AGIs $50k-75k, 241.3% for AGIs $75k-100k, 545.0% for AGIs $100k-200k, 1325.0% for AGIs over 200k)
Earned income credit: $1,691 (reported on 11.1% of returns)
Here:
$1,691
State:
$1,977
(% of AGI for various income ranges: 59.2% for AGIs below $25k, 46.9% for AGIs $25k-50k)
Percentage of individuals using paid preparers for their 2020 taxes: 93.4%
Here:
93%
State:
93%
(% for various income ranges: 92.4% for AGIs below $25k, 93.5% for AGIs $25k-50k, 94.2% for AGIs $50k-75k, 93.5% for AGIs $75k-100k, 93.8% for AGIs $100k-200k, 93.3% for AGIs over 200k)
Averages for the 2012 tax year for zip code 97760, filed in 2013:
Average Adjusted Gross Income (AGI) in 2012: $47,582 (Individual Income Tax Returns)
Here:
$47,582
State:
$57,845
Salary/wage: $38,430 (reported on 69.6% of returns)
Here:
$38,430
State:
$47,723
(% of AGI for various income ranges: 56.3% for AGIs below $25k, 63.5% for AGIs $25k-50k, 58.2% for AGIs $50k-75k, 55.4% for AGIs $75k-100k, 53.5% for AGIs $100k-200k, 42.7% for AGIs over 200k)
Taxable interest for individuals: $1,512 (reported on 35.0% of returns)
This zip code:
$1,512
Oregon:
$1,848
(% of AGI for various income ranges: 2.5% for AGIs below $25k, 0.8% for AGIs $25k-50k, 0.8% for AGIs $50k-75k, 1.0% for AGIs $75k-100k, 0.8% for AGIs $100k-200k, 2.1% for AGIs over 200k)
Ordinary dividends: $3,790 (reported on 19.5% of returns)
Here:
$3,790
State:
$5,987
(% of AGI for various income ranges: 2.4% for AGIs below $25k, 1.6% for AGIs $25k-50k, 0.6% for AGIs $50k-75k, 1.0% for AGIs $75k-100k, 3.1% for AGIs $100k-200k)
Net capital gain/loss in AGI: +$6,709 (reported on 18.5% of returns)
Here:
+$6,709
State:
+$13,095
(% of AGI for various income ranges: 0.3% for AGIs below $25k, 0.6% for AGIs $25k-50k, 0.8% for AGIs $50k-75k, 1.1% for AGIs $75k-100k, 3.5% for AGIs $100k-200k, 16.5% for AGIs over 200k)
Profit/loss from business: +$7,818 (reported on 16.5% of returns)
Here:
+$7,818
State:
+$13,871
(% of AGI for various income ranges: 7.2% for AGIs below $25k, 3.0% for AGIs $25k-50k, 1.8% for AGIs $50k-75k, 2.7% for AGIs $75k-100k, 2.3% for AGIs $100k-200k)
Taxable individual retirement arrangement distribution: $15,440 (reported on 18.8% of returns)
97760:
$15,440
Oregon:
$16,036
(% of AGI for various income ranges: 7.0% for AGIs below $25k, 5.5% for AGIs $25k-50k, 4.7% for AGIs $50k-75k, 6.4% for AGIs $75k-100k, 9.5% for AGIs $100k-200k)
Total itemized deductions: $20,756 (29% of AGI, reported on 41.6% of returns)
Here:
$20,756
State:
$24,430
Here:
28.5% of AGI
State:
23.2% of AGI
(% of AGI for various income ranges: 19.9% for AGIs below $25k, 18.5% for AGIs $25k-50k, 16.6% for AGIs $50k-75k, 18.9% for AGIs $75k-100k, 18.5% for AGIs $100k-200k, 16.2% for AGIs over 200k)
Charity contributions: $2,440 (reported on 32.0% of returns)
Here:
$2,440
State:
$3,648
(% of AGI for various income ranges: 1.0% for AGIs below $25k, 1.3% for AGIs $25k-50k, 1.7% for AGIs $50k-75k, 2.1% for AGIs $75k-100k, 1.8% for AGIs $100k-200k, 1.8% for AGIs over 200k)
Taxes paid: $6,581 (reported on 40.9% of returns)
97760:
$6,581
State:
$10,269
(% of AGI for various income ranges: 3.7% for AGIs below $25k, 4.1% for AGIs $25k-50k, 4.8% for AGIs $50k-75k, 6.8% for AGIs $75k-100k, 7.2% for AGIs $100k-200k, 7.4% for AGIs over 200k)
Earned income credit: $1,870 (reported on 15.2% of returns)
Here:
$1,870
State:
$2,021
(% of AGI for various income ranges: 4.3% for AGIs below $25k, 0.8% for AGIs $25k-50k)
Percentage of individuals using paid preparers for their 2012 taxes: 52.5%
Here:
52%
State:
47%
(% for various income ranges: 44.4% for AGIs below $25k, 51.9% for AGIs $25k-50k, 55.1% for AGIs $50k-75k, 59.4% for AGIs $75k-100k, 72.0% for AGIs $100k-200k, 100.0% for AGIs over 200k)
Averages for the 2004 tax year for zip code 97760, filed in 2005:
Average Adjusted Gross Income (AGI) in 2004: $37,695 (Individual Income Tax Returns)
Here:
$37,695
State:
$46,788
Salary/wage: $33,641 (reported on 74.0% of returns)
Here:
$33,641
State:
$39,788
(% of AGI for various income ranges: 731.9% for AGIs below $10k, 62.0% for AGIs $10k-25k, 69.1% for AGIs $25k-50k, 69.6% for AGIs $50k-75k, 69.2% for AGIs $75k-100k, 48.7% for AGIs over 100k)
Taxable interest for individuals: $1,963 (reported on 42.9% of returns)
This zip code:
$1,963
Oregon:
$2,126
(% of AGI for various income ranges: 75.9% for AGIs below $10k, 2.9% for AGIs $10k-25k, 1.7% for AGIs $25k-50k, 1.0% for AGIs $50k-75k, 1.4% for AGIs $75k-100k, 4.3% for AGIs over 100k)
Taxable dividends: $1,927 (reported on 22.5% of returns)
Here:
$1,927
State:
$3,427
(% of AGI for various income ranges: 35.6% for AGIs below $10k, 1.6% for AGIs $10k-25k, 0.9% for AGIs $25k-50k, 0.6% for AGIs $50k-75k, 0.9% for AGIs $75k-100k, 1.8% for AGIs over 100k)
Net capital gain/loss: +$9,040 (reported on 21.1% of returns)
Here:
+$9,040
State:
+$12,447
(% of AGI for various income ranges: 127.3% for AGIs below $10k, 0.6% for AGIs $10k-25k, 1.3% for AGIs $25k-50k, 1.4% for AGIs $50k-75k, 2.9% for AGIs $75k-100k, 20.2% for AGIs over 100k)
Profit/loss from business: +$6,755 (reported on 17.9% of returns)
Here:
+$6,755
State:
+$11,682
(% of AGI for various income ranges: 26.9% for AGIs below $10k, 6.3% for AGIs $10k-25k, 4.0% for AGIs $25k-50k, 2.5% for AGIs $50k-75k, 2.8% for AGIs $75k-100k, 1.0% for AGIs over 100k)
IRA payment deduction: $3,305 (reported on 2.9% of returns)
97760:
$3,305
Oregon:
$3,035
(% of AGI for various income ranges: 0.3% for AGIs $10k-25k, 0.4% for AGIs $25k-50k, 0.1% for AGIs $50k-75k, 0.3% for AGIs $75k-100k)
Self-employed pension: $7,000 (reported on 0.4% of returns)
Here:
$7,000
Oregon:
$14,224
Total itemized deductions: $16,645 (31% of AGI, reported on 47.8% of returns)
Here:
$16,645
State:
$20,209
Here:
30.5% of AGI
State:
24.7% of AGI
(% of AGI for various income ranges: 224.5% for AGIs below $10k, 23.2% for AGIs $10k-25k, 20.7% for AGIs $25k-50k, 20.4% for AGIs $50k-75k, 21.6% for AGIs $75k-100k, 18.6% for AGIs over 100k)
Charity contributions deductions: $2,215 (4% of AGI, reported on 36.1% of returns)
Here:
$2,215
State:
$3,145
Here:
3.8% of AGI
State:
3.6% of AGI
(% of AGI for various income ranges: 19.9% for AGIs below $10k, 1.9% for AGIs $10k-25k, 1.5% for AGIs $25k-50k, 1.9% for AGIs $50k-75k, 2.5% for AGIs $75k-100k, 3.1% for AGIs over 100k)
Total tax: $4,169 (reported on 74.2% of returns)
97760:
$4,169
State:
$7,148
(% of AGI for various income ranges: 36.1% for AGIs below $10k, 3.9% for AGIs $10k-25k, 6.1% for AGIs $25k-50k, 7.7% for AGIs $50k-75k, 9.8% for AGIs $75k-100k, 13.7% for AGIs over 100k)
Earned income credit: $1,535 (reported on 13.9% of returns)
Here:
$1,535
State:
$1,605
Percentage of individuals using paid preparers for their 2004 taxes: 62.5%
Here:
63%
State:
53%
(% for various income ranges: 55.4% for AGIs below $10k, 62.8% for AGIs $10k-25k, 62.0% for AGIs $25k-50k, 64.0% for AGIs $50k-75k, 68.9% for AGIs $75k-100k, 77.0% for AGIs over 100k)
Likely homosexual households (counted as self-reported same-sex unmarried-partner households)
Lesbian couples: 0.7% of all households
Gay men: 0.3% of all households
Household received Food Stamps/SNAP in the past 12 months: 396 Household did not receive Food Stamps/SNAP in the past 12 months: 2,818
Women who had a birth in the past 12 months: 51 (52 now married, 0 unmarried) Women who did not have a birth in the past 12 months: 1,492 (520 now married, 977 unmarried)
Housing units in zip code 97760 with a mortgage: 1,810 (111 second mortgage, 22 home equity loan, 76 both second mortgage and home equity loan) Houses without a mortgage: 14
Median monthly owner costs for units with a mortgage: $1,797 Median monthly owner costs for units without a mortgage: $507
Residents with income below the poverty level in 2022:
This zip code:
10.6%
Whole state:
12.1%
Residents with income below 50% of the poverty level in 2022:
This zip code:
6.2%
Whole state:
6.2%
Median number of rooms in houses and condos:
Here:
6.2
State:
6.2
Median number of rooms in apartments:
Here:
4.3
State:
4.0
Notable locations in this zip code not listed on our city pages
Notable locations in zip code 97760: Gates Ranch (A), Cascades East Transit Terrebonne Park and Ride (B), Crooked River Ranch Fire District (C), Redmond Fire and Rescue Station 402 (D). Display/hide their locations on the map
Size of family households: 1,417 2-persons, 502 3-persons, 220 4-persons, 46 5-persons, 132 6-persons, 21 7-or-more-persons
Size of nonfamily households: 627 1-person, 243 2-persons, 9 3-persons
427 married couples with children.
271 single-parent households (142 men, 129 women).
94.2% of residents of 97760 zip code speak English at home.
4.4% of residents speak Spanish at home (78% very well, 22% well).
1.7% of residents speak other Indo-European language at home (40% very well, 60% well).
0.2% of residents speak Asian or Pacific Island language at home (100% very well).
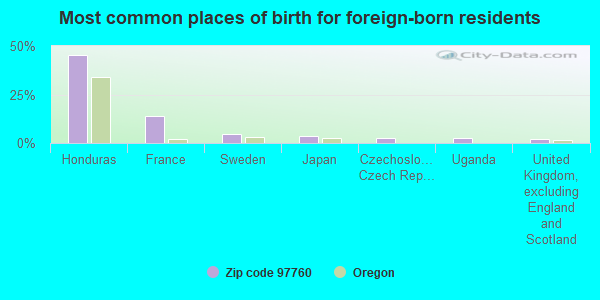
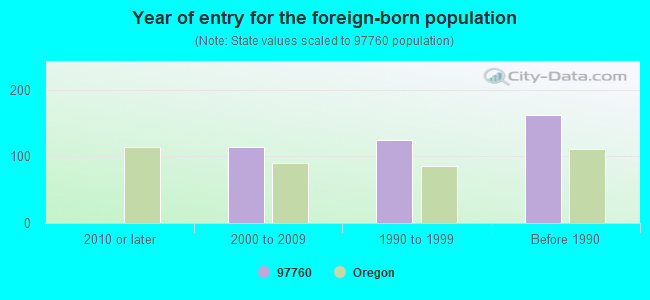
Foreign born population: 410 (5.2%) (39.2% of them are naturalized citizens)
This zip code:
5.2%
Whole state:
9.9%
45%Honduras
14%France
4%Sweden
3%Japan
2%Czechoslovakia (includes Czech Republic and Slovakia)
2%Uganda
2%United Kingdom, excluding England and Scotland
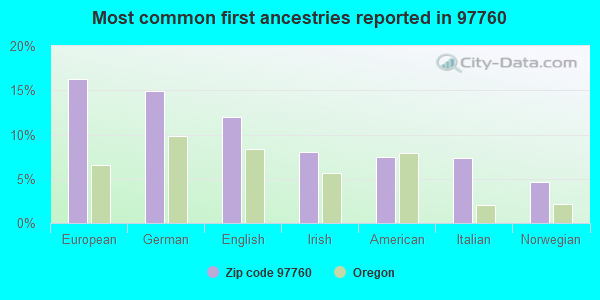
16%European
15%German
12%English
8%Irish
7%American
7%Italian
5%Norwegian
Year of entry for the foreign-born population
02010 or later
1142000 to 2009
1251990 to 1999
162Before 1990
Facilities with environmental interests located in this zip code:
CROOKED RIVER RANCH CLUB AND MAINTENANCE ASSOCIATION (14875 HAYS LANE in CROOKED RIVER RANCH, OR)
STATE MASTER (Oregon inspections and permits database) - OR-SIS-110024-101673, ONSITE WASTEWATER TREATMENT (Resource Conservation and Recovery Act (tracking hazardous waste)) Business SIC classification: SEWERAGE SYSTEMS; CIVIC, SOCIAL, AND FRATERNAL ASSOCIATIONS Organizations: CROOKED RIVER RANCH CLUB & MAINT. ASSOC. (CONTACT/OWNER)
ABBOTT PETROLEUM (8805 11TH STREET in TERREBONNE, OR)
ENFORCEMENT/COMPLIANCE ACTIVITY (Integrated Compliance Information System) STATE MASTER (Oregon inspections and permits database) - OR-UST-BFDDC, LEAKING STORAGE TANK, OR-UST-BFDDD, OR-UST-BFDDE, OR-UST-BFDDF,
BENSON SURFACE TREATMENT (12790 SW PENINSULA in DATA NOT AVAILABLE, OR)
(Resource Conservation and Recovery Act (tracking hazardous waste))
HAYDEN WATSON PROPERTY (14045 COMMERCIAL LOOP in CROOKED RIVER RANCH, OR)
(Resource Conservation and Recovery Act (tracking hazardous waste))
Housing units lacking complete plumbing facilities: 2.0% Housing units lacking complete kitchen facilities: 0.6%
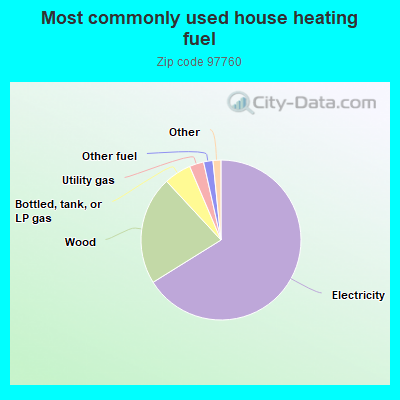
66.2%Electricity
22.0%Wood
5.5%Bottled, tank, or LP gas
2.9%Utility gas
1.9%Other fuel
0.7%Fuel oil, kerosene, etc.
0.7%Solar energy
Population in 1990: 2,101. Population change in the 1990s: +3,688 (+175.5%).
Place of birth for U.S.-born residents:
This state: 3,775
Northeast: 249
Midwest: 578
South: 474
West: 2,337
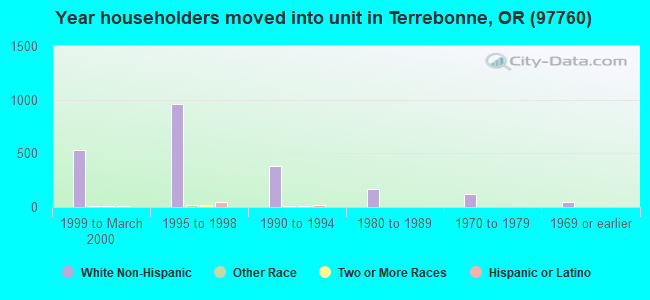
36% of the 97760 zip code residents lived in the same house 5 years ago. Out of people who lived in different houses, 15% lived in this county. Out of people who lived in different counties, 50% lived in Oregon.
90% of the 97760 zip code residents lived in the same house 1 year ago. Out of people who lived in different houses, 27% moved from this county. Out of people who lived in different houses, 71% moved from different county within same state. Out of people who lived in different houses, 11% moved from different state.
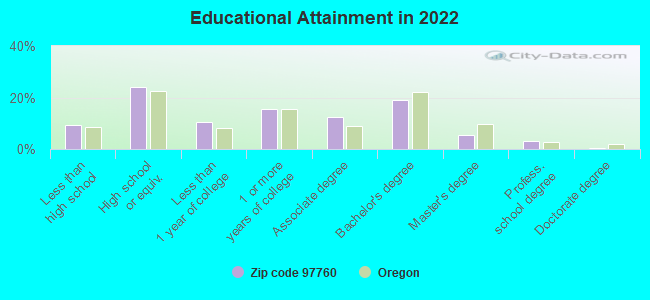
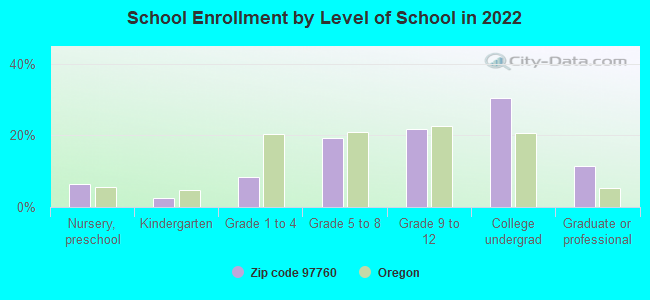
Private vs. public school enrollment:
Students in private schools in grades 1 to 8 (elementary and middle school): 27
Here:
7.4%
Oregon:
13.7%
Students in private schools in grades 9 to 12 (high school):
Here:
0.0%
Oregon:
8.8%
Students in private undergraduate colleges: 158
Here:
39.0%
Oregon:
17.7%
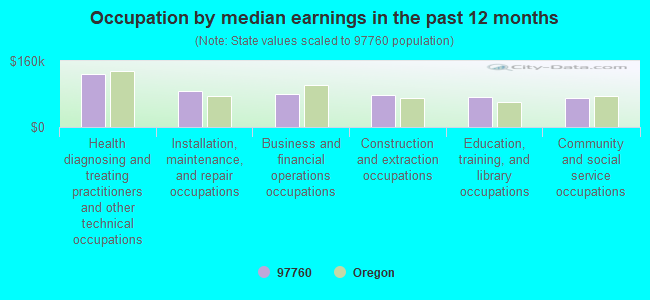
Occupation by median earnings in the past 12 months ($)
129,049Health diagnosing and treating practitioners and other technical occupations
88,132Installation, maintenance, and repair occupations
79,840Business and financial operations occupations
78,356Construction and extraction occupations
71,654Education, training, and library occupations
70,048Community and social service occupations
Top industries in this zip code by the number of employees in 2005:
Other Services (except Public Administration): Other Similar Organizations (except Business, Professional, Labor, and Political Organizations) (20-49: 1)
Mining: Crushed and Broken Granite Mining and Quarrying (20-49: 1)
Administrative and Support and Waste Management and Remediation Services: Janitorial Services (20-49: 1)
Construction: Highway, Street, and Bridge Construction (20-49: 1)
Construction: Site Preparation Contractors (10-19: 1, 5-9: 1, 1-4: 5)
Construction: New Single-Family Housing Construction (except Operative Builders) (1-4: 8)
Professional, Scientific, and Technical Services: Veterinary Services (10-19: 1)
Construction: Poured Concrete Foundation and Structure Contractors (10-19: 1)
People in group quarters in 2010:
8 people in group homes intended for adults
People in group quarters in 2000:
3 people in other group homes
Fatal accident statistics in 2012:
Fatal accident count: 1
Vehicles involved in fatal accidents: 2
Fatal accidents caused by drunken drivers: 0
Fatalities: 2
Persons involved in fatal accidents: 6
Pedestrians involved in fatal accidents: 0
Fatal accident statistics in 2011:
Fatal accident count: 1
Vehicles involved in fatal accidents: 1
Fatal accidents caused by drunken drivers: 0
Fatalities: 1
Persons involved in fatal accidents: 1
Pedestrians involved in fatal accidents: 1
Home Mortgage Disclosure Act Aggregated Statistics For Year 2009 (Based on 4 partial tracts)
A) FHA, FSA/RHS & VA Home Purchase Loans
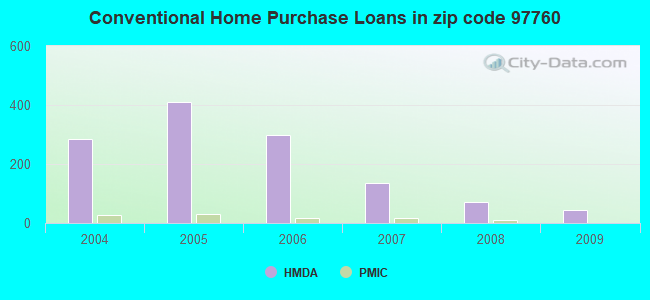
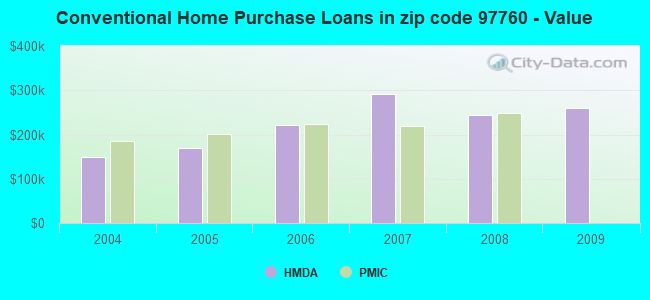
B) Conventional Home Purchase Loans
C) Refinancings
D) Home Improvement Loans
E) Loans on Dwellings For 5+ Families
F) Non-occupant Loans on < 5 Family Dwellings (A B C & D)
G) Loans On Manufactured Home Dwelling (A B C & D)
Number
Average Value
Number
Average Value
Number
Average Value
Number
Average Value
Number
Average Value
Number
Average Value
Number
Average Value
LOANS ORIGINATED
49
$150,643
45
$260,869
232
$240,714
5
$202,252
0
$0
42
$232,770
21
$162,482
APPLICATIONS APPROVED, NOT ACCEPTED
6
$140,117
3
$178,833
22
$258,592
2
$17,280
0
$0
4
$237,182
3
$153,747
APPLICATIONS DENIED
17
$148,885
14
$288,482
117
$290,028
3
$247,550
1
$7,586,880
21
$325,117
18
$138,687
APPLICATIONS WITHDRAWN
9
$141,864
9
$232,304
57
$229,385
2
$71,055
0
$0
12
$258,212
7
$163,356
FILES CLOSED FOR INCOMPLETENESS
1
$104,610
2
$192,370
13
$190,442
0
$0
0
$0
2
$219,170
1
$95,270
Aggregated Statistics For Year 2008 (Based on 4 partial tracts)
A) FHA, FSA/RHS & VA Home Purchase Loans
B) Conventional Home Purchase Loans
C) Refinancings
D) Home Improvement Loans
F) Non-occupant Loans on < 5 Family Dwellings (A B C & D)
G) Loans On Manufactured Home Dwelling (A B C & D)
Number
Average Value
Number
Average Value
Number
Average Value
Number
Average Value
Number
Average Value
Number
Average Value
LOANS ORIGINATED
52
$207,589
72
$243,559
152
$279,969
13
$129,685
47
$277,717
31
$189,298
APPLICATIONS APPROVED, NOT ACCEPTED
3
$165,180
18
$202,405
39
$230,009
0
$0
15
$207,281
10
$158,838
APPLICATIONS DENIED
16
$197,062
32
$288,575
143
$295,432
14
$148,085
21
$296,313
22
$178,347
APPLICATIONS WITHDRAWN
5
$183,812
18
$268,691
60
$225,184
5
$109,966
10
$297,991
10
$198,526
FILES CLOSED FOR INCOMPLETENESS
1
$167,190
3
$316,783
10
$258,823
3
$171,667
0
$0
4
$185,632
Aggregated Statistics For Year 2007 (Based on 4 partial tracts)
A) FHA, FSA/RHS & VA Home Purchase Loans
B) Conventional Home Purchase Loans
C) Refinancings
D) Home Improvement Loans
F) Non-occupant Loans on < 5 Family Dwellings (A B C & D)
G) Loans On Manufactured Home Dwelling (A B C & D)
Number
Average Value
Number
Average Value
Number
Average Value
Number
Average Value
Number
Average Value
Number
Average Value
LOANS ORIGINATED
4
$193,888
134
$291,270
278
$260,584
49
$194,614
67
$257,293
46
$163,949
APPLICATIONS APPROVED, NOT ACCEPTED
0
$0
23
$240,910
44
$284,909
11
$131,570
9
$273,639
8
$141,640
APPLICATIONS DENIED
3
$131,070
41
$316,621
160
$252,514
22
$101,913
15
$258,605
35
$184,237
APPLICATIONS WITHDRAWN
3
$143,523
14
$375,733
82
$244,552
13
$132,008
6
$240,047
9
$149,452
FILES CLOSED FOR INCOMPLETENESS
0
$0
5
$409,354
29
$226,497
0
$0
0
$0
6
$201,032
Aggregated Statistics For Year 2006 (Based on 4 partial tracts)
A) FHA, FSA/RHS & VA Home Purchase Loans
B) Conventional Home Purchase Loans
C) Refinancings
D) Home Improvement Loans
F) Non-occupant Loans on < 5 Family Dwellings (A B C & D)
G) Loans On Manufactured Home Dwelling (A B C & D)
Number
Average Value
Number
Average Value
Number
Average Value
Number
Average Value
Number
Average Value
Number
Average Value
LOANS ORIGINATED
7
$199,209
299
$221,870
384
$224,715
30
$158,483
127
$252,173
52
$161,471
APPLICATIONS APPROVED, NOT ACCEPTED
1
$388,540
40
$232,214
60
$231,210
4
$89,718
15
$241,730
11
$147,811
APPLICATIONS DENIED
2
$266,655
63
$245,073
125
$219,656
15
$118,887
17
$232,048
43
$157,859
APPLICATIONS WITHDRAWN
1
$304,260
30
$220,633
108
$206,640
9
$101,977
11
$279,645
12
$160,411
FILES CLOSED FOR INCOMPLETENESS
1
$389,480
7
$173,057
36
$221,465
3
$198,000
1
$280,200
4
$126,090
Aggregated Statistics For Year 2005 (Based on 4 partial tracts)
A) FHA, FSA/RHS & VA Home Purchase Loans
B) Conventional Home Purchase Loans
C) Refinancings
D) Home Improvement Loans
F) Non-occupant Loans on < 5 Family Dwellings (A B C & D)
G) Loans On Manufactured Home Dwelling (A B C & D)
Number
Average Value
Number
Average Value
Number
Average Value
Number
Average Value
Number
Average Value
Number
Average Value
LOANS ORIGINATED
18
$154,821
409
$169,719
269
$197,733
26
$125,463
154
$175,198
57
$143,012
APPLICATIONS APPROVED, NOT ACCEPTED
2
$137,765
46
$177,133
49
$191,853
3
$110,867
18
$199,633
7
$141,056
APPLICATIONS DENIED
4
$163,682
49
$172,343
158
$184,379
24
$96,111
19
$192,682
45
$136,827
APPLICATIONS WITHDRAWN
0
$0
38
$186,503
117
$172,446
18
$113,869
10
$163,368
19
$109,873
FILES CLOSED FOR INCOMPLETENESS
0
$0
10
$141,001
36
$206,169
1
$28,950
6
$162,760
1
$152,210
Aggregated Statistics For Year 2004 (Based on 4 partial tracts)
A) FHA, FSA/RHS & VA Home Purchase Loans
B) Conventional Home Purchase Loans
C) Refinancings
D) Home Improvement Loans
E) Loans on Dwellings For 5+ Families
F) Non-occupant Loans on < 5 Family Dwellings (A B C & D)
G) Loans On Manufactured Home Dwelling (A B C & D)
Detailed PMIC statistics for the following Tracts:9907.00
, 9908.00
2002 - 2018 National Fire Incident Reporting System (NFIRS) incidents
Based on the data from the years 2002 - 2018 the average number of fires per year is 31. The highest number of reported fire incidents - 67 took place in 2002, and the least - 8 in 2010. The data has a decreasing trend.
When looking into fire subcategories, the most incidents belonged to: Outside Fires (62.1%), and Structure Fires (27.2%).
Fire incident types reported to NFIRS in Zip Code 97760
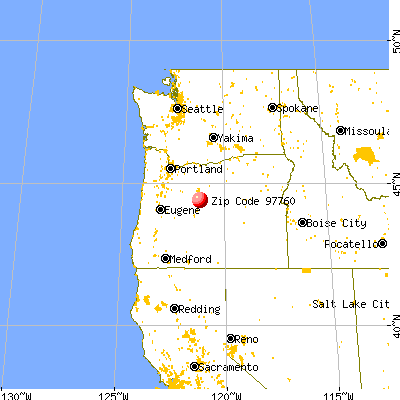


 Nearest zip codes: 97756, 97734, 97753, 97701, 97741, 97702.


 Based on the data from the years 2002 - 2018 the average number of fires per year is 31. The highest number of reported fire incidents - 67 took place in 2002, and the least - 8 in 2010. The data has a decreasing trend.
 When looking into fire subcategories, the most incidents belonged to: Outside Fires (62.1%), and Structure Fires (27.2%).