Estimated zip code population in 2022: 6,214 Zip code population in 2010: 3,847 Zip code population in 2000: 3,519
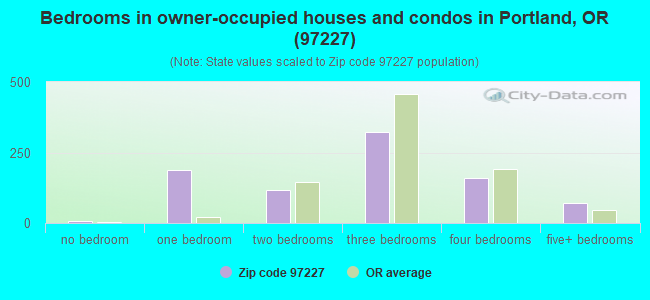
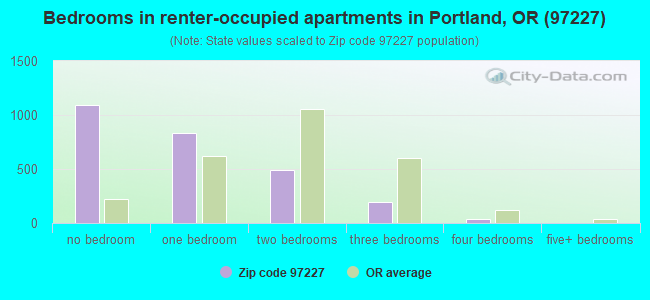
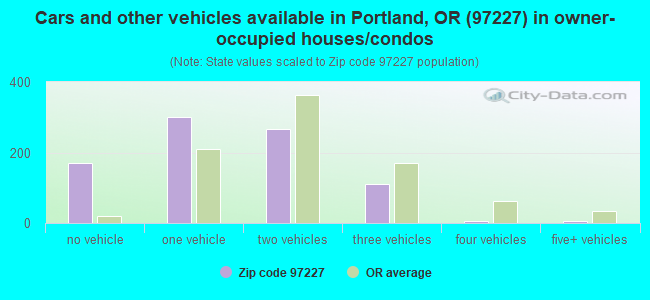
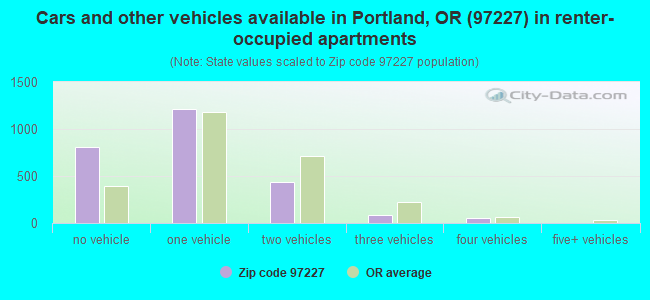
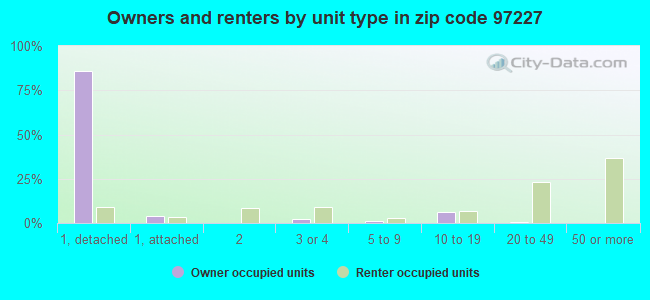
Houses and condos: 3,666 Renter-occupied apartments: 2,572
% of renters here:
75%
State:
37%
March 2022 cost of living index in zip code 97227: 105.9 (more than average, U.S. average is 100)
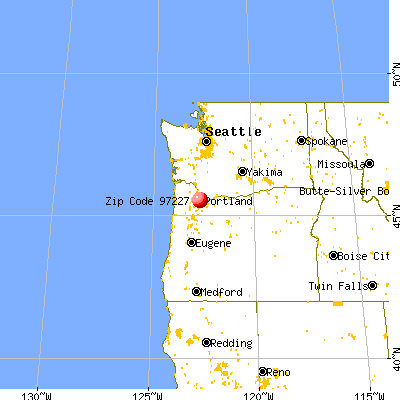
Land area: 1.3 sq. mi. Water area: 0.3 sq. mi.
Population density: 4,635 people per square mile
(average).
OSM Map
General Map
Google Map
MSN Map
OSM Map
General Map
Google Map
MSN Map
OSM Map
General Map
Google Map
MSN Map
OSM Map
General Map
Google Map
MSN Map
Please wait while loading the map...
Real estate property taxes paid for housing units in 2022:
This zip code:
0.5% ($3,470)
Oregon:
0.8% ($3,646)
Median real estate property taxes paid for housing units with mortgages in 2022: $3,248 (0.5%) Median real estate property taxes paid for housing units with no mortgage in 2022: $4,679 (0.7%)
Business Search- 14 Million verified businesses
Males: 3,057
(49.2%)
Females: 3,156
(50.8%)
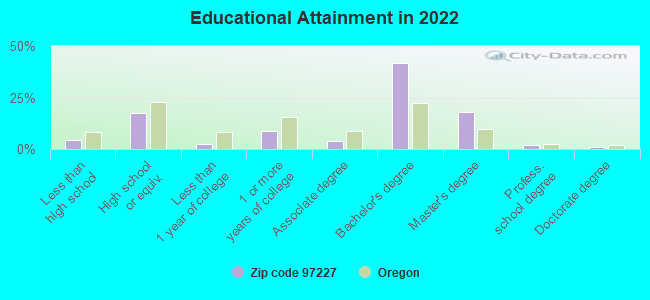
For population 25 years and over in 97227:
High school or higher: 96.4%
Bachelor's degree or higher: 63.3%
Graduate or professional degree: 21.4%
Unemployed: 3.9%
Mean travel time to work (commute): 19.8 minutes
For population 15 years and over in 97227:
Never married: 61.3%
Now married: 20.5%
Separated: 0.7%
Widowed: 0.9%
Divorced: 16.6%
Zip code 97227 compared to state average:
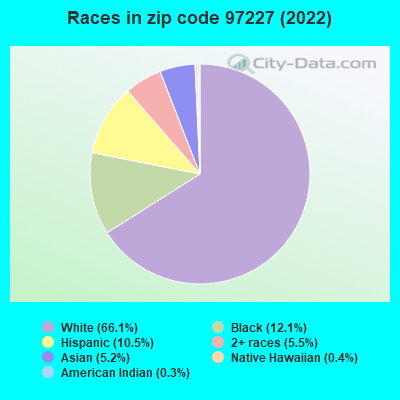
Black race population percentage significantly above state average.
Median age below state average.
Renting percentage above state average.
Number of rooms per house significantly below state average.
Percentage of population with a bachelor's degree or higher above state average.
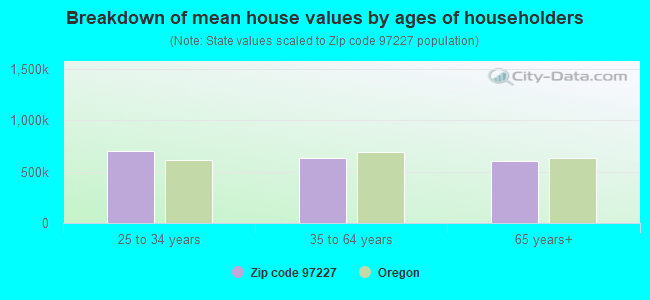
Estimated median house/condo value in 2022: $674,338
97227:
$674,338
Oregon:
$475,600
According to our research of Oregon and other state lists, there were 2 registered sex offenders living in 97227 zip code as of July 02, 2024. The ratio of all residents to sex offenders in zip code 97227 is 2,248 to 1. The ratio of registered sex offenders to all residents in this zip code is near the state average.
Median resident age:
This zip code:
35.6 years
Oregon median age:
40.5 years
Average household size:
This zip code:
1.8 people
Oregon:
2.4 people
Averages for the 2020 tax year for zip code 97227, filed in 2021:
Average Adjusted Gross Income (AGI) in 2020: $69,730 (Individual Income Tax Returns)
Here:
$69,730
State:
$76,001
Salary/wage: $63,225 (reported on 88.5% of returns)
Here:
$63,225
State:
$61,959
(% of AGI for various income ranges: 1157.5% for AGIs below $25k, 3960.3% for AGIs $25k-50k, 7609.0% for AGIs $50k-75k, 10182.8% for AGIs $75k-100k, 20460.4% for AGIs $100k-200k, 77716.0% for AGIs over 200k)
Taxable interest for individuals: $489 (reported on 27.3% of returns)
This zip code:
$489
Oregon:
$1,628
(% of AGI for various income ranges: 5.6% for AGIs below $25k, 4.4% for AGIs $25k-50k, 12.9% for AGIs $50k-75k, 12.8% for AGIs $75k-100k, 57.6% for AGIs $100k-200k, 278.0% for AGIs over 200k)
Ordinary dividends: $2,888 (reported on 21.1% of returns)
Here:
$2,888
State:
$7,165
(% of AGI for various income ranges: 23.3% for AGIs below $25k, 24.1% for AGIs $25k-50k, 69.8% for AGIs $50k-75k, 76.4% for AGIs $75k-100k, 208.0% for AGIs $100k-200k, 1340.0% for AGIs over 200k)
Net capital gain/loss in AGI: +$16,885 (reported on 20.2% of returns)
Here:
+$16,885
State:
+$23,403
(% of AGI for various income ranges: 14.2% for AGIs below $25k, 34.3% for AGIs $25k-50k, 51.2% for AGIs $50k-75k, 129.2% for AGIs $75k-100k, 573.2% for AGIs $100k-200k, 17390.0% for AGIs over 200k)
Profit/loss from business: +$13,045 (reported on 16.5% of returns)
Here:
+$13,045
State:
+$16,511
(% of AGI for various income ranges: 150.2% for AGIs below $25k, 211.9% for AGIs $25k-50k, 366.1% for AGIs $50k-75k, 276.4% for AGIs $75k-100k, 540.4% for AGIs $100k-200k, 2148.0% for AGIs over 200k)
Taxable individual retirement arrangement distribution: $19,615 (reported on 4.0% of returns)
97227:
$19,615
Oregon:
$20,730
(% of AGI for various income ranges: 50.3% for AGIs $25k-50k, 202.4% for AGIs $50k-75k, 551.2% for AGIs $100k-200k)
Self-employed (Keogh) retirement plans: $18,150 (reported on 0.6% of returns)
97227:
$18,150
Oregon:
$22,884
(% of AGI for various income ranges: 53.4% for AGIs $25k-50k)
Total itemized deductions: $25,888 (reported on 8.1% of returns)
Here:
$25,888
State:
$31,050
(% of AGI for various income ranges: 99.1% for AGIs $25k-50k, 149.3% for AGIs $50k-75k, 282.8% for AGIs $75k-100k, 1050.0% for AGIs $100k-200k, 4226.0% for AGIs over 200k)
Charity contributions: $3,965 (reported on 6.2% of returns)
Here:
$3,965
State:
$8,791
(% of AGI for various income ranges: 7.7% for AGIs below $25k, 10.0% for AGIs $50k-75k, 18.0% for AGIs $75k-100k, 158.8% for AGIs $100k-200k, 532.0% for AGIs over 200k)
Taxes paid: $8,838 (reported on 8.1% of returns)
97227:
$8,838
State:
$8,487
(% of AGI for various income ranges: 25.6% for AGIs $25k-50k, 45.9% for AGIs $50k-75k, 118.4% for AGIs $75k-100k, 390.4% for AGIs $100k-200k, 1328.0% for AGIs over 200k)
Earned income credit: $1,116 (reported on 9.6% of returns)
Here:
$1,116
State:
$1,977
(% of AGI for various income ranges: 44.6% for AGIs below $25k, 13.5% for AGIs $25k-50k)
Percentage of individuals using paid preparers for their 2020 taxes: 95.0%
Here:
95%
State:
93%
(% for various income ranges: 93.6% for AGIs below $25k, 95.6% for AGIs $25k-50k, 94.9% for AGIs $50k-75k, 94.1% for AGIs $75k-100k, 97.7% for AGIs $100k-200k, 93.8% for AGIs over 200k)
Averages for the 2012 tax year for zip code 97227, filed in 2013:
Average Adjusted Gross Income (AGI) in 2012: $47,692 (Individual Income Tax Returns)
Here:
$47,692
State:
$57,845
Salary/wage: $44,256 (reported on 88.9% of returns)
Here:
$44,256
State:
$47,723
(% of AGI for various income ranges: 84.0% for AGIs below $25k, 86.6% for AGIs $25k-50k, 88.4% for AGIs $50k-75k, 84.5% for AGIs $75k-100k, 81.5% for AGIs $100k-200k, 66.1% for AGIs over 200k)
Taxable interest for individuals: $445 (reported on 27.6% of returns)
This zip code:
$445
Oregon:
$1,848
(% of AGI for various income ranges: 0.2% for AGIs below $25k, 0.2% for AGIs $25k-50k, 0.2% for AGIs $50k-75k, 0.3% for AGIs $75k-100k, 0.3% for AGIs $100k-200k, 0.4% for AGIs over 200k)
Ordinary dividends: $2,563 (reported on 18.2% of returns)
Here:
$2,563
State:
$5,987
(% of AGI for various income ranges: 0.8% for AGIs below $25k, 0.5% for AGIs $25k-50k, 0.7% for AGIs $50k-75k, 1.4% for AGIs $75k-100k, 1.1% for AGIs $100k-200k, 1.5% for AGIs over 200k)
Net capital gain/loss in AGI: +$4,893 (reported on 13.3% of returns)
Here:
+$4,893
State:
+$13,095
(% of AGI for various income ranges: 0.3% for AGIs below $25k, 0.2% for AGIs $25k-50k, 0.1% for AGIs $50k-75k, 0.4% for AGIs $75k-100k, 1.8% for AGIs $100k-200k, 6.2% for AGIs over 200k)
Profit/loss from business: +$12,278 (reported on 17.8% of returns)
Here:
+$12,278
State:
+$13,871
(% of AGI for various income ranges: 8.5% for AGIs below $25k, 6.5% for AGIs $25k-50k, 4.7% for AGIs $50k-75k, 3.0% for AGIs $75k-100k, 4.5% for AGIs $100k-200k)
Taxable individual retirement arrangement distribution: $8,909 (reported on 4.9% of returns)
97227:
$8,909
Oregon:
$16,036
(% of AGI for various income ranges: 1.2% for AGIs below $25k, 0.8% for AGIs $25k-50k, 2.3% for AGIs $50k-75k, 1.0% for AGIs $100k-200k)
Total itemized deductions: $20,264 (21% of AGI, reported on 29.8% of returns)
Here:
$20,264
State:
$24,430
Here:
21.3% of AGI
State:
23.2% of AGI
(% of AGI for various income ranges: 5.5% for AGIs below $25k, 6.9% for AGIs $25k-50k, 14.8% for AGIs $50k-75k, 14.4% for AGIs $75k-100k, 16.4% for AGIs $100k-200k, 15.3% for AGIs over 200k)
Charity contributions: $1,941 (reported on 21.8% of returns)
Here:
$1,941
State:
$3,648
(% of AGI for various income ranges: 0.4% for AGIs below $25k, 0.6% for AGIs $25k-50k, 1.1% for AGIs $50k-75k, 1.0% for AGIs $75k-100k, 1.1% for AGIs $100k-200k, 1.0% for AGIs over 200k)
Taxes paid: $9,491 (reported on 28.9% of returns)
97227:
$9,491
State:
$10,269
(% of AGI for various income ranges: 1.0% for AGIs below $25k, 2.0% for AGIs $25k-50k, 4.9% for AGIs $50k-75k, 7.3% for AGIs $75k-100k, 8.5% for AGIs $100k-200k, 9.6% for AGIs over 200k)
Earned income credit: $1,192 (reported on 17.8% of returns)
Here:
$1,192
State:
$2,021
(% of AGI for various income ranges: 3.4% for AGIs below $25k, 0.3% for AGIs $25k-50k)
Percentage of individuals using paid preparers for their 2012 taxes: 32.0%
Here:
32%
State:
47%
(% for various income ranges: 25.3% for AGIs below $25k, 29.8% for AGIs $25k-50k, 34.5% for AGIs $50k-75k, 36.8% for AGIs $75k-100k, 52.4% for AGIs $100k-200k, 75.0% for AGIs over 200k)
Averages for the 2004 tax year for zip code 97227, filed in 2005:
Average Adjusted Gross Income (AGI) in 2004: $31,705 (Individual Income Tax Returns)
Here:
$31,705
State:
$46,788
Salary/wage: $28,557 (reported on 88.1% of returns)
Here:
$28,557
State:
$39,788
(% of AGI for various income ranges: 120.7% for AGIs below $10k, 86.5% for AGIs $10k-25k, 85.0% for AGIs $25k-50k, 89.5% for AGIs $50k-75k, 84.6% for AGIs $75k-100k, 53.7% for AGIs over 100k)
Taxable interest for individuals: $894 (reported on 29.3% of returns)
This zip code:
$894
Oregon:
$2,126
(% of AGI for various income ranges: 1.4% for AGIs below $10k, 1.3% for AGIs $10k-25k, 0.7% for AGIs $25k-50k, 0.3% for AGIs $50k-75k, 0.3% for AGIs $75k-100k, 1.1% for AGIs over 100k)
Taxable dividends: $1,124 (reported on 17.2% of returns)
Here:
$1,124
State:
$3,427
(% of AGI for various income ranges: 1.9% for AGIs below $10k, 0.6% for AGIs $10k-25k, 0.8% for AGIs $25k-50k, 0.4% for AGIs $50k-75k, 0.3% for AGIs $75k-100k, 0.6% for AGIs over 100k)
Net capital gain/loss: +$4,781 (reported on 13.9% of returns)
Here:
+$4,781
State:
+$12,447
(% of AGI for various income ranges: -2.4% for AGIs below $10k, -0.2% for AGIs $10k-25k, 0.9% for AGIs $25k-50k, -0.0% for AGIs $50k-75k, -0.3% for AGIs $75k-100k, 8.1% for AGIs over 100k)
Profit/loss from business: +$6,293 (reported on 15.5% of returns)
Here:
+$6,293
State:
+$11,682
(% of AGI for various income ranges: 13.3% for AGIs below $10k, 5.4% for AGIs $10k-25k, 4.2% for AGIs $25k-50k, 1.1% for AGIs $50k-75k, 3.1% for AGIs $75k-100k, 0.4% for AGIs over 100k)
IRA payment deduction: $2,394 (reported on 2.3% of returns)
97227:
$2,394
Oregon:
$3,035
Total itemized deductions: $16,648 (25% of AGI, reported on 30.2% of returns)
Here:
$16,648
State:
$20,209
Here:
25.4% of AGI
State:
24.7% of AGI
(% of AGI for various income ranges: 16.0% for AGIs below $10k, 8.4% for AGIs $10k-25k, 15.4% for AGIs $25k-50k, 20.8% for AGIs $50k-75k, 21.0% for AGIs $75k-100k, 15.9% for AGIs over 100k)
Charity contributions deductions: $2,147 (3% of AGI, reported on 24.8% of returns)
Here:
$2,147
State:
$3,145
Here:
3.1% of AGI
State:
3.6% of AGI
(% of AGI for various income ranges: 0.9% for AGIs below $10k, 0.7% for AGIs $10k-25k, 1.7% for AGIs $25k-50k, 2.1% for AGIs $50k-75k, 2.1% for AGIs $75k-100k, 1.9% for AGIs over 100k)
Total tax: $4,729 (reported on 71.2% of returns)
97227:
$4,729
State:
$7,148
(% of AGI for various income ranges: 3.4% for AGIs below $10k, 5.0% for AGIs $10k-25k, 7.6% for AGIs $25k-50k, 9.4% for AGIs $50k-75k, 12.2% for AGIs $75k-100k, 18.6% for AGIs over 100k)
Earned income credit: $1,226 (reported on 23.2% of returns)
Here:
$1,226
State:
$1,605
Percentage of individuals using paid preparers for their 2004 taxes: 42.0%
Here:
42%
State:
53%
(% for various income ranges: 41.8% for AGIs below $10k, 37.4% for AGIs $10k-25k, 42.9% for AGIs $25k-50k, 39.7% for AGIs $50k-75k, 44.4% for AGIs $75k-100k, 76.6% for AGIs over 100k)
Likely homosexual households (counted as self-reported same-sex unmarried-partner households)
Lesbian couples: 0.4% of all households
Gay men: 0.0% of all households
Household received Food Stamps/SNAP in the past 12 months: 397 Household did not receive Food Stamps/SNAP in the past 12 months: 2,997
Women who had a birth in the past 12 months: 4 (4 now married, 0 unmarried) Women who did not have a birth in the past 12 months: 2,528 (300 now married, 2,277 unmarried)
Housing units in zip code 97227 with a mortgage: 687 (73 second mortgage, 77 both second mortgage and home equity loan) Houses without a mortgage: 10
Median monthly owner costs for units with a mortgage: $2,059 Median monthly owner costs for units without a mortgage: $722
Residents with income below the poverty level in 2022:
This zip code:
13.0%
Whole state:
12.1%
Residents with income below 50% of the poverty level in 2022:
This zip code:
4.4%
Whole state:
6.2%
Median number of rooms in houses and condos:
Here:
5.8
State:
6.2
Median number of rooms in apartments:
Here:
2.1
State:
4.0
Notable locations in this zip code not listed on our city pages
Notable locations in zip code 97227: Memorial Coliseum (A), Albina Yard (B), Rose Quarter Transit Center (C), Rose Garden Arena (D), Overlook Triangle (E), Albinia-Mississippi Max Station (F), Interstate-Rose Garden Max Station (G), Overlook Park Max Station (H), Polish Library Association Hall (I), Rose Quarter Center and Max Station (J), The Rose Garden Arena (K), American Red Cross Oregon Trail Chapter Headquarters (L), American Red Cross Oregon Trail Chapter Donor Center (M), Legacy Emanual Medical Center Blood Bank (N), Rose Garden Arena (O). Display/hide their locations on the map
Churches in zip code 97227 include: Vancouver Avenue First Baptist Church (A), Fellowship Missionary Baptist Church (B), Saint Stanislaus Polish Catholic Church (C). Display/hide their locations on the map
Parks in zip code 97227 include: Overlook City Park (1), Dawson City Park (2), Lillis Albina City Park (3), DeNorval Unthank City Park (4). Display/hide their locations on the map
149 married couples with children.
170 single-parent households (31 men, 139 women).
88.6% of residents of 97227 zip code speak English at home.
6.2% of residents speak Spanish at home (64% very well, 4% well, 32% not well).
1.8% of residents speak other Indo-European language at home (100% very well).
2.0% of residents speak Asian or Pacific Island language at home (72% very well, 28% well).
0.3% of residents speak other language at home (100% very well).
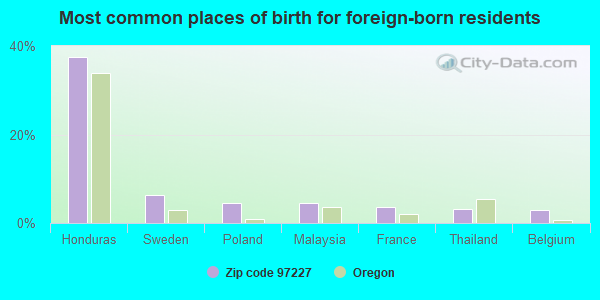
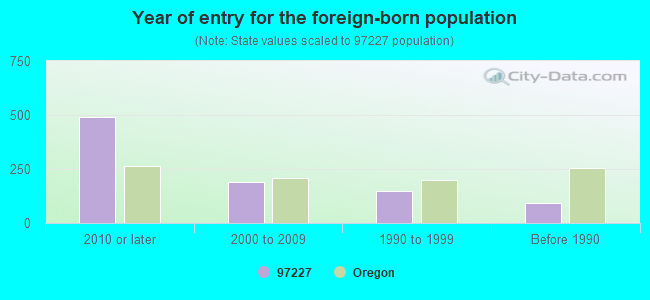
Foreign born population: 745 (12.0%) (25.2% of them are naturalized citizens)
Major facilities with environmental interests located in this zip code:
CARGILL INCORPORATED (800 NORTH RIVER STREET in PORTLAND, OR) . Federal Facility. DEPARTMENT OF AGRICULTURE
COMPLIANCE ACTIVITY (Tracking inspections of insecticide, fungicide, and rodenticide, and toxic substances) STATE MASTER (Oregon inspections and permits database) - OR-HWMS-2839, CESQG STATE MASTER (Oregon inspections and permits database) - OR-SIS-111356-16996, NPDES STORMWATER PERMIT STATE MASTER (Oregon inspections and permits database) - OR-ACSIS-262003, AIR PROGRAM, OR-HWMS-4768, CESQG, ACSIS-262003-, AIR PROGRAM Conditionally Exempt Small Quantity Generators, less than 100 kg/month of hazardous waste (Resource Conservation and Recovery Act (tracking hazardous waste)) - notification Conditionally Exempt Small Quantity Generators, less than 100 kg/month of hazardous waste (Resource Conservation and Recovery Act (tracking hazardous waste)) - notification Conditionally Exempt Small Quantity Generators, less than 100 kg/month of hazardous waste (Resource Conservation and Recovery Act (tracking hazardous waste)) - notification Business SIC classification: MARINE CARGO HANDLING; GRAIN AND FIELD BEANS Organizations: CLD PACIFIC GRAIN LLC (CONTACT/ HAZARDOUS WASTE)
, CARGILL, INCORPORATED (CONTACT/ HAZARDOUS WASTE)
, USDA FEDERAL GRAIN INSPECTION SERVICE (CONTACT/ HAZARDOUS WASTE)
, USDA FED GRAIN INSPECTION SERVICE (CONTACT/ HAZARDOUS WASTE)
, MID COLUMBIA PRODUCERS, INC. (CONTACT/GENERAL)
, CARGILL, INCORPORATED (CONTACT/GENERAL)
, CLD PACIFIC GRAIN LLC (CONTACT/OPERATOR)
, BUNGE CORP (CONTACT/OWNER)
, USDA FED GRAIN INSPECTION SERVICE (CONTACT/OWNER)
, CLD PACIFIC GRAIN, LLC (CONTACT/OWNER)
, CLD PACIFIC GRAIN LLC (CONTACT/OWNER)
, USDA FED GRAIN INSPECTION SERVICE (HAZARDOUS WASTE LEGAL OWNER)
, CLD PACIFIC GRAIN LLC (HAZARDOUS WASTE OPERATOR)
, BUNGE CORP/DBA USDA FEDERAL GRAIN INSPEC (HAZARDOUS WASTE OPERATOR)
, CLD PACIFIC GRAIN LLC (HAZARDOUS WASTE SITE CONTACT)
, CARGILL, INCORPORATED (HAZARDOUS WASTE SITE CONTACT)
, USDA FEDERAL GRAIN INSPECTION SERVICE (HAZARDOUS WASTE SITE CONTACT)
, BUNGE CORP USDA FEDERAL GRAIN INSPECTION (HAZARDOUS WASTE SITE CONTACT)
Alternative names: BUNGE CORPORATION, BUNGE CORP ELEVATOR, BUNGE ELEVATOR RAILROAD CARS, CARGILL INC IRVING ELEVATOR, CARGILL INC IRVING ELEVATOR, CLD PACIFIC GRAIN, LLC, USDA FEDERAL GRAIN INSPECTION SERVICE, USDA FGIS AT BUNGE CORP
EMANUEL HOSPITAL AND HEALTH CENTER (2801 GANTENBEIN AVENUE in PORTLAND, OR)
STATE MASTER (Oregon inspections and permits database) - OR-LUST-26-02-5933, LEAKING STORAGE TANK STATE MASTER (Oregon inspections and permits database) - OR-ACSIS-261803, AIR PROGRAM, ACSIS-261803-, STATE MASTER (Oregon inspections and permits database) - OR-LUST-26-94-0227, LEAKING STORAGE TANK, OR-LUST-26-96-0585, OR-LUST-26-99-0021, OR-UST-BBCAA, OR-UST-BEGGE, OR-UST-BEHJC, OR-HWMS-3243, CESQG Conditionally Exempt Small Quantity Generators, less than 100 kg/month of hazardous waste (Resource Conservation and Recovery Act (tracking hazardous waste)) - notification Business SIC classification: STEAM AND AIR-CONDITIONING SUPPLY; GENERAL MEDICAL AND SURGICAL HOSPITALS Organizations: LEGACY HEALTH SYSTEM (CONTACT/ HAZARDOUS WASTE)
, LIFE FLIGHT NETWORK (CONTACT/GENERAL)
, LEGACY EMANUEL HOSPITAL (CONTACT/GENERAL)
, EMANUAL HOSPITAL (CONTACT/GENERAL)
, PEERLESS (CONTACT/GENERAL)
, LEGACY EMANUEL HOSPITAL (CONTACT/GENERAL)
, EMANUAL HOSPITAL (CONTACT/GENERAL)
, LIFE FLIGHT NETWORK (CONTACT/GENERAL)
, LEGACY HEALTH SYSTEM (CONTACT/GENERAL)
, EMANUEL HOSPITAL& HEALTH CENTER (CONTACT/OWNER)
, EMANUEL HOSPITAL & HEALTH CENTER (CONTACT/OWNER)
, LEGACY HEALTH SYSTEM (CONTACT/OWNER)
, LEGACY EMANUEL HOSPITAL (CONTACT/PERMIT)
, EMANUEL HOSPITAL & HEALTH CENTER (HAZARDOUS WASTE LAND OWNER)
, LEGACY HEALTH SYSTEM (HAZARDOUS WASTE LEGAL OWNER)
Alternative names: LEGACY EMANUEL HOSPITAL
EBONY IRON WORKS INC (614 N TILLAMOOK in PORTLAND, OR)
STATE MASTER (Oregon inspections and permits database) - HWMS-6578-, CESQG STATE MASTER (Oregon inspections and permits database) - OR-HWMS-6578, CESQG Conditionally Exempt Small Quantity Generators, less than 100 kg/month of hazardous waste (Resource Conservation and Recovery Act (tracking hazardous waste)) Business SIC classification: FABRICATED STRUCTURAL METAL; MISCELLANEOUS STRUCTURAL METALWORK; FABRICATED METAL PRODUCTS Business NAICS classification: CUSTOM ROLL FORMING.; CUSTOM ROLL FORMING.; POWDER METALLURGY PART MANUFACTURING.; POWDER METALLURGY PART MANUFACTURING.; FABRICATED STRUCTURAL METAL MANUFACTURING.; FABRICATED STRUCTURAL METAL MANUFACTURING.; FABRICATED STRUCTURAL METAL MANUFACTURING.; METAL WINDOW AND DOOR MANUFACTURING.; METAL WINDOW AND DOOR MANUFACTURING.; ORNAMENTAL AND ARCHITECTURAL METAL WORK MANUFACTURING.; ORNAMENTAL AND ARCHITECTURAL METAL WORK MANUFACTURING.; OTHER METAL CONTAINER MANUFACTURING.; OTHER METAL CONTAINER MANUFACTURING.; OTHER METAL VALVE AND PIPE FITTING MANUFACTURING.; OTHER METAL VALVE AND PIPE FITTING MANUFACTURING.; ALL OTHER MISCELLANEOUS FABRICATED METAL PRODUCT MANUFACTURING.; ALL OTHER MISCELLANEOUS FABRICATED METAL PRODUCT MANUFACTURING.; ALL OTHER MISCELLANEOUS FABRICATED METAL PRODUCT MANUFACTURING.; SHOWCASE, PARTITION, SHELVING, AND LOCKER MANUFACTURING.; SHOWCASE, PARTITION, SHELVING, AND LOCKER MANUFACTURING. Organizations: PORTLAND CITY OF (CONTACT/OPERATOR)
, BUREAU OF WATER WORKS (HAZARDOUS WASTE LAND OWNER)
Alternative names: EBONY IRONWORKS
CUTTING EDGE CUSTOM CABINETS INC (3901 N WILLIAMS AVE in PORTLAND, OR)
STATE MASTER (Oregon inspections and permits database) - OR-HWMS-2988, CESQG (Resource Conservation and Recovery Act (tracking hazardous waste)) Business SIC classification: WOOD KITCHEN CABINETS Organizations: MARKET CONTRACTORS LTD (CONTACT/ HAZARDOUS WASTE)
, CUTTING EDGE CUSTOM CABINETS, INC. (CONTACT/OPERATOR)
, MARKET CONTRACTORS LTD (HAZARDOUS WASTE OPERATOR)
Alternative names: MARKET CONTRACTORS LTD
AMERICAN RED CROSS (3131 N VANCOUVER AVE in PORTLAND, OR)
STATE MASTER (Oregon inspections and permits database) - OR-UST-BCHAA, LEAKING STORAGE TANK, OR-HWMS-2688, CESQG Conditionally Exempt Small Quantity Generators, less than 100 kg/month of hazardous waste (Resource Conservation and Recovery Act (tracking hazardous waste)) - notification Business SIC and NAICS classification: MEDICAL LABORATORIES Organizations: AMERICAN RED CROSS DISASTER SERVICES (CONTACT/OWNER)
, AMERICAN RED CROSS DISASTER SERVICES (HAZARDOUS WASTE LEGAL OWNER)
FOUCH ELECTRIC MFG (2138 N INTERSTATE AVE in PORTLAND, OR)
STATE MASTER (Oregon inspections and permits database) - OR-HWMS-2422, CESQG Conditionally Exempt Small Quantity Generators, less than 100 kg/month of hazardous waste (Resource Conservation and Recovery Act (tracking hazardous waste)) - notification Business SIC classification: ELECTRICAL MACHINERY, EQUIPMENT, AND SUPPLIES Business NAICS classification: OTHER COMMERCIAL AND SERVICE INDUSTRY MACHINERY MANUFACTURING.; OTHER ENGINE EQUIPMENT MANUFACTURING.; WELDING AND SOLDERING EQUIPMENT MANUFACTURING.; OTHER LIGHTING EQUIPMENT MANUFACTURING.; ALL OTHER MISCELLANEOUS ELECTRICAL EQUIPMENT AND COMPONENT MANUFACTURING.; ALL OTHER MISCELLANEOUS ELECTRICAL EQUIPMENT AND COMPONENT MANUFACTURING. Organizations: FOUCH ELECTRIC MANUFACTURING (CONTACT/ HAZARDOUS WASTE)
, FOSTER BOMBARDIER (HAZARDOUS WASTE LAND OWNER)
, FOUCH ELECTRIC MANUFACTURING (HAZARDOUS WASTE LEGAL OWNER)
ARMSTRONG DEVELOPMENT INC (2256 N ALBINA AVE STE 1 in PORTLAND, OR)
STATE MASTER (Oregon inspections and permits database) - HWMS-1306-, CESQG (Resource Conservation and Recovery Act (tracking hazardous waste)) Business SIC classification: GENERAL CONTRACTORS-NONRESIDENTIAL BUILDINGS, OTHER THAN INDUSTRIAL BUILDINGS AND WAREHOUSES Organizations: ADI (CONTACT/ HAZARDOUS WASTE)
, WAYNE ARMSTRONG (CONTACT/OPERATOR)
, NORTH INTERSTATE LLC (HAZARDOUS WASTE LAND OWNER)
, ADI (HAZARDOUS WASTE SITE CONTACT)
BLESSING ELECTRIC INC (829 N RUSSELL in PORTLAND, OR)
STATE MASTER (Oregon inspections and permits database) - OR-HWMS-5777, CESQG Conditionally Exempt Small Quantity Generators, less than 100 kg/month of hazardous waste (Resource Conservation and Recovery Act (tracking hazardous waste)) - notification Business SIC classification: ELECTRICAL WORK
GLACIER NORTHWEST INC CEMENT TERMINAL (1050 NORTH RIVER STREET in PORTLAND, OR)
STATE MASTER (Oregon inspections and permits database) - OR-LUST-26-89-0285, LEAKING STORAGE TANK, OR-HWMS-3904, CESQG Conditionally Exempt Small Quantity Generators, less than 100 kg/month of hazardous waste (Resource Conservation and Recovery Act (tracking hazardous waste)) - notification Business SIC classification: BRICK, STONE, AND RELATED CONSTRUCTION MATERIALS Organizations: LONESTAR NORTHWEST-RIVER STREET (CONTACT/GENERAL)
Alternative names: LONESTAR NORTHWEST
ACTION MACHINERY CO (2303 N RANDOLPH AVE in PORTLAND, OR)
STATE MASTER (Oregon inspections and permits database) - OR-HWMS-2934, LQG (Resource Conservation and Recovery Act (tracking hazardous waste))
GLACIER NORTHWEST INC (931 N RIVER STREET in PORTLAND, OR)
STATE MASTER (Oregon inspections and permits database) - OR-SIS-44571-10389, NPDES NON-MAJOR National Pollutant Discharge Elimination System NON-MAJOR (Tracking pollutant discharge elimination systems) - permit Business SIC classification: MARINE CARGO HANDLING
BOISE ELEM. SCHOOL (620 N FREMONT in PORTLAND, OR)
(National Center for Education Statistics) - STATE ID-833 Organizations: PORTLAND SCH DIST 1J (SCHOOL DISTRICT)
ARCHITECTURAL REPRODUCTIONS IN (525 N TILLAMOOK ST in PORTLAND, OR)
(Resource Conservation and Recovery Act (tracking hazardous waste)) Organizations: ARCHITECTURAL REPRODUCTIONS INC (CONTACT/OPERATOR)
Alternative names: ARCHITECTURAL REPRODUCTIONS INC
Housing units lacking complete plumbing facilities: 0.3% Housing units lacking complete kitchen facilities: 1.5%
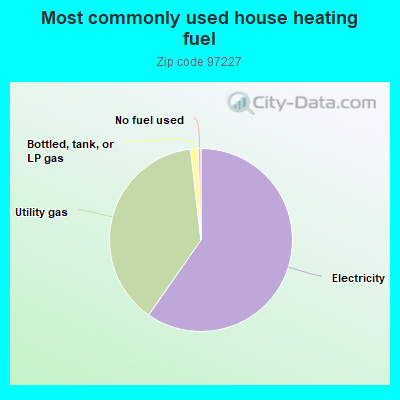
59.6%Electricity
38.4%Utility gas
1.3%Bottled, tank, or LP gas
0.5%No fuel used
Population in 1990: 3,171. Population change in the 1990s: +348 (+11.0%).
Place of birth for U.S.-born residents:
This state: 1,274
Northeast: 341
Midwest: 964
South: 794
West: 1,979
44% of the 97227 zip code residents lived in the same house 5 years ago. Out of people who lived in different houses, 70% lived in this county. Out of people who lived in different counties, 50% lived in Oregon.
72% of the 97227 zip code residents lived in the same house 1 year ago. Out of people who lived in different houses, 54% moved from this county. Out of people who lived in different houses, 12% moved from different county within same state. Out of people who lived in different houses, 23% moved from different state. Out of people who lived in different houses, 6% moved from abroad.
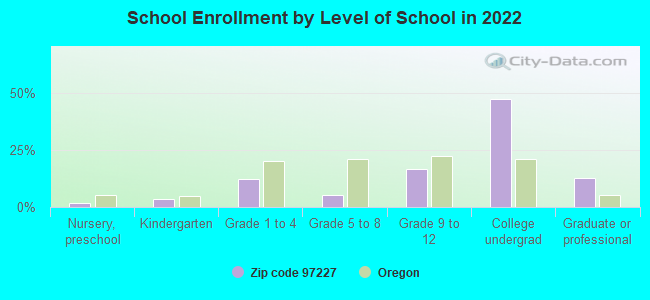
Private vs. public school enrollment:
Students in private schools in grades 1 to 8 (elementary and middle school):
Here:
0.0%
Oregon:
13.7%
Students in private schools in grades 9 to 12 (high school): 47
Here:
40.7%
Oregon:
8.8%
Students in private undergraduate colleges: 60
Here:
17.0%
Oregon:
17.7%
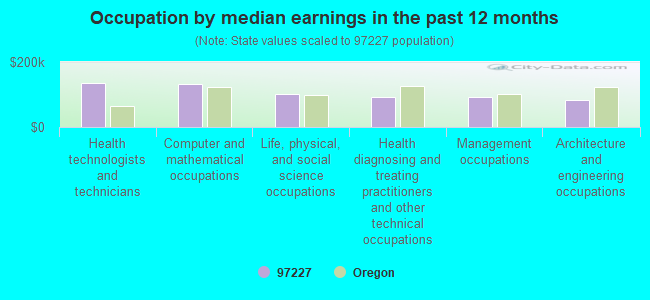
Occupation by median earnings in the past 12 months ($)
136,234Health technologists and technicians
132,462Computer and mathematical occupations
103,607Life, physical, and social science occupations
94,183Health diagnosing and treating practitioners and other technical occupations
91,976Management occupations
82,370Architecture and engineering occupations
Companies with federal contracts located in this zip code (PORTLAND, OR):
CALHOUN & DE JONG INC (3907 N INTERSTATE AVE; small business) : $505,579 in 35 contractsfrom 2000 to 2006
Contracts for Non-nuclear Ship Repair (West) Ship repair (including overhauls and conversions) performed on. non-nuclear propelled and nonpropelled ships west of the 108th meridian, Centrifugals, Separators, and Pressure and Vacuum Filters, Hose, Pipe, Tube, Lubrication, and Railing Fittings, Minerals, Natural and Synthetic, and moreby Navy, Bureau of Reclamation, Army Signed by year:2000: $35,686; 2001: $96,731; 2002: $176,344; 2003: $100,242; 2004: $53,186; 2005: $30,085; 2006: $13,305.
Biggest contracts:
$55,408 with Navy for Non-nuclear Ship Repair (West) Ship repair (including overhauls and conversions) performed on. non-nuclear propelled and nonpropelled ships west of the 108th meridian. Taking place in CA. Signed on 2001-12-21. Completion date: 2002-04-30.
$41,323, same as above.Signed on 2001-12-06. Completion date: 2002-01-21.
$40,000, same as above.Signed on 2002-03-21. Completion date: 2002-03-15.
$37,488 with Navy for Non-nuclear Ship Repair (West) Ship repair (including overhauls and conversions) performed on. non-nuclear propelled and nonpropelled ships west of the 108th meridian. Signed on 2004-04-15. Completion date: 2004-06-08.
THE PORT CITY DEVELOPMENT CENT (2124 N WILLIAMS AVE) : $449,954 in 13 contractsfrom 2001 to 2005
Contracts for Custodial Janitorial Services, Food Services, Other Social Services by Army Signed by year:2000: $0; 2001: $59,921; 2002: $63,002; 2003: $60,961; 2004: $76,213; 2005: $189,857; 2006: $0.
Biggest contracts:
$103,897 with Army for Custodial Janitorial Services. Signed on 2005-10-28. Completion date: 2005-09-30.
$81,017, same as above.Signed on 2005-08-02. Completion date: 2005-09-30.
$75,681, same as above.Signed on 2004-10-21. Completion date: 2005-09-30.
$60,961, same as above.Signed on 2003-10-29. Completion date: 2004-09-30.
TARR ACQUISITION, LLC (2429 N BORTHWICK AVE; small business) : $79,428 in 3 contractsfrom 2004 to 2006
$35,500 with Army for Oils and Greases: Cutting, Lubricating, and Hydraulic. Signed on 2006-06-06. Completion date: 2006-06-26.
$21,964, same as above.Signed on 2004-10-26. Completion date: 2004-11-15.
$21,964 with U.S. Army Corps of Engineers - civil program financing only for Oils and Greases: Cutting, Lubricating, and Hydraulic. Signed on 2004-10-26. Completion date: 2004-11-15.
TECHNICAL CONTROLS, INC (1931 N WILLIAMS AVE; small business) : $33,437 in 6 contractsin 2005
Contracts for Hose and Flexible Tubing, Valves, Nonpowered, Hose, Pipe, Tube, Lubrication, and Railing Fittings by Navy, Defense Logistics Agency Signed by year:2000: $0; 2001: $0; 2002: $0; 2003: $0; 2004: $0; 2005: $33,437; 2006: $0.
Biggest contracts:
$9,795 with Navy for Hose and Flexible Tubing. Signed on 2005-09-22. Completion date: 2005-10-06.
$6,954 with Navy for Valves, Nonpowered. Signed on 2005-07-01. Completion date: 2005-09-01.
$6,840, same as above.Signed on 2005-08-04. Completion date: 2005-09-30.
$4,410 with Navy for Hose, Pipe, Tube, Lubrication, and Railing Fittings. Signed on 2005-09-22. Completion date: 2005-10-20.
HUSER SALES & SERVICE, INC (231 N TILLAMOOK ST; small business) : $19,828 in 2 contractsfrom 2002 to 2003
$13,018 with U.S. Army Corps of Engineers - civil program financing only for Valves, Nonpowered. Signed on 2003-08-11. Completion date: 2003-09-18.
$6,810, same as above.Signed on 2002-02-26. Completion date: 2002-03-18.
EVANS COMPONENTS, INC (2004 N VANCOUVER AVE; small business) : $19,725 in 8 contractsfrom 2004 to 2005
Contracts for Hose and Flexible Tubing, Valves, Nonpowered, Pressure, Temperature, and Humidity Measuring and Controlling Instruments, Hose, Pipe, Tube, Lubrication, and Railing Fittings by Defense Logistics Agency Signed by year:2000: $0; 2001: $0; 2002: $0; 2003: $0; 2004: $14,279; 2005: $5,446; 2006: $0.
Biggest contracts:
$4,962 with Defense Logistics Agency for Hose and Flexible Tubing. Taking place in NY. Signed on 2004-12-29. Completion date: 2005-01-31.
$3,503 with Defense Logistics Agency for Valves, Nonpowered. Taking place in NY. Signed on 2004-11-09. Completion date: 2004-12-10.
$3,335 with Defense Logistics Agency for Valves, Nonpowered. Signed on 2005-02-07. Completion date: 2005-03-09.
$3,253 with Defense Logistics Agency for Valves, Nonpowered. Taking place in FL. Signed on 2004-12-07. Completion date: 2005-01-07.
HILLCORE MACHINE, INC (646 N THOMPSON ST; small business) : $10,506 in 2 contractsfrom 2005 to 2006
$9,300 with Army for Bushings, Rings, Shims, and Spacers. Signed on 2006-03-14. Completion date: 2006-08-15.
$1,206 with Army for Nails, Machine Keys, and Pins. Signed on 2005-12-15. Completion date: 2006-05-17.
Top industries in this zip code by the number of employees in 2005:
Health Care and Social Assistance: General Medical and Surgical Hospitals (over 1000 employees: 1 establishment)
Health Care and Social Assistance: Blood and Organ Banks (500-999: 1)
Health Care and Social Assistance: Offices of Physicians (except Mental Health Specialists) (50-99: 1, 20-49: 8, 10-19: 8, 5-9: 8, 1-4: 17)
Accommodation and Food Services: Food Service Contractors (250-499: 1, 100-249: 1)
Health Care and Social Assistance: HMO Medical Centers (250-499: 1, 50-99: 1)
Arts, Entertainment, and Recreation: Sports Teams and Clubs (250-499: 1, 20-49: 1, 1-4: 1)
Health Care and Social Assistance: Freestanding Ambulatory Surgical and Emergency Centers (250-499: 1, 20-49: 1)
Management of Companies and Enterprises: Corporate, Subsidiary, and Regional Managing Offices (250-499: 1, 10-19: 1, 1-4: 1)
Professional, Scientific, and Technical Services: Research and Development in the Physical, Engineering, and Life Sciences (250-499: 1, 10-19: 1, 1-4: 1)
Health Care and Social Assistance: Child and Youth Services (100-249: 1, 20-49: 1)
People in group quarters in 2010:
115 people in residential treatment centers for adults
14 people in hospitals with patients who have no usual home elsewhere
14 people in other noninstitutional facilities
7 people in emergency and transitional shelters (with sleeping facilities) for people experiencing homelessness
People in group quarters in 2000:
35 people in crews of maritime vessels
35 people in other noninstitutional group quarters
32 people in hospitals or wards for drug/alcohol abuse
11 people in other group homes
Fatal accident statistics in 2014:
Fatal accident count: 1
Vehicles involved in fatal accidents: 1
Fatal accidents caused by drunken drivers: 1
Fatalities: 1
Persons involved in fatal accidents: 1
Pedestrians involved in fatal accidents: 0
Fatal accident statistics in 2013:
Fatal accident count: 2
Vehicles involved in fatal accidents: 2
Fatal accidents caused by drunken drivers: 1
Fatalities: 2
Persons involved in fatal accidents: 2
Pedestrians involved in fatal accidents: 1
Home Mortgage Disclosure Act Aggregated Statistics For Year 2009 (Based on 2 full and 6 partial tracts)
A) FHA, FSA/RHS & VA Home Purchase Loans
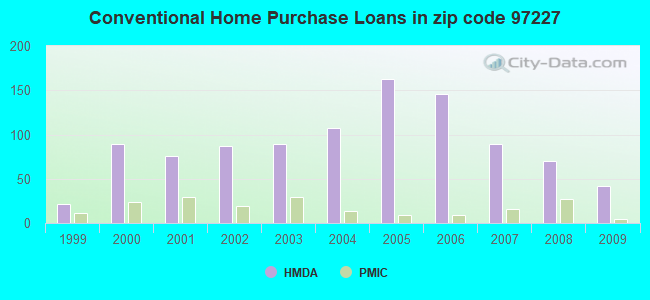
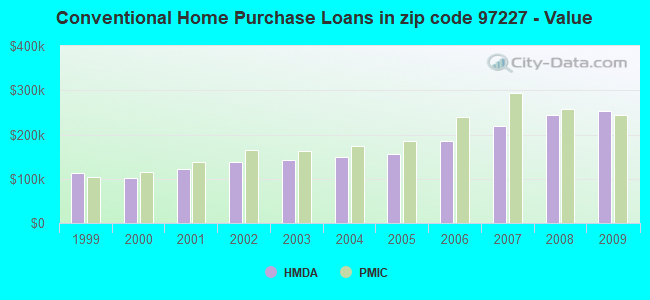
B) Conventional Home Purchase Loans
C) Refinancings
D) Home Improvement Loans
E) Loans on Dwellings For 5+ Families
F) Non-occupant Loans on < 5 Family Dwellings (A B C & D)
Number
Average Value
Number
Average Value
Number
Average Value
Number
Average Value
Number
Average Value
Number
Average Value
LOANS ORIGINATED
33
$271,035
42
$253,635
186
$233,703
3
$165,720
2
$841,450
24
$255,023
APPLICATIONS APPROVED, NOT ACCEPTED
0
$0
8
$221,445
19
$224,967
1
$8,400
0
$0
6
$213,240
APPLICATIONS DENIED
6
$198,547
4
$225,050
58
$233,501
9
$121,078
0
$0
6
$203,310
APPLICATIONS WITHDRAWN
5
$260,990
12
$221,564
36
$235,329
2
$149,370
0
$0
6
$182,958
FILES CLOSED FOR INCOMPLETENESS
1
$214,200
3
$252,933
10
$183,720
1
$126,470
0
$0
1
$126,470
Aggregated Statistics For Year 2008 (Based on 2 full and 6 partial tracts)
A) FHA, FSA/RHS & VA Home Purchase Loans
B) Conventional Home Purchase Loans
C) Refinancings
D) Home Improvement Loans
F) Non-occupant Loans on < 5 Family Dwellings (A B C & D)
Number
Average Value
Number
Average Value
Number
Average Value
Number
Average Value
Number
Average Value
LOANS ORIGINATED
10
$273,322
70
$243,127
94
$236,070
7
$154,609
38
$232,204
APPLICATIONS APPROVED, NOT ACCEPTED
2
$235,010
7
$285,410
19
$293,906
2
$353,790
4
$262,815
APPLICATIONS DENIED
3
$366,810
11
$280,174
43
$249,757
8
$126,618
18
$283,071
APPLICATIONS WITHDRAWN
1
$151,360
7
$228,296
25
$236,956
3
$56,500
4
$190,568
FILES CLOSED FOR INCOMPLETENESS
0
$0
1
$157,080
8
$264,738
2
$125,390
4
$224,900
Aggregated Statistics For Year 2007 (Based on 2 full and 6 partial tracts)
B) Conventional Home Purchase Loans
C) Refinancings
D) Home Improvement Loans
E) Loans on Dwellings For 5+ Families
F) Non-occupant Loans on < 5 Family Dwellings (A B C & D)
Number
Average Value
Number
Average Value
Number
Average Value
Number
Average Value
Number
Average Value
LOANS ORIGINATED
89
$219,142
116
$211,254
17
$3,668,404
1
$477,980
37
$193,951
APPLICATIONS APPROVED, NOT ACCEPTED
14
$187,112
19
$212,885
7
$26,956
0
$0
7
$171,233
APPLICATIONS DENIED
27
$202,137
46
$213,276
19
$71,928
1
$199,160
14
$207,801
APPLICATIONS WITHDRAWN
17
$221,077
28
$179,844
5
$112,110
0
$0
7
$174,673
FILES CLOSED FOR INCOMPLETENESS
0
$0
7
$198,139
0
$0
0
$0
3
$162,980
Aggregated Statistics For Year 2006 (Based on 2 full and 6 partial tracts)
A) FHA, FSA/RHS & VA Home Purchase Loans
B) Conventional Home Purchase Loans
C) Refinancings
D) Home Improvement Loans
E) Loans on Dwellings For 5+ Families
F) Non-occupant Loans on < 5 Family Dwellings (A B C & D)
G) Loans On Manufactured Home Dwelling (A B C & D)
Number
Average Value
Number
Average Value
Number
Average Value
Number
Average Value
Number
Average Value
Number
Average Value
Number
Average Value
LOANS ORIGINATED
1
$254,920
146
$185,527
157
$194,922
21
$91,104
1
$278,880
65
$197,724
1
$160,320
APPLICATIONS APPROVED, NOT ACCEPTED
0
$0
17
$151,568
32
$188,053
2
$92,215
0
$0
6
$133,067
0
$0
APPLICATIONS DENIED
0
$0
30
$159,670
72
$167,401
11
$84,892
0
$0
16
$171,899
0
$0
APPLICATIONS WITHDRAWN
0
$0
18
$152,462
41
$169,637
6
$147,102
0
$0
6
$155,292
0
$0
FILES CLOSED FOR INCOMPLETENESS
0
$0
0
$0
14
$215,119
5
$98,860
0
$0
3
$209,227
0
$0
Aggregated Statistics For Year 2005 (Based on 2 full and 6 partial tracts)
A) FHA, FSA/RHS & VA Home Purchase Loans
B) Conventional Home Purchase Loans
C) Refinancings
D) Home Improvement Loans
F) Non-occupant Loans on < 5 Family Dwellings (A B C & D)
G) Loans On Manufactured Home Dwelling (A B C & D)
Number
Average Value
Number
Average Value
Number
Average Value
Number
Average Value
Number
Average Value
Number
Average Value
LOANS ORIGINATED
0
$0
163
$155,083
171
$169,189
15
$135,493
91
$161,795
1
$133,440
APPLICATIONS APPROVED, NOT ACCEPTED
0
$0
17
$159,533
30
$147,933
3
$49,790
15
$128,930
1
$109,310
APPLICATIONS DENIED
1
$156,340
18
$113,086
67
$146,535
15
$86,299
25
$146,440
0
$0
APPLICATIONS WITHDRAWN
0
$0
14
$185,176
72
$154,534
6
$133,272
14
$142,366
0
$0
FILES CLOSED FOR INCOMPLETENESS
0
$0
4
$185,362
9
$180,914
1
$16,800
2
$159,180
0
$0
Aggregated Statistics For Year 2004 (Based on 2 full and 6 partial tracts)
A) FHA, FSA/RHS & VA Home Purchase Loans
B) Conventional Home Purchase Loans
C) Refinancings
D) Home Improvement Loans
E) Loans on Dwellings For 5+ Families
F) Non-occupant Loans on < 5 Family Dwellings (A B C & D)
G) Loans On Manufactured Home Dwelling (A B C & D)
Number
Average Value
Number
Average Value
Number
Average Value
Number
Average Value
Number
Average Value
Number
Average Value
Number
Average Value
LOANS ORIGINATED
4
$175,102
107
$148,099
174
$140,323
5
$88,570
3
$502,210
55
$149,754
1
$93,610
APPLICATIONS APPROVED, NOT ACCEPTED
1
$169,290
9
$184,162
31
$142,378
5
$51,720
0
$0
9
$143,993
0
$0
APPLICATIONS DENIED
1
$109,540
11
$153,055
80
$153,460
12
$57,491
0
$0
18
$176,700
0
$0
APPLICATIONS WITHDRAWN
0
$0
15
$160,949
56
$149,265
0
$0
1
$484,950
6
$198,973
0
$0
FILES CLOSED FOR INCOMPLETENESS
0
$0
3
$125,140
10
$124,756
3
$46,617
0
$0
2
$205,205
0
$0
Aggregated Statistics For Year 2003 (Based on 2 full and 6 partial tracts)
A) FHA, FSA/RHS & VA Home Purchase Loans
B) Conventional Home Purchase Loans
C) Refinancings
D) Home Improvement Loans
E) Loans on Dwellings For 5+ Families
F) Non-occupant Loans on < 5 Family Dwellings (A B C & D)
Number
Average Value
Number
Average Value
Number
Average Value
Number
Average Value
Number
Average Value
Number
Average Value
LOANS ORIGINATED
7
$132,367
89
$141,798
310
$132,677
6
$43,340
2
$2,478,340
80
$114,341
APPLICATIONS APPROVED, NOT ACCEPTED
0
$0
17
$134,165
60
$116,783
5
$40,348
0
$0
16
$111,493
APPLICATIONS DENIED
2
$149,870
32
$164,978
99
$131,511
6
$15,662
0
$0
26
$131,398
APPLICATIONS WITHDRAWN
1
$82,320
9
$117,924
75
$130,372
1
$29,870
0
$0
13
$130,358
FILES CLOSED FOR INCOMPLETENESS
1
$128,520
2
$114,120
8
$133,954
1
$77,280
0
$0
1
$199,160
Aggregated Statistics For Year 2002 (Based on 2 full and 6 partial tracts)
A) FHA, FSA/RHS & VA Home Purchase Loans
B) Conventional Home Purchase Loans
C) Refinancings
D) Home Improvement Loans
E) Loans on Dwellings For 5+ Families
F) Non-occupant Loans on < 5 Family Dwellings (A B C & D)
Number
Average Value
Number
Average Value
Number
Average Value
Number
Average Value
Number
Average Value
Number
Average Value
LOANS ORIGINATED
12
$132,954
87
$138,389
227
$127,261
6
$18,347
3
$426,887
58
$117,439
APPLICATIONS APPROVED, NOT ACCEPTED
1
$168,290
10
$120,204
44
$164,255
8
$21,128
0
$0
15
$218,979
APPLICATIONS DENIED
2
$139,020
9
$188,223
70
$114,216
10
$26,043
0
$0
9
$200,263
APPLICATIONS WITHDRAWN
3
$165,080
16
$124,058
46
$114,342
2
$28,880
0
$0
7
$137,320
FILES CLOSED FOR INCOMPLETENESS
1
$92,610
2
$71,200
16
$113,831
0
$0
0
$0
2
$96,400
Aggregated Statistics For Year 2001 (Based on 2 full and 6 partial tracts)
A) FHA, FSA/RHS & VA Home Purchase Loans
B) Conventional Home Purchase Loans
C) Refinancings
D) Home Improvement Loans
E) Loans on Dwellings For 5+ Families
F) Non-occupant Loans on < 5 Family Dwellings (A B C & D)
Number
Average Value
Number
Average Value
Number
Average Value
Number
Average Value
Number
Average Value
Number
Average Value
LOANS ORIGINATED
14
$130,301
76
$122,282
173
$117,418
21
$26,234
1
$170,520
39
$107,211
APPLICATIONS APPROVED, NOT ACCEPTED
1
$126,470
12
$117,808
26
$111,014
4
$24,032
0
$0
8
$144,972
APPLICATIONS DENIED
2
$106,040
12
$106,910
82
$101,682
18
$18,336
0
$0
10
$131,248
APPLICATIONS WITHDRAWN
1
$119,500
10
$96,047
45
$89,835
1
$16,800
0
$0
8
$80,540
FILES CLOSED FOR INCOMPLETENESS
0
$0
2
$208,255
8
$92,746
1
$89,620
0
$0
0
$0
Aggregated Statistics For Year 2000 (Based on 2 full and 6 partial tracts)
A) FHA, FSA/RHS & VA Home Purchase Loans
B) Conventional Home Purchase Loans
C) Refinancings
D) Home Improvement Loans
E) Loans on Dwellings For 5+ Families
F) Non-occupant Loans on < 5 Family Dwellings (A B C & D)
Number
Average Value
Number
Average Value
Number
Average Value
Number
Average Value
Number
Average Value
Number
Average Value
LOANS ORIGINATED
33
$114,691
89
$102,796
79
$99,204
14
$22,791
1
$279,820
40
$90,180
APPLICATIONS APPROVED, NOT ACCEPTED
2
$91,385
11
$97,906
13
$102,874
6
$33,162
0
$0
5
$100,240
APPLICATIONS DENIED
3
$114,940
24
$92,196
63
$93,103
23
$16,441
1
$103,560
22
$105,849
APPLICATIONS WITHDRAWN
3
$117,043
17
$119,715
45
$96,506
2
$64,035
0
$0
8
$108,019
FILES CLOSED FOR INCOMPLETENESS
1
$125,160
5
$89,444
10
$77,058
0
$0
0
$0
1
$144,390
Aggregated Statistics For Year 1999 (Based on 4 partial tracts)
A) FHA, FSA/RHS & VA Home Purchase Loans
B) Conventional Home Purchase Loans
C) Refinancings
D) Home Improvement Loans
F) Non-occupant Loans on < 5 Family Dwellings (A B C & D)
2002 - 2018 National Fire Incident Reporting System (NFIRS) incidents
Based on the data from the years 2002 - 2018 the average number of fires per year is 24. The highest number of reported fires - 61 took place in 2018, and the least - 12 in 2014. The data has a growing trend.
When looking into fire subcategories, the most reports belonged to: Outside Fires (57.8%), and Structure Fires (22.8%).
Fire incident types reported to NFIRS in Zip Code 97227


 Nearest zip codes: 97209, 97208, 97204, 97212, 97232, 97201.
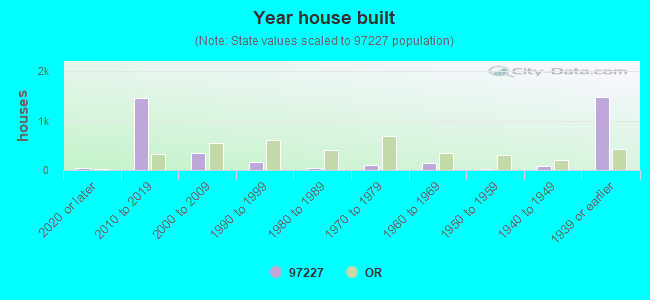


 . Federal Facility. DEPARTMENT OF AGRICULTURE

 Based on the data from the years 2002 - 2018 the average number of fires per year is 24. The highest number of reported fires - 61 took place in 2018, and the least - 12 in 2014. The data has a growing trend.
 When looking into fire subcategories, the most reports belonged to: Outside Fires (57.8%), and Structure Fires (22.8%).