Estimated zip code population in 2022: 1,184 Zip code population in 2010: 1,405 Zip code population in 2000: 1,467
Houses and condos: 442 Renter-occupied apartments: 183
% of renters here:
44%
State:
44%
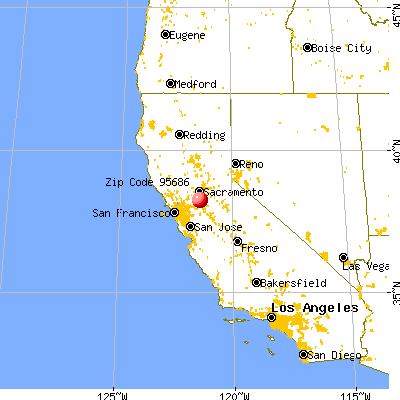
March 2022 cost of living index in zip code 95686: 100.0 (near average, U.S. average is 100)
Land area: 27.3 sq. mi. Water area: 1.2 sq. mi.
Population density: 43 people per square mile
(very low).
OSM Map
General Map
Google Map
MSN Map
OSM Map
General Map
Google Map
MSN Map
OSM Map
General Map
Google Map
MSN Map
OSM Map
General Map
Google Map
MSN Map
Please wait while loading the map...
Real estate property taxes paid for housing units in 2022:
This zip code:
0.5% ($2,018)
California:
0.7% ($4,831)
Median real estate property taxes paid for housing units with mortgages in 2022: $3,434 (0.8%) Median real estate property taxes paid for housing units with no mortgage in 2022: $1,361 (0.5%)
Business Search- 14 Million verified businesses
Males: 618
(52.2%)
Females: 565
(47.8%)
For population 25 years and over in 95686:
High school or higher: 64.8%
Bachelor's degree or higher: 7.9%
Graduate or professional degree: 1.0%
Unemployed: 5.9%
Mean travel time to work (commute): 30.1 minutes
For population 15 years and over in 95686:
Never married: 39.6%
Now married: 42.4%
Separated: 1.9%
Widowed: 3.0%
Divorced: 13.1%
Zip code 95686 compared to state average:
Median household income significantly below state average.
Median house value below state average.
Black race population percentage below state average.
Length of stay since moving in above state average.
Number of college students below state average.
Percentage of population with a bachelor's degree or higher significantly below state average.
Estimated median house/condo value in 2022: $388,299
95686:
$388,299
California:
$715,900
Median resident age:
This zip code:
35.1 years
California median age:
37.9 years
Average household size:
This zip code:
2.8 people
California:
2.8 people
Averages for the 2004 tax year for zip code 95686, filed in 2005:
Average Adjusted Gross Income (AGI) in 2004: $31,038 (Individual Income Tax Returns)
Here:
$31,038
State:
$58,600
Salary/wage: $28,037 (reported on 88.7% of returns)
Here:
$28,037
State:
$49,455
(% of AGI for various income ranges: 137.4% for AGIs below $10k, 86.2% for AGIs $10k-25k, 83.6% for AGIs $25k-50k, 85.7% for AGIs $50k-75k, 65.4% for AGIs $75k-100k, 61.7% for AGIs over 100k)
Taxable interest for individuals: $242 (reported on 30.2% of returns)
This zip code:
$242
California:
$2,365
(% of AGI for various income ranges: 1.4% for AGIs below $10k, 0.2% for AGIs $10k-25k, 0.2% for AGIs $25k-50k, 0.4% for AGIs $50k-75k, 0.3% for AGIs $75k-100k, 0.1% for AGIs over 100k)
Taxable dividends: $385 (reported on 6.1% of returns)
Here:
$385
State:
$4,746
Net capital gain/loss: +$3,909 (reported on 5.2% of returns)
Here:
+$3,909
State:
+$23,418
Profit/loss from business: +$1,129 (reported on 7.3% of returns)
Here:
+$1,129
State:
+$16,826
Total itemized deductions: $19,107 (28% of AGI, reported on 19.8% of returns)
Here:
$19,107
State:
$28,113
Here:
27.5% of AGI
State:
25.3% of AGI
Charity contributions deductions: $1,431 (2% of AGI, reported on 15.3% of returns)
Here:
$1,431
State:
$3,923
Here:
2.2% of AGI
State:
3.3% of AGI
Total tax: $4,012 (reported on 58.0% of returns)
95686:
$4,012
State:
$10,761
(% of AGI for various income ranges: 3.2% for AGIs below $10k, 2.3% for AGIs $10k-25k, 5.1% for AGIs $25k-50k, 7.7% for AGIs $50k-75k, 11.2% for AGIs $75k-100k, 16.6% for AGIs over 100k)
Earned income credit: $1,974 (reported on 27.6% of returns)
Here:
$1,974
State:
$1,763
Percentage of individuals using paid preparers for their 2004 taxes: 73.6%
Here:
74%
State:
66%
(% for various income ranges: 57.1% for AGIs below $10k, 76.7% for AGIs $10k-25k, 81.5% for AGIs $25k-50k, 75.6% for AGIs $50k-75k, 120.0% for AGIs $75k-100k)
Household received Food Stamps/SNAP in the past 12 months: 132 Household did not receive Food Stamps/SNAP in the past 12 months: 297
Women who had a birth in the past 12 months: 10 (10 now married, 0 unmarried) Women who did not have a birth in the past 12 months: 251 (103 now married, 148 unmarried)
Housing units in zip code 95686 with a mortgage: 117 (2 second mortgage, 2 both second mortgage and home equity loan) Houses without a mortgage: 14
Median monthly owner costs for units with a mortgage: $1,650 Median monthly owner costs for units without a mortgage: $622
Residents with income below the poverty level in 2022:
This zip code:
35.7%
Whole state:
12.2%
Residents with income below 50% of the poverty level in 2022:
This zip code:
26.1%
Whole state:
6.2%
Median number of rooms in houses and condos:
Here:
5.1
State:
6.0
Median number of rooms in apartments:
Here:
5.5
State:
3.9
Notable locations in this zip code not listed on our city pages
Notable locations in zip code 95686: Four Corners (A), Thornton Rural Fire Protection District (B), Thornton Branch Stockton-San Joaquin County Public Library (C). Display/hide their locations on the map
In group quarters: 45 (-1 institutionalized population)
Size of family households: 89 2-persons, 37 3-persons, 40 4-persons, 59 5-persons, 21 6-persons, 7 7-or-more-persons
Size of nonfamily households: 117 1-person, 40 2-persons
99 married couples with children.
153 single-parent households (60 men, 93 women).
48.7% of residents of 95686 zip code speak English at home.
48.2% of residents speak Spanish at home (54% very well, 14% well, 18% not well, 14% not at all).
1.2% of residents speak other Indo-European language at home (100% very well).
1.1% of residents speak Asian or Pacific Island language at home (58% well, 42% not well).
Foreign born population: 324 (27.4%) (34.1% of them are naturalized citizens)
This zip code:
27.4%
Whole state:
26.7%
80%Honduras
5%Bahamas
4%Romania
2%El Salvador
2%Sweden
2%United Kingdom, excluding England and Scotland
2%Malaysia
5%Ukrainian
5%English
4%Irish
3%German
1%Barbadian
1%Italian
1%Armenian
Year of entry for the foreign-born population
972010 or later
882000 to 2009
341990 to 1999
134Before 1990
Facilities with environmental interests located in this zip code:
NEW HOPE ELEMENTARY (26675 N. SACRAMENTO BLVD. in THORNTON, CA)
COMPLIANCE ACTIVITY (Tracking inspections of insecticide, fungicide, and rodenticide, and toxic substances) (National Center for Education Statistics) - STATE ID-6042428 Alternative names: NEW HOPE ELEMENTARY SCHOOL, NEW HOPE ELEMENTARY SCHOOL DISTRICT, NEW HOPE ELEMENTARY SD
FRY RANCHES (8450 NEW HOPE RD in THORNTON, CA)
Small Quantity Generators, between 100 kg and 1000 kg of hazardous waste/month (Resource Conservation and Recovery Act (tracking hazardous waste)) - notification Organizations: MARIAM FRY (CONTACT/OWNER)
CERRI & MARAGLIANO FARMS (24015 S BLOSSOM RD in THORNTON, CA)
Small Quantity Generators, between 100 kg and 1000 kg of hazardous waste/month (Resource Conservation and Recovery Act (tracking hazardous waste))
CALIFORNIA CANNERS & GROWERS (GALT RD in THORNTON, CA)
Small Quantity Generators, between 100 kg and 1000 kg of hazardous waste/month (Resource Conservation and Recovery Act (tracking hazardous waste))
M & K MARKET (8960 W. WALNUT GROVE RD in THORNTON, CA)
CRITERIA AND HAZARDOUS AIR POLLUTANT INVENTORY (Inventory of air pollution sources) Business SIC classification: GASOLINE SERVICE STATIONS
BARBER PRIVATE DUMP (2 MI NE OF THORTON; S28 T5N R5 in THORNTON, CA)
CRITERIA AND HAZARDOUS AIR POLLUTANT INVENTORY (Inventory of air pollution sources) Business SIC classification: REFUSE SYSTEMS Business NAICS classification: SOLID WASTE LANDFILL.
42.1%Utility gas
38.4%Electricity
17.3%Bottled, tank, or LP gas
2.2%Other fuel
Place of birth for U.S.-born residents:
This state: 769
South: 30
West: 36
60% of the 95686 zip code residents lived in the same house 5 years ago. Out of people who lived in different houses, 71% lived in this county. Out of people who lived in different counties, 50% lived in California.
90% of the 95686 zip code residents lived in the same house 1 year ago. Out of people who lived in different houses, 39% moved from this county. Out of people who lived in different houses, 36% moved from different county within same state. Out of people who lived in different houses, 26% moved from abroad.
Private vs. public school enrollment:
Students in private schools in grades 1 to 8 (elementary and middle school):
Here:
0.0%
California:
10.5%
Students in private schools in grades 9 to 12 (high school):
Here:
0.0%
California:
8.5%
Students in private undergraduate colleges: 1
Here:
5.2%
California:
15.9%
Occupation by median earnings in the past 12 months ($)
55,785Construction and extraction occupations
37,334Healthcare support occupations
34,659Management occupations
34,405Farming, fishing, and forestry occupations
30,938Sales and related occupations
29,859Building and grounds cleaning and maintenance occupations
Companies with federal contracts located in this zip code:
AFFORDA-TEST (26515 N SACRAMENTO BL in THORNTON, CA; small business) : $3,703 in 2 contractsin 2005
$2,805 with Air Force for Certifications and Accreditations for products and institutions other than educational institutions. Signed on 2005-05-23. Completion date: 2005-06-30.
$898, same as above.Signed on 2005-09-07. Completion date: 2005-09-07.
Top industries in this zip code by the number of employees in 2005:
Health Care and Social Assistance: Offices of Mental Health Practitioners (except Physicians) (20-49 employees: 1 establishment)
Professional, Scientific, and Technical Services: Testing Laboratories (5-9: 1)
Administrative and Support and Waste Management and Remediation Services: Landscaping Services (5-9: 1)
Construction: All Other Specialty Trade Contractors (5-9: 1)
Construction: Framing Contractors (1-4: 2)
Accommodation and Food Services: RV (Recreational Vehicle) Parks and Campgrounds (1-4: 1)
People in group quarters in 2010:
6 people in workers' group living quarters and job corps centers
Fatal accident statistics in 2013:
Fatal accident count: 2
Vehicles involved in fatal accidents: 3
Fatal accidents caused by drunken drivers: 0
Fatalities: 2
Persons involved in fatal accidents: 3
Pedestrians involved in fatal accidents: 0
Fatal accident statistics in 2010:
Fatal accident count: 1
Vehicles involved in fatal accidents: 1
Fatal accidents caused by drunken drivers: 0
Fatalities: 1
Persons involved in fatal accidents: 1
Pedestrians involved in fatal accidents: 0
Home Mortgage Disclosure Act Aggregated Statistics For Year 2009 (Based on 4 partial tracts)
A) FHA, FSA/RHS & VA Home Purchase Loans
B) Conventional Home Purchase Loans
C) Refinancings
G) Loans On Manufactured Home Dwelling (A B C & D)
Number
Average Value
Number
Average Value
Number
Average Value
Number
Average Value
LOANS ORIGINATED
2
$220,695
2
$160,865
1
$244,440
1
$77,760
APPLICATIONS APPROVED, NOT ACCEPTED
0
$0
0
$0
1
$237,920
0
$0
APPLICATIONS DENIED
0
$0
2
$64,020
10
$319,215
5
$112,768
APPLICATIONS WITHDRAWN
1
$189,960
0
$0
4
$121,290
2
$67,745
FILES CLOSED FOR INCOMPLETENESS
0
$0
0
$0
0
$0
0
$0
Aggregated Statistics For Year 2008 (Based on 4 partial tracts)
B) Conventional Home Purchase Loans
C) Refinancings
D) Home Improvement Loans
F) Non-occupant Loans on < 5 Family Dwellings (A B C & D)
G) Loans On Manufactured Home Dwelling (A B C & D)
Number
Average Value
Number
Average Value
Number
Average Value
Number
Average Value
Number
Average Value
LOANS ORIGINATED
4
$359,910
3
$166,220
0
$0
1
$155,510
2
$113,605
APPLICATIONS APPROVED, NOT ACCEPTED
1
$544,750
1
$390,170
0
$0
0
$0
0
$0
APPLICATIONS DENIED
1
$500,990
10
$306,132
2
$126,410
0
$0
3
$138,593
APPLICATIONS WITHDRAWN
2
$268,650
1
$270,050
0
$0
0
$0
1
$209,520
FILES CLOSED FOR INCOMPLETENESS
0
$0
1
$178,790
0
$0
0
$0
0
$0
Aggregated Statistics For Year 2007 (Based on 4 partial tracts)
B) Conventional Home Purchase Loans
C) Refinancings
D) Home Improvement Loans
F) Non-occupant Loans on < 5 Family Dwellings (A B C & D)
G) Loans On Manufactured Home Dwelling (A B C & D)
Number
Average Value
Number
Average Value
Number
Average Value
Number
Average Value
Number
Average Value
LOANS ORIGINATED
9
$267,358
14
$240,815
4
$171,458
1
$216,040
9
$143,663
APPLICATIONS APPROVED, NOT ACCEPTED
0
$0
1
$239,780
0
$0
0
$0
0
$0
APPLICATIONS DENIED
3
$191,673
13
$279,396
3
$170,720
3
$209,830
9
$162,753
APPLICATIONS WITHDRAWN
1
$193,220
6
$209,520
0
$0
2
$256,080
2
$209,055
FILES CLOSED FOR INCOMPLETENESS
2
$329,180
1
$293,790
0
$0
0
$0
1
$145,270
Aggregated Statistics For Year 2006 (Based on 4 partial tracts)
B) Conventional Home Purchase Loans
C) Refinancings
D) Home Improvement Loans
F) Non-occupant Loans on < 5 Family Dwellings (A B C & D)
G) Loans On Manufactured Home Dwelling (A B C & D)
Number
Average Value
Number
Average Value
Number
Average Value
Number
Average Value
Number
Average Value
LOANS ORIGINATED
18
$246,173
19
$252,625
4
$158,305
6
$221,937
11
$180,272
APPLICATIONS APPROVED, NOT ACCEPTED
5
$257,850
5
$267,254
1
$28,400
4
$233,848
1
$170,410
APPLICATIONS DENIED
4
$240,600
20
$290,232
5
$174,880
1
$382,260
5
$137,818
APPLICATIONS WITHDRAWN
3
$277,343
7
$264,860
0
$0
1
$193,220
1
$208,590
FILES CLOSED FOR INCOMPLETENESS
0
$0
0
$0
0
$0
0
$0
0
$0
Aggregated Statistics For Year 2005 (Based on 4 partial tracts)
B) Conventional Home Purchase Loans
C) Refinancings
D) Home Improvement Loans
F) Non-occupant Loans on < 5 Family Dwellings (A B C & D)
G) Loans On Manufactured Home Dwelling (A B C & D)
Number
Average Value
Number
Average Value
Number
Average Value
Number
Average Value
Number
Average Value
LOANS ORIGINATED
33
$260,031
29
$245,082
4
$116,050
3
$240,870
9
$154,062
APPLICATIONS APPROVED, NOT ACCEPTED
6
$253,830
7
$236,990
2
$118,495
0
$0
1
$238,850
APPLICATIONS DENIED
15
$241,088
23
$236,869
7
$140,079
3
$156,597
8
$226,921
APPLICATIONS WITHDRAWN
12
$194,931
13
$225,601
2
$313,115
2
$141,075
3
$155,357
FILES CLOSED FOR INCOMPLETENESS
1
$281,220
4
$196,482
0
$0
0
$0
0
$0
Aggregated Statistics For Year 2004 (Based on 4 partial tracts)
A) FHA, FSA/RHS & VA Home Purchase Loans
B) Conventional Home Purchase Loans
C) Refinancings
D) Home Improvement Loans
F) Non-occupant Loans on < 5 Family Dwellings (A B C & D)
G) Loans On Manufactured Home Dwelling (A B C & D)
Number
Average Value
Number
Average Value
Number
Average Value
Number
Average Value
Number
Average Value
Number
Average Value
LOANS ORIGINATED
1
$320,330
97
$219,970
37
$212,062
6
$109,960
11
$190,049
12
$139,602
APPLICATIONS APPROVED, NOT ACCEPTED
0
$0
17
$192,348
9
$177,342
1
$34,920
1
$257,010
4
$130,485
APPLICATIONS DENIED
0
$0
23
$229,581
28
$230,655
8
$78,338
5
$195,180
9
$158,200
APPLICATIONS WITHDRAWN
1
$229,540
49
$236,515
12
$231,520
1
$318,940
6
$222,557
2
$293,795
FILES CLOSED FOR INCOMPLETENESS
0
$0
3
$201,603
9
$198,863
0
$0
0
$0
2
$134,790
Aggregated Statistics For Year 2003 (Based on 4 partial tracts)
A) FHA, FSA/RHS & VA Home Purchase Loans
B) Conventional Home Purchase Loans
C) Refinancings
D) Home Improvement Loans
F) Non-occupant Loans on < 5 Family Dwellings (A B C & D)
Number
Average Value
Number
Average Value
Number
Average Value
Number
Average Value
Number
Average Value
LOANS ORIGINATED
4
$210,800
55
$199,277
52
$168,905
5
$53,916
6
$157,218
APPLICATIONS APPROVED, NOT ACCEPTED
0
$0
6
$205,873
8
$156,034
0
$0
0
$0
APPLICATIONS DENIED
1
$156,440
10
$203,653
41
$165,856
2
$16,995
3
$155,820
APPLICATIONS WITHDRAWN
0
$0
10
$219,856
20
$188,452
0
$0
1
$301,710
FILES CLOSED FOR INCOMPLETENESS
0
$0
4
$188,685
5
$135,396
0
$0
3
$148,060
Aggregated Statistics For Year 1999 (Based on 2 partial tracts)
A) FHA, FSA/RHS & VA Home Purchase Loans
B) Conventional Home Purchase Loans
C) Refinancings
D) Home Improvement Loans
F) Non-occupant Loans on < 5 Family Dwellings (A B C & D)
Detailed PMIC statistics for the following Tracts:0040.01
2004 - 2018 National Fire Incident Reporting System (NFIRS) incidents
Based on the data from the years 2004 - 2018 the average number of fire incidents per year is 40. The highest number of fires - 89 took place in 2004, and the least - 1 in 2017. The data has a dropping trend.
When looking into fire subcategories, the most reports belonged to: Outside Fires (57.9%), and Mobile Property/Vehicle Fires (28.1%).
Fire incident types reported to NFIRS in Zip Code 95686


 Nearest zip codes: 95641, 95680, 95690, 95219, 95242, 95615.


 Based on the data from the years 2004 - 2018 the average number of fire incidents per year is 40. The highest number of fires - 89 took place in 2004, and the least - 1 in 2017. The data has a dropping trend.
 When looking into fire subcategories, the most reports belonged to: Outside Fires (57.9%), and Mobile Property/Vehicle Fires (28.1%).