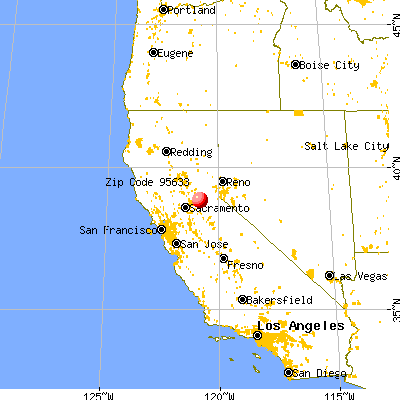
Averages for the 2020 tax year for zip code 95633, filed in 2021:
Average Adjusted Gross Income (AGI) in 2020: $65,347 (Individual Income Tax Returns)
Here:
$65,347
State:
$95,910
Salary/wage: $58,477 (reported on 68.3% of returns)
Here:
$58,477
State:
$77,331
(% of AGI for various income ranges: 983.6% for AGIs below $25k, 3403.3% for AGIs $25k-50k, 6405.8% for AGIs $50k-75k, 9796.7% for AGIs $75k-100k, 15392.5% for AGIs $100k-200k)
Taxable interest for individuals: $662 (reported on 45.5% of returns)
This zip code:
$662
California:
$2,294
(% of AGI for various income ranges: 28.0% for AGIs below $25k, 35.2% for AGIs $25k-50k, 49.2% for AGIs $50k-75k, 67.8% for AGIs $75k-100k, 84.4% for AGIs $100k-200k)
Ordinary dividends: $4,685 (reported on 17.9% of returns)
Here:
$4,685
State:
$10,949
(% of AGI for various income ranges: 30.0% for AGIs below $25k, 76.2% for AGIs $25k-50k, 183.3% for AGIs $50k-75k, 143.3% for AGIs $75k-100k, 317.5% for AGIs $100k-200k)
Net capital gain/loss in AGI: +$7,528 (reported on 17.2% of returns)
Here:
+$7,528
State:
+$49,306
(% of AGI for various income ranges: 22.8% for AGIs below $25k, 80.0% for AGIs $25k-50k, 140.8% for AGIs $50k-75k, 111.1% for AGIs $75k-100k, 867.5% for AGIs $100k-200k)
Profit/loss from business: +$14,354 (reported on 19.3% of returns)
Here:
+$14,354
State:
+$15,671
(% of AGI for various income ranges: 224.4% for AGIs below $25k, 364.8% for AGIs $25k-50k, 565.0% for AGIs $50k-75k, 997.8% for AGIs $75k-100k, 697.5% for AGIs $100k-200k)
Taxable individual retirement arrangement distribution: $21,476 (reported on 11.7% of returns)
95633:
$21,476
California:
$23,505
(% of AGI for various income ranges: 107.6% for AGIs below $25k, 132.4% for AGIs $25k-50k, 653.3% for AGIs $50k-75k, 1450.0% for AGIs $100k-200k)
Total itemized deductions: $25,845 (reported on 13.8% of returns)
Here:
$25,845
State:
$39,517
(% of AGI for various income ranges: 397.1% for AGIs $25k-50k, 621.7% for AGIs $50k-75k, 1126.7% for AGIs $75k-100k, 1609.4% for AGIs $100k-200k)
Charity contributions: $3,764 (reported on 9.7% of returns)
Here:
$3,764
State:
$12,598
(% of AGI for various income ranges: 68.3% for AGIs $50k-75k, 74.4% for AGIs $75k-100k, 236.2% for AGIs $100k-200k)
Taxes paid: $8,100 (reported on 13.8% of returns)
95633:
$8,100
State:
$8,807
(% of AGI for various income ranges: 102.4% for AGIs $25k-50k, 179.2% for AGIs $50k-75k, 384.4% for AGIs $75k-100k, 527.5% for AGIs $100k-200k)
Earned income credit: $1,850 (reported on 12.4% of returns)
Here:
$1,850
State:
$2,074
(% of AGI for various income ranges: 77.6% for AGIs below $25k, 66.2% for AGIs $25k-50k)
Percentage of individuals using paid preparers for their 2020 taxes: 93.1%
Here:
93%
State:
92%
(% for various income ranges: 92.9% for AGIs below $25k, 90.9% for AGIs $25k-50k, 95.2% for AGIs $50k-75k, 93.8% for AGIs $75k-100k, 96.4% for AGIs $100k-200k, 80.0% for AGIs over 200k)
Averages for the 2012 tax year for zip code 95633, filed in 2013:
Average Adjusted Gross Income (AGI) in 2012: $53,105 (Individual Income Tax Returns)
Here:
$53,105
State:
$72,726
Salary/wage: $44,905 (reported on 71.1% of returns)
Here:
$44,905
State:
$59,079
(% of AGI for various income ranges: 62.9% for AGIs below $25k, 61.8% for AGIs $25k-50k, 60.0% for AGIs $50k-75k, 59.9% for AGIs $75k-100k, 59.1% for AGIs $100k-200k)
Taxable interest for individuals: $800 (reported on 45.9% of returns)
This zip code:
$800
California:
$2,146
(% of AGI for various income ranges: 1.3% for AGIs below $25k, 1.3% for AGIs $25k-50k, 0.5% for AGIs $50k-75k, 0.4% for AGIs $75k-100k, 0.6% for AGIs $100k-200k)
Ordinary dividends: $4,238 (reported on 19.3% of returns)
Here:
$4,238
State:
$9,308
(% of AGI for various income ranges: 2.6% for AGIs below $25k, 1.9% for AGIs $25k-50k, 1.6% for AGIs $50k-75k, 0.6% for AGIs $75k-100k, 1.6% for AGIs $100k-200k)
Net capital gain/loss in AGI: +$1,529 (reported on 15.6% of returns)
Here:
+$1,529
State:
+$30,460
(% of AGI for various income ranges: 0.6% for AGIs $25k-50k, 1.4% for AGIs $100k-200k)
Profit/loss from business: +$12,462 (reported on 21.5% of returns)
Here:
+$12,462
State:
+$17,064
(% of AGI for various income ranges: 12.8% for AGIs below $25k, 7.1% for AGIs $25k-50k, 5.7% for AGIs $50k-75k, 2.9% for AGIs $75k-100k, 3.2% for AGIs $100k-200k)
Taxable individual retirement arrangement distribution: $15,878 (reported on 13.3% of returns)
95633:
$15,878
California:
$19,557
(% of AGI for various income ranges: 4.3% for AGIs below $25k, 3.6% for AGIs $25k-50k, 3.4% for AGIs $50k-75k, 4.4% for AGIs $75k-100k, 4.2% for AGIs $100k-200k)
Total itemized deductions: $21,381 (26% of AGI, reported on 43.7% of returns)
Here:
$21,381
State:
$34,004
Here:
26.2% of AGI
State:
22.7% of AGI
(% of AGI for various income ranges: 14.6% for AGIs below $25k, 15.6% for AGIs $25k-50k, 20.7% for AGIs $50k-75k, 18.4% for AGIs $75k-100k, 16.9% for AGIs $100k-200k)
Charity contributions: $2,204 (reported on 33.3% of returns)
Here:
$2,204
State:
$4,659
(% of AGI for various income ranges: 0.8% for AGIs below $25k, 1.0% for AGIs $25k-50k, 1.6% for AGIs $50k-75k, 1.5% for AGIs $75k-100k, 1.5% for AGIs $100k-200k)
Taxes paid: $6,524 (reported on 43.7% of returns)
95633:
$6,524
State:
$14,448
(% of AGI for various income ranges: 3.1% for AGIs below $25k, 3.7% for AGIs $25k-50k, 5.3% for AGIs $50k-75k, 5.2% for AGIs $75k-100k, 6.7% for AGIs $100k-200k)
Earned income credit: $1,971 (reported on 15.6% of returns)
Here:
$1,971
State:
$2,286
(% of AGI for various income ranges: 5.2% for AGIs below $25k, 1.0% for AGIs $25k-50k)
Percentage of individuals using paid preparers for their 2012 taxes: 53.3%
Here:
53%
State:
64%
(% for various income ranges: 45.8% for AGIs below $25k, 51.7% for AGIs $25k-50k, 60.0% for AGIs $50k-75k, 60.0% for AGIs $75k-100k, 61.1% for AGIs $100k-200k)
Averages for the 2004 tax year for zip code 95633, filed in 2005:
Average Adjusted Gross Income (AGI) in 2004: $47,697 (Individual Income Tax Returns)
Here:
$47,697
State:
$58,600
Salary/wage: $43,158 (reported on 77.3% of returns)
Here:
$43,158
State:
$49,455
(% of AGI for various income ranges: 65.9% for AGIs below $10k, 63.8% for AGIs $10k-25k, 70.8% for AGIs $25k-50k, 74.4% for AGIs $50k-75k, 78.8% for AGIs $75k-100k, 61.2% for AGIs over 100k)
Taxable interest for individuals: $1,221 (reported on 56.6% of returns)
This zip code:
$1,221
California:
$2,365
(% of AGI for various income ranges: 8.3% for AGIs below $10k, 3.0% for AGIs $10k-25k, 1.5% for AGIs $25k-50k, 1.3% for AGIs $50k-75k, 0.6% for AGIs $75k-100k, 1.4% for AGIs over 100k)
Taxable dividends: $2,573 (reported on 22.5% of returns)
Here:
$2,573
State:
$4,746
(% of AGI for various income ranges: 9.6% for AGIs below $10k, 1.6% for AGIs $10k-25k, 1.6% for AGIs $25k-50k, 0.6% for AGIs $50k-75k, 0.2% for AGIs $75k-100k, 1.6% for AGIs over 100k)
Net capital gain/loss: +$10,861 (reported on 20.0% of returns)
Here:
+$10,861
State:
+$23,418
(% of AGI for various income ranges: -5.5% for AGIs below $10k, -0.4% for AGIs $10k-25k, 0.2% for AGIs $25k-50k, 1.4% for AGIs $50k-75k, 0.6% for AGIs $75k-100k, 14.9% for AGIs over 100k)
Profit/loss from business: +$10,947 (reported on 23.2% of returns)
Here:
+$10,947
State:
+$16,826
(% of AGI for various income ranges: 22.2% for AGIs below $10k, 10.2% for AGIs $10k-25k, 6.8% for AGIs $25k-50k, 5.6% for AGIs $50k-75k, 5.1% for AGIs $75k-100k, 1.9% for AGIs over 100k)
IRA payment deduction: $3,214 (reported on 4.1% of returns)
95633:
$3,214
California:
$3,192
Self-employed pension: $5,750 (reported on 1.2% of returns)
Here:
$5,750
California:
$17,688
Total itemized deductions: $20,009 (28% of AGI, reported on 49.6% of returns)
Here:
$20,009
State:
$28,113
Here:
28.4% of AGI
State:
25.3% of AGI
(% of AGI for various income ranges: 26.1% for AGIs below $10k, 18.5% for AGIs $10k-25k, 22.5% for AGIs $25k-50k, 22.6% for AGIs $50k-75k, 21.7% for AGIs $75k-100k, 17.7% for AGIs over 100k)
Charity contributions deductions: $2,214 (3% of AGI, reported on 42.6% of returns)
Here:
$2,214
State:
$3,923
Here:
3.0% of AGI
State:
3.3% of AGI
(% of AGI for various income ranges: 1.1% for AGIs below $10k, 1.6% for AGIs $10k-25k, 1.4% for AGIs $25k-50k, 2.1% for AGIs $50k-75k, 2.0% for AGIs $75k-100k, 2.4% for AGIs over 100k)
Total tax: $5,991 (reported on 79.7% of returns)
95633:
$5,991
State:
$10,761
(% of AGI for various income ranges: 4.2% for AGIs below $10k, 4.9% for AGIs $10k-25k, 7.1% for AGIs $25k-50k, 8.3% for AGIs $50k-75k, 10.2% for AGIs $75k-100k, 15.2% for AGIs over 100k)
Earned income credit: $1,444 (reported on 10.5% of returns)
Here:
$1,444
State:
$1,763
Percentage of individuals using paid preparers for their 2004 taxes: 60.1%
Here:
60%
State:
66%
(% for various income ranges: 47.1% for AGIs below $10k, 57.7% for AGIs $10k-25k, 64.5% for AGIs $25k-50k, 61.7% for AGIs $50k-75k, 66.7% for AGIs $75k-100k, 67.2% for AGIs over 100k)
Likely homosexual households (counted as self-reported same-sex unmarried-partner households)
Lesbian couples: 0.0% of all households
Gay men: 1.6% of all households
Household received Food Stamps/SNAP in the past 12 months: 94 Household did not receive Food Stamps/SNAP in the past 12 months: 1,248
Women who had a birth in the past 12 months: 9 (9 now married, 0 unmarried) Women who did not have a birth in the past 12 months: 552 (351 now married, 195 unmarried)
Housing units in zip code 95633 with a mortgage: 587 (71 second mortgage, 46 both second mortgage and home equity loan) Median monthly owner costs for units with a mortgage: $2,461 Median monthly owner costs for units without a mortgage: $528
Residents with income below the poverty level in 2022:
This zip code:
16.5%
Whole state:
12.2%
Residents with income below 50% of the poverty level in 2022:
This zip code:
6.0%
Whole state:
6.2%
Median number of rooms in houses and condos:
Here:
5.9
State:
6.0
Median number of rooms in apartments:
Here:
3.6
State:
3.9
Notable locations in this zip code not listed on our city pages
Notable locations in zip code 95633: Sutters Mill (A), American Flat (B), Bear Creek Picnic Area (C), Point Pleasant Bench Picnic Area (D), North Star Tree Farm (E), Garden Valley California Division of Forestry Station (F), Garden Valley Fire Protection District Station 51 (G), Department of Forestry and Fire Protection Station 50 Garden Valley (H), Kelsey P O (I). Display/hide their locations on the map
Creeks: Gambler Creek (A), Indian Creek (B), Little Silver Creek (C), Johntown Creek (D), Slate Creek (E), Pegleg Creek (F), Manhattan Creek (G), Little Sailor Creek (H), Irish Creek (I). Display/hide their locations on the map
Size of family households: 701 2-persons, 152 3-persons, 62 4-persons, 6 5-persons, 6 6-persons, 64 7-or-more-persons
Size of nonfamily households: 279 1-person, 98 2-persons
505 married couples with children.
218 single-parent households (42 men, 176 women).
93.9% of residents of 95633 zip code speak English at home.
1.6% of residents speak Spanish at home (100% very well).
4.4% of residents speak other Indo-European language at home (83% very well, 17% not well).
Foreign born population: 290 (8.9%) (36.0% of them are naturalized citizens)
This zip code:
8.9%
Whole state:
26.7%
27%Albania
26%Serbia
16%Australia
8%Romania
8%Thailand
4%Malaysia
2%France
16%German
14%English
10%Austrian
5%Eastern European
4%Irish
3%Scottish
3%European
Year of entry for the foreign-born population
1252010 or later
72000 to 2009
661990 to 1999
143Before 1990
Facilities with environmental interests located in this zip code:
GOLDEN SIERRA HIGH (5101 GARDEN VALLEY ROAD in GARDEN VALLEY, CA)
(National Center for Education Statistics) - STATE ID-0930073 Organizations: BLACK OAK MINE UNIFIED (SCHOOL DISTRICT)
JOHNSON ENTERPRISES (5660 MT MURPHY RD in GARDEN VALLEY, CA)
TRANSPORTER (Resource Conservation and Recovery Act (tracking hazardous waste)) - notification Organizations: ROY JOHNSON (CONTACT/OWNER)
GARDEN VALLEY (4920 BLACK OAK MINE RD, N SIDE in GARDEN VALLEY, CA)
CRITERIA AND HAZARDOUS AIR POLLUTANT INVENTORY (Inventory of air pollution sources) Business SIC classification: REFUSE SYSTEMS Business NAICS classification: SOLID WASTE LANDFILL.
45.5%Bottled, tank, or LP gas
28.3%Wood
22.3%Electricity
4.0%Utility gas
Population in 1990: 3,628.
Place of birth for U.S.-born residents:
This state: 2,291
Northeast: 38
Midwest: 228
South: 155
West: 214
66% of the 95633 zip code residents lived in the same house 5 years ago. Out of people who lived in different houses, 27% lived in this county. Out of people who lived in different counties, 50% lived in California.
89% of the 95633 zip code residents lived in the same house 1 year ago. Out of people who lived in different houses, 25% moved from this county. Out of people who lived in different houses, 36% moved from different county within same state. Out of people who lived in different houses, 42% moved from different state.
Private vs. public school enrollment:
Students in private schools in grades 1 to 8 (elementary and middle school): 56
Here:
14.1%
California:
10.5%
Students in private schools in grades 9 to 12 (high school):
Here:
0.0%
California:
8.5%
Students in private undergraduate colleges: 6
Here:
100.0%
California:
15.9%
Occupation by median earnings in the past 12 months ($)
170,155Management occupations
115,749Business and financial operations occupations
107,520Sales and related occupations
79,079Production occupations
67,563Office and administrative support occupations
63,160Education, training, and library occupations
Companies with federal contracts located in this zip code:
VAN RAALTE & CO INC (5621 GARDEN VALLEY RD in GARDEN VALLEY, CA; small business)
$10,829 with Army for Miscellaneous Items. Signed on 2005-09-28. Completion date: 2005-10-21.
REIBER, TOM (6321 PEACEFUL MT RD in GARDEN VALLEY, CA; small business)
$3,050 with Navy for Power and Hand Pumps. Signed on 2005-09-15. Completion date: 2005-10-28.
Top industries in this zip code by the number of employees in 2005:
Construction: New Single-Family Housing Construction (except Operative Builders) (10-19 employees: 1 establishment, 1-4 employees: 4 establishments)
Construction: Framing Contractors (10-19: 1)
Construction: Poured Concrete Foundation and Structure Contractors (5-9: 1)
Real Estate and Rental and Leasing: Offices of Real Estate Agents and Brokers (1-4: 2)
Construction: Site Preparation Contractors (1-4: 2)
People in group quarters in 2010:
24 people in residential treatment centers for adults
People in group quarters in 2000:
14 people in homes or halfway houses for drug/alcohol abuse
3 people in other noninstitutional group quarters
Home Mortgage Disclosure Act Aggregated Statistics For Year 2009 (Based on 2 partial tracts)
A) FHA, FSA/RHS & VA Home Purchase Loans
B) Conventional Home Purchase Loans
C) Refinancings
D) Home Improvement Loans
F) Non-occupant Loans on < 5 Family Dwellings (A B C & D)
G) Loans On Manufactured Home Dwelling (A B C & D)
Number
Average Value
Number
Average Value
Number
Average Value
Number
Average Value
Number
Average Value
Number
Average Value
LOANS ORIGINATED
10
$222,215
9
$184,084
49
$221,227
8
$157,282
3
$244,227
9
$192,889
APPLICATIONS APPROVED, NOT ACCEPTED
1
$125,940
3
$169,327
5
$259,614
1
$127,090
2
$178,195
2
$188,720
APPLICATIONS DENIED
3
$165,753
2
$190,635
31
$273,949
5
$153,350
2
$181,065
7
$198,236
APPLICATIONS WITHDRAWN
2
$222,790
2
$163,840
23
$254,396
3
$116,880
2
$256,665
5
$207,402
FILES CLOSED FOR INCOMPLETENESS
0
$0
1
$125,940
2
$324,805
1
$236,950
0
$0
0
$0
Aggregated Statistics For Year 2008 (Based on 2 partial tracts)
A) FHA, FSA/RHS & VA Home Purchase Loans
B) Conventional Home Purchase Loans
C) Refinancings
D) Home Improvement Loans
F) Non-occupant Loans on < 5 Family Dwellings (A B C & D)
G) Loans On Manufactured Home Dwelling (A B C & D)
Number
Average Value
Number
Average Value
Number
Average Value
Number
Average Value
Number
Average Value
Number
Average Value
LOANS ORIGINATED
4
$275,232
12
$226,586
38
$242,383
10
$111,357
5
$223,632
11
$203,163
APPLICATIONS APPROVED, NOT ACCEPTED
0
$0
5
$278,220
7
$224,867
1
$98,760
3
$180,427
0
$0
APPLICATIONS DENIED
2
$260,305
6
$466,760
34
$288,597
8
$168,289
3
$227,383
6
$222,790
APPLICATIONS WITHDRAWN
1
$279,060
3
$183,360
17
$296,445
2
$209,775
2
$223,555
3
$231,850
FILES CLOSED FOR INCOMPLETENESS
1
$155,800
1
$222,020
5
$259,768
0
$0
0
$0
0
$0
Aggregated Statistics For Year 2007 (Based on 2 partial tracts)
A) FHA, FSA/RHS & VA Home Purchase Loans
B) Conventional Home Purchase Loans
C) Refinancings
D) Home Improvement Loans
F) Non-occupant Loans on < 5 Family Dwellings (A B C & D)
G) Loans On Manufactured Home Dwelling (A B C & D)
Number
Average Value
Number
Average Value
Number
Average Value
Number
Average Value
Number
Average Value
Number
Average Value
LOANS ORIGINATED
2
$333,995
21
$287,829
64
$271,381
11
$146,891
7
$252,539
8
$226,570
APPLICATIONS APPROVED, NOT ACCEPTED
0
$0
7
$255,766
21
$261,981
2
$98,380
2
$261,260
5
$223,708
APPLICATIONS DENIED
2
$227,765
7
$256,969
54
$271,207
7
$127,363
3
$228,020
7
$230,336
APPLICATIONS WITHDRAWN
0
$0
2
$279,825
23
$225,719
4
$171,302
2
$240,975
3
$205,180
FILES CLOSED FOR INCOMPLETENESS
0
$0
1
$208,240
9
$289,950
1
$124,790
0
$0
0
$0
Aggregated Statistics For Year 2006 (Based on 2 partial tracts)
A) FHA, FSA/RHS & VA Home Purchase Loans
B) Conventional Home Purchase Loans
C) Refinancings
D) Home Improvement Loans
F) Non-occupant Loans on < 5 Family Dwellings (A B C & D)
G) Loans On Manufactured Home Dwelling (A B C & D)
Number
Average Value
Number
Average Value
Number
Average Value
Number
Average Value
Number
Average Value
Number
Average Value
LOANS ORIGINATED
1
$215,900
33
$269,723
92
$273,065
22
$157,018
6
$265,535
16
$226,666
APPLICATIONS APPROVED, NOT ACCEPTED
0
$0
9
$194,973
18
$278,381
2
$186,615
2
$294,565
5
$147,760
APPLICATIONS DENIED
0
$0
13
$309,125
54
$282,492
13
$173,497
3
$279,570
8
$226,188
APPLICATIONS WITHDRAWN
0
$0
7
$251,390
33
$328,500
4
$105,078
2
$133,215
2
$206,140
FILES CLOSED FOR INCOMPLETENESS
0
$0
1
$157,710
8
$309,876
1
$54,360
0
$0
1
$290,160
Aggregated Statistics For Year 2005 (Based on 2 partial tracts)
A) FHA, FSA/RHS & VA Home Purchase Loans
B) Conventional Home Purchase Loans
C) Refinancings
D) Home Improvement Loans
F) Non-occupant Loans on < 5 Family Dwellings (A B C & D)
G) Loans On Manufactured Home Dwelling (A B C & D)
Number
Average Value
Number
Average Value
Number
Average Value
Number
Average Value
Number
Average Value
Number
Average Value
LOANS ORIGINATED
2
$207,285
49
$252,062
118
$251,234
24
$125,638
10
$236,685
22
$223,538
APPLICATIONS APPROVED, NOT ACCEPTED
0
$0
11
$247,150
20
$241,222
2
$179,535
2
$224,510
6
$187,062
APPLICATIONS DENIED
0
$0
16
$257,624
60
$253,943
14
$139,804
4
$261,740
12
$193,633
APPLICATIONS WITHDRAWN
0
$0
11
$231,003
54
$256,724
3
$219,473
7
$248,000
7
$198,071
FILES CLOSED FOR INCOMPLETENESS
0
$0
3
$227,510
11
$251,778
2
$41,150
1
$158,860
2
$134,935
Aggregated Statistics For Year 2004 (Based on 2 partial tracts)
A) FHA, FSA/RHS & VA Home Purchase Loans
B) Conventional Home Purchase Loans
C) Refinancings
D) Home Improvement Loans
F) Non-occupant Loans on < 5 Family Dwellings (A B C & D)
G) Loans On Manufactured Home Dwelling (A B C & D)
Number
Average Value
Number
Average Value
Number
Average Value
Number
Average Value
Number
Average Value
Number
Average Value
LOANS ORIGINATED
2
$258,775
54
$220,457
142
$206,704
19
$106,438
10
$209,851
27
$177,336
APPLICATIONS APPROVED, NOT ACCEPTED
1
$145,850
11
$238,345
32
$200,563
1
$105,270
2
$177,045
7
$181,229
APPLICATIONS DENIED
0
$0
26
$196,155
63
$185,451
14
$85,693
4
$160,202
15
$166,569
APPLICATIONS WITHDRAWN
0
$0
10
$203,267
44
$194,715
7
$118,669
3
$248,183
6
$143,613
FILES CLOSED FOR INCOMPLETENESS
0
$0
2
$142,785
20
$216,435
1
$155,420
1
$300,500
2
$177,810
Aggregated Statistics For Year 2003 (Based on 2 partial tracts)
A) FHA, FSA/RHS & VA Home Purchase Loans
B) Conventional Home Purchase Loans
C) Refinancings
D) Home Improvement Loans
F) Non-occupant Loans on < 5 Family Dwellings (A B C & D)
Number
Average Value
Number
Average Value
Number
Average Value
Number
Average Value
Number
Average Value
LOANS ORIGINATED
2
$169,200
44
$183,988
205
$159,613
5
$63,162
11
$170,033
APPLICATIONS APPROVED, NOT ACCEPTED
0
$0
10
$186,194
40
$179,629
4
$48,425
2
$168,050
APPLICATIONS DENIED
0
$0
15
$183,310
67
$176,511
8
$32,060
6
$177,300
APPLICATIONS WITHDRAWN
0
$0
3
$208,500
60
$169,600
4
$50,625
2
$124,795
FILES CLOSED FOR INCOMPLETENESS
0
$0
2
$167,475
7
$197,634
0
$0
0
$0
Aggregated Statistics For Year 2002 (Based on 2 partial tracts)
A) FHA, FSA/RHS & VA Home Purchase Loans
B) Conventional Home Purchase Loans
C) Refinancings
D) Home Improvement Loans
F) Non-occupant Loans on < 5 Family Dwellings (A B C & D)
Number
Average Value
Number
Average Value
Number
Average Value
Number
Average Value
Number
Average Value
LOANS ORIGINATED
5
$189,026
36
$164,593
168
$151,338
7
$41,999
11
$164,360
APPLICATIONS APPROVED, NOT ACCEPTED
0
$0
4
$141,158
22
$133,058
1
$71,200
2
$115,605
APPLICATIONS DENIED
0
$0
9
$141,509
39
$145,484
7
$30,789
2
$89,960
APPLICATIONS WITHDRAWN
2
$161,160
7
$149,073
38
$156,172
4
$44,500
1
$205,560
FILES CLOSED FOR INCOMPLETENESS
0
$0
0
$0
6
$155,162
0
$0
0
$0
Aggregated Statistics For Year 2001 (Based on 2 partial tracts)
A) FHA, FSA/RHS & VA Home Purchase Loans
B) Conventional Home Purchase Loans
C) Refinancings
D) Home Improvement Loans
F) Non-occupant Loans on < 5 Family Dwellings (A B C & D)
Number
Average Value
Number
Average Value
Number
Average Value
Number
Average Value
Number
Average Value
LOANS ORIGINATED
8
$146,039
36
$145,166
108
$140,268
5
$22,050
9
$147,931
APPLICATIONS APPROVED, NOT ACCEPTED
1
$124,030
5
$122,266
8
$127,999
2
$22,775
1
$203,270
APPLICATIONS DENIED
0
$0
5
$116,064
39
$131,673
3
$36,620
2
$97,040
APPLICATIONS WITHDRAWN
0
$0
6
$120,965
32
$147,593
1
$26,800
1
$42,870
FILES CLOSED FOR INCOMPLETENESS
0
$0
0
$0
6
$206,648
1
$46,320
0
$0
Aggregated Statistics For Year 2000 (Based on 2 partial tracts)
A) FHA, FSA/RHS & VA Home Purchase Loans
B) Conventional Home Purchase Loans
C) Refinancings
D) Home Improvement Loans
F) Non-occupant Loans on < 5 Family Dwellings (A B C & D)
Number
Average Value
Number
Average Value
Number
Average Value
Number
Average Value
Number
Average Value
LOANS ORIGINATED
11
$138,052
33
$135,082
28
$102,508
4
$22,778
6
$121,412
APPLICATIONS APPROVED, NOT ACCEPTED
2
$108,905
5
$94,704
7
$111,559
4
$21,150
0
$0
APPLICATIONS DENIED
4
$132,258
8
$83,402
24
$100,980
3
$16,717
2
$82,495
APPLICATIONS WITHDRAWN
1
$77,710
3
$235,293
10
$115,223
1
$28,710
1
$73,500
FILES CLOSED FOR INCOMPLETENESS
0
$0
1
$130,530
4
$102,302
0
$0
0
$0
Aggregated Statistics For Year 1999 (Based on 1 partial tract)
A) FHA, FSA/RHS & VA Home Purchase Loans
B) Conventional Home Purchase Loans
C) Refinancings
D) Home Improvement Loans
F) Non-occupant Loans on < 5 Family Dwellings (A B C & D)
Detailed PMIC statistics for the following Tracts:0306.02
2005 - 2018 National Fire Incident Reporting System (NFIRS) incidents
Based on the data from the years 2005 - 2018 the average number of fires per year is 19. The highest number of reported fire incidents - 45 took place in 2005, and the least - 9 in 2018. The data has a declining trend.
When looking into fire subcategories, the most incidents belonged to: Outside Fires (63.5%), and Structure Fires (27.4%).
Fire incident types reported to NFIRS in Zip Code 95633


 Nearest zip codes: 95651, 95635, 95634, 95667, 95614, 95619.


 Based on the data from the years 2005 - 2018 the average number of fires per year is 19. The highest number of reported fire incidents - 45 took place in 2005, and the least - 9 in 2018. The data has a declining trend.
 When looking into fire subcategories, the most incidents belonged to: Outside Fires (63.5%), and Structure Fires (27.4%).