Estimated zip code population in 2022: 18,455 Zip code population in 2010: 17,509 Zip code population in 2000: 18,184
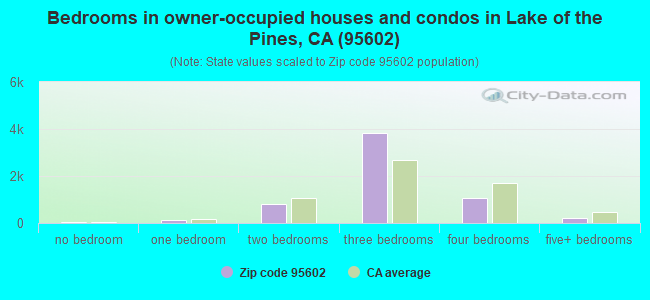
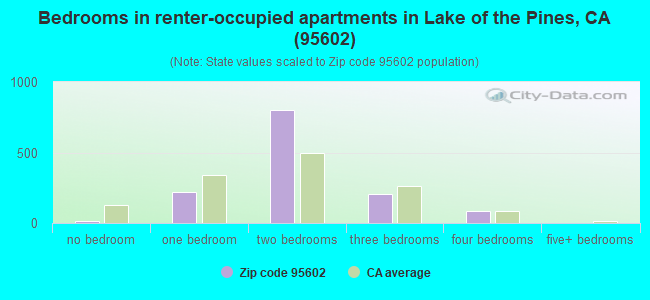
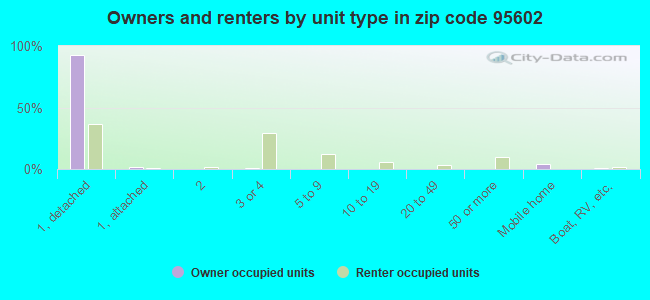
Houses and condos: 8,116 Renter-occupied apartments: 1,331
% of renters here:
18%
State:
44%
March 2022 cost of living index in zip code 95602: 102.7 (near average, U.S. average is 100)
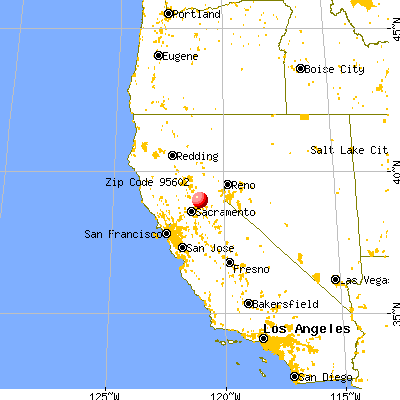
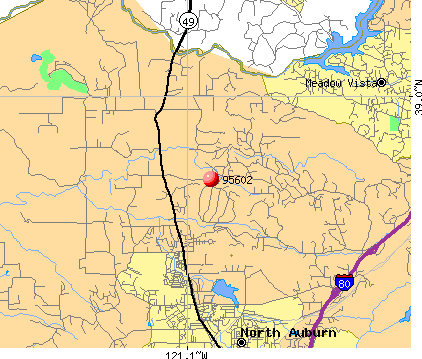
Land area: 49.4 sq. mi. Water area: 0.7 sq. mi.
Population density: 374 people per square mile
(very low).
OSM Map
General Map
Google Map
MSN Map
OSM Map
General Map
Google Map
MSN Map
OSM Map
General Map
Google Map
MSN Map
OSM Map
General Map
Google Map
MSN Map
Please wait while loading the map...
Real estate property taxes paid for housing units in 2022:
This zip code:
0.7% ($4,885)
California:
0.7% ($4,831)
Median real estate property taxes paid for housing units with mortgages in 2022: $4,745 (0.7%) Median real estate property taxes paid for housing units with no mortgage in 2022: $5,362 (0.7%)
Estimated median house/condo value in 2022: $662,042
95602:
$662,042
California:
$715,900
According to our research of California and other state lists, there were 28 registered sex offenders living in 95602 zip code as of July 06, 2024. The ratio of all residents to sex offenders in zip code 95602 is 669 to 1. The ratio of registered sex offenders to all residents in this zip code is near the state average.
Median resident age:
This zip code:
55.1 years
California median age:
37.9 years
Average household size:
This zip code:
2.4 people
California:
2.8 people
Averages for the 2020 tax year for zip code 95602, filed in 2021:
Average Adjusted Gross Income (AGI) in 2020: $98,555 (Individual Income Tax Returns)
Here:
$98,555
State:
$95,910
Salary/wage: $75,289 (reported on 67.1% of returns)
Here:
$75,289
State:
$77,331
(% of AGI for various income ranges: 1177.2% for AGIs below $25k, 3524.3% for AGIs $25k-50k, 5917.6% for AGIs $50k-75k, 8882.0% for AGIs $75k-100k, 16664.6% for AGIs $100k-200k, 70425.4% for AGIs over 200k)
Taxable interest for individuals: $2,178 (reported on 50.2% of returns)
This zip code:
$2,178
California:
$2,294
(% of AGI for various income ranges: 40.5% for AGIs below $25k, 47.3% for AGIs $25k-50k, 105.7% for AGIs $50k-75k, 197.3% for AGIs $75k-100k, 213.8% for AGIs $100k-200k, 2146.2% for AGIs over 200k)
Ordinary dividends: $8,167 (reported on 29.4% of returns)
Here:
$8,167
State:
$10,949
(% of AGI for various income ranges: 65.5% for AGIs below $25k, 94.3% for AGIs $25k-50k, 236.7% for AGIs $50k-75k, 393.0% for AGIs $75k-100k, 779.9% for AGIs $100k-200k, 3846.2% for AGIs over 200k)
Net capital gain/loss in AGI: +$37,820 (reported on 28.0% of returns)
Here:
+$37,820
State:
+$49,306
(% of AGI for various income ranges: 28.5% for AGIs below $25k, 53.8% for AGIs $25k-50k, 147.3% for AGIs $50k-75k, 483.6% for AGIs $75k-100k, 979.2% for AGIs $100k-200k, 33603.8% for AGIs over 200k)
Profit/loss from business: +$16,806 (reported on 17.9% of returns)
Here:
+$16,806
State:
+$15,671
(% of AGI for various income ranges: 181.3% for AGIs below $25k, 311.2% for AGIs $25k-50k, 513.7% for AGIs $50k-75k, 682.3% for AGIs $75k-100k, 921.3% for AGIs $100k-200k, 2600.8% for AGIs over 200k)
Taxable individual retirement arrangement distribution: $24,780 (reported on 16.3% of returns)
95602:
$24,780
California:
$23,505
(% of AGI for various income ranges: 98.4% for AGIs below $25k, 248.3% for AGIs $25k-50k, 528.4% for AGIs $50k-75k, 1007.5% for AGIs $75k-100k, 1823.1% for AGIs $100k-200k, 3326.7% for AGIs over 200k)
Self-employed (Keogh) retirement plans: $26,800 (reported on 1.0% of returns)
95602:
$26,800
California:
$30,163
(% of AGI for various income ranges: 26.0% for AGIs $25k-50k, 41.6% for AGIs $100k-200k, 735.0% for AGIs over 200k)
Total itemized deductions: $35,867 (reported on 20.3% of returns)
Here:
$35,867
State:
$39,517
(% of AGI for various income ranges: 183.7% for AGIs below $25k, 369.8% for AGIs $25k-50k, 860.2% for AGIs $50k-75k, 1393.4% for AGIs $75k-100k, 2397.5% for AGIs $100k-200k, 10477.5% for AGIs over 200k)
Charity contributions: $10,611 (reported on 16.9% of returns)
Here:
$10,611
State:
$12,598
(% of AGI for various income ranges: 11.3% for AGIs below $25k, 26.5% for AGIs $25k-50k, 97.5% for AGIs $50k-75k, 183.4% for AGIs $75k-100k, 408.4% for AGIs $100k-200k, 4314.6% for AGIs over 200k)
Taxes paid: $8,762 (reported on 20.0% of returns)
95602:
$8,762
State:
$8,807
(% of AGI for various income ranges: 35.7% for AGIs below $25k, 68.6% for AGIs $25k-50k, 219.0% for AGIs $50k-75k, 420.7% for AGIs $75k-100k, 701.8% for AGIs $100k-200k, 2060.8% for AGIs over 200k)
Earned income credit: $1,867 (reported on 8.5% of returns)
Here:
$1,867
State:
$2,074
(% of AGI for various income ranges: 56.7% for AGIs below $25k, 53.2% for AGIs $25k-50k)
Percentage of individuals using paid preparers for their 2020 taxes: 92.9%
Here:
93%
State:
92%
(% for various income ranges: 90.7% for AGIs below $25k, 94.2% for AGIs $25k-50k, 92.8% for AGIs $50k-75k, 93.3% for AGIs $75k-100k, 94.0% for AGIs $100k-200k, 94.2% for AGIs over 200k)
Averages for the 2012 tax year for zip code 95602, filed in 2013:
Average Adjusted Gross Income (AGI) in 2012: $76,032 (Individual Income Tax Returns)
Here:
$76,032
State:
$72,726
Salary/wage: $58,513 (reported on 68.6% of returns)
Here:
$58,513
State:
$59,079
(% of AGI for various income ranges: 60.3% for AGIs below $25k, 56.3% for AGIs $25k-50k, 54.5% for AGIs $50k-75k, 54.6% for AGIs $75k-100k, 61.5% for AGIs $100k-200k, 40.8% for AGIs over 200k)
Taxable interest for individuals: $1,759 (reported on 51.2% of returns)
This zip code:
$1,759
California:
$2,146
(% of AGI for various income ranges: 2.6% for AGIs below $25k, 1.2% for AGIs $25k-50k, 1.6% for AGIs $50k-75k, 1.0% for AGIs $75k-100k, 0.8% for AGIs $100k-200k, 1.3% for AGIs over 200k)
Ordinary dividends: $10,996 (reported on 30.7% of returns)
Here:
$10,996
State:
$9,308
(% of AGI for various income ranges: 3.5% for AGIs below $25k, 2.4% for AGIs $25k-50k, 2.8% for AGIs $50k-75k, 2.5% for AGIs $75k-100k, 1.7% for AGIs $100k-200k, 9.2% for AGIs over 200k)
Net capital gain/loss in AGI: +$15,443 (reported on 27.6% of returns)
Here:
+$15,443
State:
+$30,460
(% of AGI for various income ranges: 1.5% for AGIs $50k-75k, 0.8% for AGIs $75k-100k, 1.9% for AGIs $100k-200k, 15.4% for AGIs over 200k)
Profit/loss from business: +$19,305 (reported on 19.2% of returns)
Here:
+$19,305
State:
+$17,064
(% of AGI for various income ranges: 9.9% for AGIs below $25k, 7.4% for AGIs $25k-50k, 4.4% for AGIs $50k-75k, 4.6% for AGIs $75k-100k, 4.6% for AGIs $100k-200k, 3.7% for AGIs over 200k)
Taxable individual retirement arrangement distribution: $21,000 (reported on 19.0% of returns)
95602:
$21,000
California:
$19,557
(% of AGI for various income ranges: 6.0% for AGIs below $25k, 5.9% for AGIs $25k-50k, 5.2% for AGIs $50k-75k, 6.1% for AGIs $75k-100k, 6.5% for AGIs $100k-200k, 3.4% for AGIs over 200k)
Self-employment retirement plans: $15,540 (reported on 1.3% of returns)
95602:
$15,540
California:
$24,530
(% of AGI for various income ranges: 0.7% for AGIs $50k-75k, 0.3% for AGIs $100k-200k, 0.3% for AGIs over 200k)
Total itemized deductions: $30,285 (24% of AGI, reported on 47.2% of returns)
Here:
$30,285
State:
$34,004
Here:
24.3% of AGI
State:
22.7% of AGI
(% of AGI for various income ranges: 23.6% for AGIs below $25k, 17.8% for AGIs $25k-50k, 18.6% for AGIs $50k-75k, 19.3% for AGIs $75k-100k, 19.5% for AGIs $100k-200k, 17.5% for AGIs over 200k)
Charity contributions: $4,821 (reported on 41.0% of returns)
Here:
$4,821
State:
$4,659
(% of AGI for various income ranges: 1.4% for AGIs below $25k, 1.5% for AGIs $25k-50k, 1.9% for AGIs $50k-75k, 2.1% for AGIs $75k-100k, 2.3% for AGIs $100k-200k, 3.9% for AGIs over 200k)
Taxes paid: $11,564 (reported on 46.8% of returns)
95602:
$11,564
State:
$14,448
(% of AGI for various income ranges: 5.2% for AGIs below $25k, 4.0% for AGIs $25k-50k, 5.3% for AGIs $50k-75k, 6.4% for AGIs $75k-100k, 7.8% for AGIs $100k-200k, 8.6% for AGIs over 200k)
Earned income credit: $1,892 (reported on 11.4% of returns)
Here:
$1,892
State:
$2,286
(% of AGI for various income ranges: 4.0% for AGIs below $25k, 0.7% for AGIs $25k-50k)
Percentage of individuals using paid preparers for their 2012 taxes: 60.0%
Here:
60%
State:
64%
(% for various income ranges: 49.6% for AGIs below $25k, 60.8% for AGIs $25k-50k, 61.8% for AGIs $50k-75k, 65.1% for AGIs $75k-100k, 68.2% for AGIs $100k-200k, 82.9% for AGIs over 200k)
Averages for the 2004 tax year for zip code 95602, filed in 2005:
Average Adjusted Gross Income (AGI) in 2004: $61,852 (Individual Income Tax Returns)
Here:
$61,852
State:
$58,600
Salary/wage: $50,159 (reported on 70.6% of returns)
Here:
$50,159
State:
$49,455
(% of AGI for various income ranges: 366.9% for AGIs below $10k, 57.3% for AGIs $10k-25k, 58.3% for AGIs $25k-50k, 59.3% for AGIs $50k-75k, 62.3% for AGIs $75k-100k, 53.3% for AGIs over 100k)
Taxable interest for individuals: $2,805 (reported on 62.9% of returns)
This zip code:
$2,805
California:
$2,365
(% of AGI for various income ranges: 44.5% for AGIs below $10k, 4.7% for AGIs $10k-25k, 3.3% for AGIs $25k-50k, 2.2% for AGIs $50k-75k, 2.2% for AGIs $75k-100k, 2.7% for AGIs over 100k)
Taxable dividends: $4,129 (reported on 39.0% of returns)
Here:
$4,129
State:
$4,746
(% of AGI for various income ranges: 32.1% for AGIs below $10k, 4.4% for AGIs $10k-25k, 2.8% for AGIs $25k-50k, 2.3% for AGIs $50k-75k, 2.3% for AGIs $75k-100k, 2.4% for AGIs over 100k)
Net capital gain/loss: +$15,983 (reported on 33.6% of returns)
Here:
+$15,983
State:
+$23,418
(% of AGI for various income ranges: 62.7% for AGIs below $10k, -0.8% for AGIs $10k-25k, 0.8% for AGIs $25k-50k, 2.1% for AGIs $50k-75k, 2.3% for AGIs $75k-100k, 14.8% for AGIs over 100k)
Profit/loss from business: +$22,395 (reported on 20.9% of returns)
Here:
+$22,395
State:
+$16,826
(% of AGI for various income ranges: 5.1% for AGIs below $10k, 8.6% for AGIs $10k-25k, 7.8% for AGIs $25k-50k, 6.9% for AGIs $50k-75k, 6.7% for AGIs $75k-100k, 7.8% for AGIs over 100k)
IRA payment deduction: $3,496 (reported on 3.7% of returns)
95602:
$3,496
California:
$3,192
(% of AGI for various income ranges: 1.4% for AGIs below $10k, 0.3% for AGIs $10k-25k, 0.4% for AGIs $25k-50k, 0.3% for AGIs $50k-75k, 0.2% for AGIs $75k-100k, 0.1% for AGIs over 100k)
Self-employed pension: $13,544 (reported on 2.5% of returns)
Here:
$13,544
California:
$17,688
(% of AGI for various income ranges: 0.4% for AGIs $10k-25k, 0.2% for AGIs $25k-50k, 0.4% for AGIs $50k-75k, 0.5% for AGIs $75k-100k, 0.7% for AGIs over 100k)
Total itemized deductions: $25,920 (26% of AGI, reported on 50.2% of returns)
Here:
$25,920
State:
$28,113
Here:
26.3% of AGI
State:
25.3% of AGI
(% of AGI for various income ranges: 122.0% for AGIs below $10k, 22.7% for AGIs $10k-25k, 20.8% for AGIs $25k-50k, 23.1% for AGIs $50k-75k, 22.8% for AGIs $75k-100k, 19.2% for AGIs over 100k)
Charity contributions deductions: $3,591 (4% of AGI, reported on 45.8% of returns)
Here:
$3,591
State:
$3,923
Here:
3.5% of AGI
State:
3.3% of AGI
(% of AGI for various income ranges: 5.5% for AGIs below $10k, 1.8% for AGIs $10k-25k, 1.9% for AGIs $25k-50k, 2.6% for AGIs $50k-75k, 2.6% for AGIs $75k-100k, 2.9% for AGIs over 100k)
Total tax: $9,725 (reported on 80.4% of returns)
95602:
$9,725
State:
$10,761
(% of AGI for various income ranges: 17.0% for AGIs below $10k, 4.6% for AGIs $10k-25k, 6.9% for AGIs $25k-50k, 8.7% for AGIs $50k-75k, 10.0% for AGIs $75k-100k, 16.6% for AGIs over 100k)
Earned income credit: $1,476 (reported on 7.9% of returns)
Here:
$1,476
State:
$1,763
Percentage of individuals using paid preparers for their 2004 taxes: 64.9%
Here:
65%
State:
66%
(% for various income ranges: 51.3% for AGIs below $10k, 61.0% for AGIs $10k-25k, 67.5% for AGIs $25k-50k, 66.6% for AGIs $50k-75k, 69.1% for AGIs $75k-100k, 75.7% for AGIs over 100k)
Likely homosexual households (counted as self-reported same-sex unmarried-partner households)
Lesbian couples: 0.1% of all households
Gay men: 0.1% of all households
Household received Food Stamps/SNAP in the past 12 months: 401 Household did not receive Food Stamps/SNAP in the past 12 months: 6,935
Women who had a birth in the past 12 months: 59 (58 now married, 0 unmarried) Women who did not have a birth in the past 12 months: 2,704 (1,428 now married, 1,260 unmarried)
Housing units in zip code 95602 with a mortgage: 3,873 (341 second mortgage, 73 home equity loan, 249 both second mortgage and home equity loan) Houses without a mortgage: 32
Median monthly owner costs for units with a mortgage: $2,550 Median monthly owner costs for units without a mortgage: $1,039
Residents with income below the poverty level in 2022:
This zip code:
8.8%
Whole state:
12.2%
Residents with income below 50% of the poverty level in 2022:
This zip code:
3.9%
Whole state:
6.2%
Median number of rooms in houses and condos:
Here:
6.2
State:
6.0
Median number of rooms in apartments:
Here:
4.1
State:
3.9
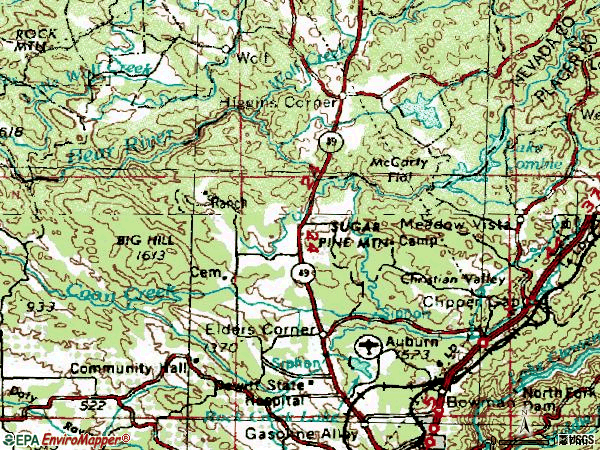
Notable locations in this zip code not listed on our city pages
Notable locations in zip code 95602: Cranston Ranch (A), Mount Vernon Grange (B), Hotaling (C), Ridge Golf Course (D), Black Oak Golf Course (E), Placer County Fire Department Station 184 Lone Star (F). Display/hide their locations on the map
1,874 married couples with children.
520 single-parent households (377 men, 143 women).
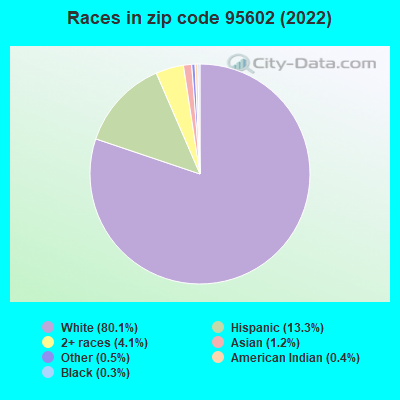
91.2% of residents of 95602 zip code speak English at home.
6.3% of residents speak Spanish at home (37% very well, 21% well, 24% not well, 18% not at all).
1.7% of residents speak other Indo-European language at home (92% very well, 4% not well, 4% not at all).
0.8% of residents speak Asian or Pacific Island language at home (87% very well, 7% well, 6% not well).
0.2% of residents speak other language at home (100% very well).
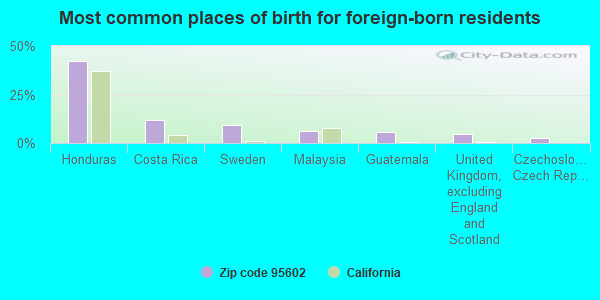
Foreign born population: 1,332 (7.2%) (39.3% of them are naturalized citizens)
This zip code:
7.2%
Whole state:
26.7%
42%Honduras
12%Costa Rica
9%Sweden
6%Malaysia
5%Guatemala
5%United Kingdom, excluding England and Scotland
2%Czechoslovakia (includes Czech Republic and Slovakia)
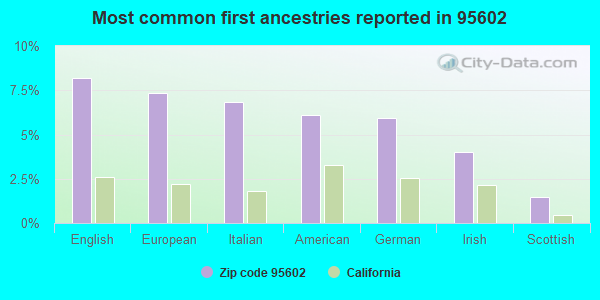
8%English
7%European
7%Italian
6%American
6%German
4%Irish
1%Scottish
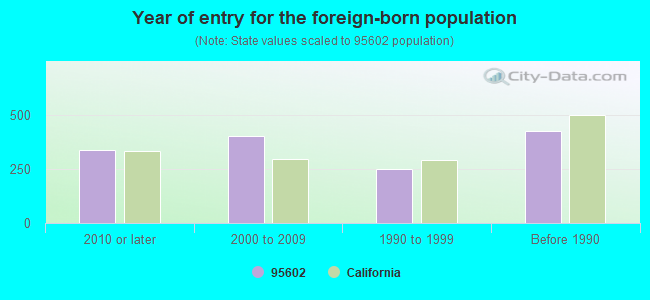
Year of entry for the foreign-born population
3382010 or later
4022000 to 2009
2501990 to 1999
427Before 1990
Facilities with environmental interests located in this zip code:
ADVANCED METAL FINISHING LLC (12972 EARHART AVE STE 301 in AUBURN, CA)
STATE MASTER (California - Hazardous Waste Tracking) - HAZARDOU WASTE PROGRAM National Pollutant Discharge Elimination System NON-MAJOR (Tracking pollutant discharge elimination systems) - permit Small Quantity Generators, between 100 kg and 1000 kg of hazardous waste/month (Resource Conservation and Recovery Act (tracking hazardous waste)) - notification Business SIC classification: SCREW MACHINE PRODUCTS Organizations: MICHAEL VON REMBOW (CONTACT/OWNER)
CARPENTER ADVANCED CERAMICS (13395 NEW AIRPORT ROAD in AUBURN, CA)
(Integrated Compliance Information System) - ICIS-09-2003-0197, FORMAL ENFORCEMENT ACTION Small Quantity Generators, between 100 kg and 1000 kg of hazardous waste/month (Resource Conservation and Recovery Act (tracking hazardous waste)) - notification Business SIC classification: NONCLAY REFRACTORIES Organizations: AUBURN CITY OF (CONTACT/OWNER)
Alternative names: FINE PARTICLE TECHNOLOGY CORP
MAIDU HIGH (ALT) (3775 RICHARDSON DR. in AUBURN, CA)
(National Center for Education Statistics) - STATE ID-3130135 Organizations: PLACER UNION HIGH (SCHOOL DISTRICT)
CHANA HIGH (CONT.) (3775 RICHARDSON DR. in AUBURN, CA)
(National Center for Education Statistics) - STATE ID-3131687 Organizations: PLACER UNION HIGH (SCHOOL DISTRICT)
NEVADA IRRIGATION DIST (SHALE RIDGE LN in AUBURN, CA)
Large Quantity Generators, more that 1000 kg of hazardous waste/month (Resource Conservation and Recovery Act (tracking hazardous waste)) - notification
CERONIX (13350 NEW AIRPORT ROAD in AUBURN, CA)
National Pollutant Discharge Elimination System NON-MAJOR (Tracking pollutant discharge elimination systems) - permit Business SIC classification: INDUSTRIAL AND COMMERCIAL MACHINERY AND EQUIPMENT
FUTURE ENVIRONMENTAL SERVICES (10556 COMBIE RD, #6250 in AUBURN, CA)
COMPLIANCE ACTIVITY (Tracking inspections of insecticide, fungicide, and rodenticide, and toxic substances)
Housing units lacking complete plumbing facilities: 1.0% Housing units lacking complete kitchen facilities: 2.3%
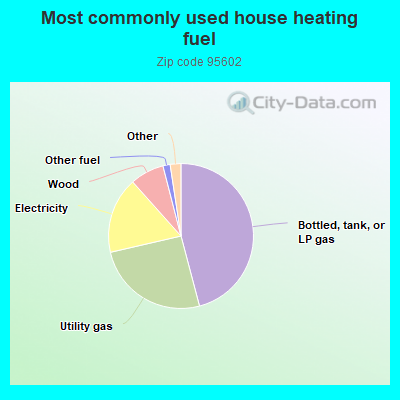
45.9%Bottled, tank, or LP gas
25.5%Utility gas
17.0%Electricity
7.6%Wood
1.6%Other fuel
0.9%Solar energy
0.8%No fuel used
0.7%Fuel oil, kerosene, etc.
Place of birth for U.S.-born residents:
This state: 12,528
Northeast: 735
Midwest: 1,678
South: 824
West: 1,172
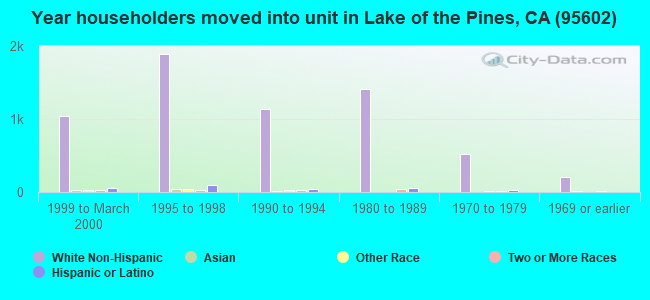
51% of the 95602 zip code residents lived in the same house 5 years ago. Out of people who lived in different houses, 38% lived in this county. Out of people who lived in different counties, 50% lived in California.
93% of the 95602 zip code residents lived in the same house 1 year ago. Out of people who lived in different houses, 47% moved from this county. Out of people who lived in different houses, 43% moved from different county within same state. Out of people who lived in different houses, 2% moved from different state. Out of people who lived in different houses, 11% moved from abroad.
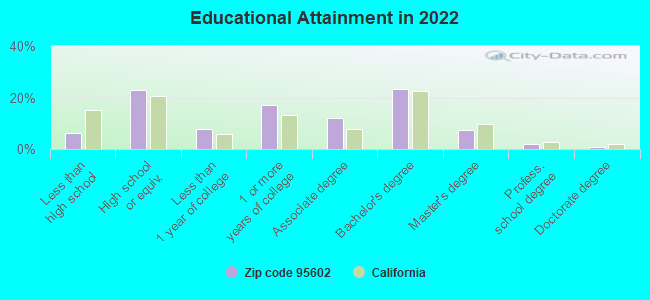
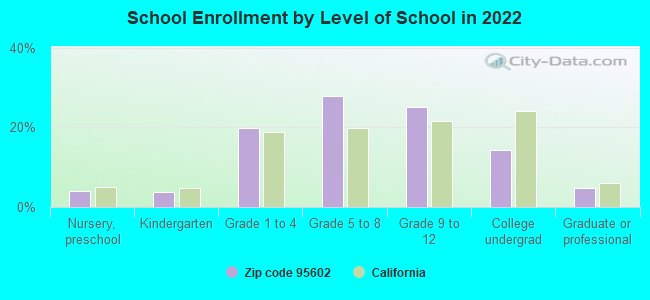
Private vs. public school enrollment:
Students in private schools in grades 1 to 8 (elementary and middle school): 341
Here:
23.1%
California:
10.5%
Students in private schools in grades 9 to 12 (high school): 223
Here:
28.8%
California:
8.5%
Students in private undergraduate colleges: 83
Here:
18.9%
California:
15.9%
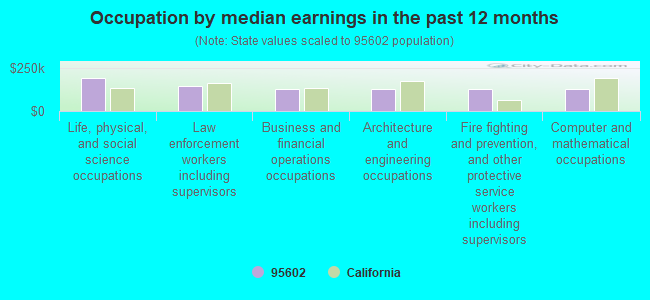
Occupation by median earnings in the past 12 months ($)
194,304Life, physical, and social science occupations
147,723Law enforcement workers including supervisors
131,688Business and financial operations occupations
131,451Architecture and engineering occupations
131,193Fire fighting and prevention, and other protective service workers including supervisors
130,159Computer and mathematical occupations
Companies with federal contracts located in this zip code:
FARINHA INC (12405 LOCKSLEY LANE in AUBURN, CA; small business) : $10,772,933 in 157 contractsfrom 1999 to 2004
Contracts for Maintenance, Repair or Alteration of Real Property -- Hospitals and Infirmaries, Construction of Structures and Facilities -- Other Non-Building Facilities, Hospital Buildings, Maintenance, Repair or Alteration of Real Property -- Recreational Buildings, and moreby Department of Veterans Affairs, Navy, Air Force, United States Coast Guard (disused code: now 7008), and others Signed by year:2000: $7,498,325; 2001: $432,383; 2002: -$124,675; 2003: -$23,451; 2004: -$9,473; 2005: $0; 2006: $0.
Biggest contracts:
$2,300,000 with Department of Veterans Affairs for Maintenance, Repair or Alteration of Real Property -- Hospitals and Infirmaries. Signed on 1999-10-15. Completion date: 2000-09-15.
$2,300,000, same as above.Signed on 2000-10-15. Completion date: 2000-10-15.
$2,244,029 with Navy for Construction of Structures and Facilities -- Other Non-Building Facilities. Signed on 2000-03-02. Completion date: 2001-03-12.
$1,663,367, same as above.Signed on 2000-02-16. Completion date: 2001-02-25.
VIRGIL AND JACQUELINE TRAYNOR (1055 GRASSBURRY HWY in AUBURN, CA; small business) 4 employees, $160000 revenue. : $1,083,659 in 58 contractsfrom 1999 to 2006
Contracts for Lease or Rental of Facilities -- Office Buildings by Public Buildings Service Signed by year:2000: $132,000; 2001: $134,000; 2002: $169,568; 2003: $316,537; 2004: $34,287; 2005: $148,977; 2006: $115,290.
Biggest contracts:
$34,000 with Public Buildings Service for Lease or Rental of Facilities -- Office Buildings. Signed on 2002-03-15. Completion date: 2002-03-15.
$34,000, same as above.Signed on 2002-06-15. Completion date: 2002-06-15.
$34,000, same as above.Signed on 2002-09-15. Completion date: 2002-09-15.
$34,000, same as above.Signed on 2001-12-15. Completion date: 2001-12-15.
THE GYRO HOUSE INC (2389 RICKENBACKER WAY in AUBURN, CA; small business) : $344,682 in 17 contractsfrom 2003 to 2006
Contracts for Engine Instruments, Maintenance, Repair and Rebuilding of Equipment -- Instruments and Laboratory Equipment, Knobs and Pointers, Mineral Construction Materials, Bulk, and moreby Air Force, Defense Logistics Agency, Navy Signed by year:2000: $0; 2001: $0; 2002: $0; 2003: $0; 2004: $46,580; 2005: $201,786; 2006: $96,316.
Biggest contracts:
$44,080 with Air Force for Engine Instruments. Signed on 2004-12-17. Completion date: 2010-02-19.
$43,358 with Air Force for Maintenance, Repair and Rebuilding of Equipment -- Instruments and Laboratory Equipment. Signed on 2005-12-29. Completion date: 2006-03-31.
$37,200 with Defense Logistics Agency for Knobs and Pointers. Signed on 2006-06-05. Completion date: 2006-12-30.
$36,366 with Air Force for Maintenance, Repair and Rebuilding of Equipment -- Instruments and Laboratory Equipment. Signed on 2005-09-21. Completion date: 2005-12-30.
PRECISION WELDING TECHNOLOGIES (6287 VIEWRIDGE DRIVE in AUBURN, CA; small business) : $129,321 in 6 contractsfrom 2003 to 2006
Contracts for Maintenance, Repair and Rebuilding of Equipment -- Metalworking Machinery, Maintenance, Repair and Rebuilding of Equipment -- Miscellaneous by Air Force Signed by year:2000: $0; 2001: $0; 2002: $0; 2003: $29,620; 2004: $33,000; 2005: $36,000; 2006: $30,701.
Biggest contracts:
$36,000 with Air Force for Maintenance, Repair and Rebuilding of Equipment -- Metalworking Machinery. Taking place in OK. Signed on 2005-02-10. Completion date: 2006-02-09.
$34,270, same as above.Signed on 2006-01-18. Completion date: 2007-01-22.
$33,000 with Air Force for Maintenance, Repair and Rebuilding of Equipment -- Miscellaneous. Taking place in OK. Signed on 2004-10-01. Completion date: 2005-09-30.
$29,620 with Air Force for Maintenance, Repair and Rebuilding of Equipment -- Metalworking Machinery. Taking place in OK. Signed on 2003-10-08. Completion date: 2004-09-09.
MYDAX INC (12260 SHALE RIDGE LN STE 4 in AUBURN, CA; small business) : $100,132 in 4 contractsfrom 2003 to 2006
$29,220 with Army for Refrigeration Equipment. Signed on 2006-03-29. Completion date: 2006-06-30.
$28,720 with Army for Refrigeration and Air Conditioning Components. Signed on 2004-06-14. Completion date: 2004-10-08.
$24,950 with Army for Refrigeration Equipment. Signed on 2003-09-10. Completion date: 2003-12-31.
$17,242 with NASA for . Signed on 2004-04-06. Completion date: 2004-04-17.
Health for all inc (4065 Grass Valley Highway in Auburn, CA; small business) : $63,798 in 5 contractsfrom 2001 to 2004
Contracts for Other Social Services by Department of Veterans Affairs Signed by year:2000: $0; 2001: $31,440; 2002: $13,980; 2003: $0; 2004: $18,378; 2005: $0; 2006: $0.
Biggest contracts:
$18,378 with Department of Veterans Affairs for Other Social Services. Signed on 2004-10-01. Completion date: 2005-09-30.
$16,440, same as above.Signed on 2001-10-01. Completion date: 2004-09-30.
$15,000, same as above.Signed on 2001-10-15. Completion date: 2004-09-15.
$13,980, same as above.Signed on 2002-10-15. Completion date: 2004-09-15.
MACHINERY MARKETING (3268 SUNSET TER in AUBURN, CA; small business) : $26,010 in 2 contractsin 2004
$24,120 with Army for Other Professional Services. Signed on 2004-01-26. Completion date: 2004-02-27.
$1,890, same as above.Signed on 2004-06-30. Completion date: 2004-07-23.
SOUTHWEST INTERIORS, INC (26115 TABLE MEADOW RD in AUBURN, CA; small business) : $8,611 in 5 contractsfrom 2002 to 2005
Contracts for Recreational and Gymnastic Equipment, Technical Representation Services -- Service and Trade Equipment, Maintenance, Repair and Rebuilding of Equipment -- Miscellaneous, Maintenance, Repair and Rebuilding of Equipment -- Recreational and Athletic Equipment by Army, Air Force Signed by year:2000: $0; 2001: $0; 2002: $3,300; 2003: $0; 2004: $0; 2005: $5,311; 2006: $0.
Biggest contracts:
$3,300 with Army for Recreational and Gymnastic Equipment. Signed on 2002-09-28. Completion date: 2002-10-31.
$1,692 with Air Force for Technical Representation Services -- Service and Trade Equipment. Signed on 2005-07-05. Completion date: 2005-07-05.
$1,369 with Air Force for Maintenance, Repair and Rebuilding of Equipment -- Miscellaneous. Signed on 2005-07-05. Completion date: 2005-07-05.
$1,250 with Air Force for Maintenance, Repair and Rebuilding of Equipment -- Recreational and Athletic Equipment. Signed on 2005-04-06. Completion date: 2005-04-06.
PUMP WORKS LLC (2409 RICKENBACKER WAY in AUBURN, CA; small business)
$4,408 with Navy for Power and Hand Pumps. Signed on 2005-01-04. Completion date: 2005-02-15.
Top industries in this zip code by the number of employees in 2005:
Wholesale Trade: Fresh Fruit and Vegetable Merchant Wholesalers (250-499 employees: 1 establishment)
Health Care and Social Assistance: Nursing Care Facilities (100-249: 1, 50-99: 1)
Arts, Entertainment, and Recreation: Golf Courses and Country Clubs (50-99: 1, 20-49: 4)
Health Care and Social Assistance: Offices of Physicians (except Mental Health Specialists) (10-19: 3, 5-9: 9, 1-4: 19)
Other Services (except Public Administration): Other Similar Organizations (except Business, Professional, Labor, and Political Organizations) (50-99: 1, 5-9: 1)
Educational Services: Elementary and Secondary Schools (50-99: 1)
Administrative and Support and Waste Management and Remediation Services: Solid Waste Collection (50-99: 1)
People in group quarters in 2010:
183 people in nursing facilities/skilled-nursing facilities
57 people in workers' group living quarters and job corps centers
45 people in group homes intended for adults
19 people in residential treatment centers for adults
People in group quarters in 2000:
299 people in nursing homes
297 people in local jails and other confinement facilities (including police lockups)
101 people in other noninstitutional group quarters
47 people in job corps and vocational training facilities
22 people in homes or halfway houses for drug/alcohol abuse
2 people in homes for the mentally retarded
Fatal accident statistics in 2014:
Fatal accident count: 3
Vehicles involved in fatal accidents: 5
Fatal accidents caused by drunken drivers: 1
Fatalities: 3
Persons involved in fatal accidents: 5
Pedestrians involved in fatal accidents: 1
Fatal accident statistics in 2013:
Fatal accident count: 3
Vehicles involved in fatal accidents: 5
Fatal accidents caused by drunken drivers: 2
Fatalities: 4
Persons involved in fatal accidents: 7
Pedestrians involved in fatal accidents: 1
Home Mortgage Disclosure Act Aggregated Statistics For Year 2009 (Based on 2 full and 6 partial tracts)
A) FHA, FSA/RHS & VA Home Purchase Loans
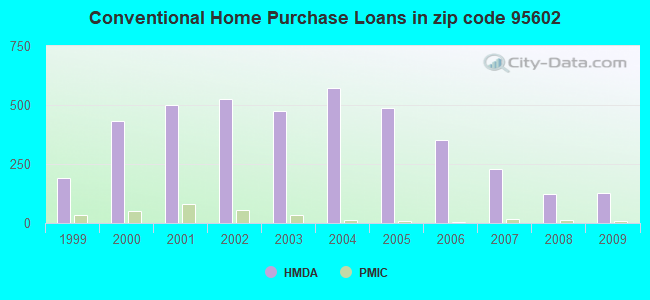
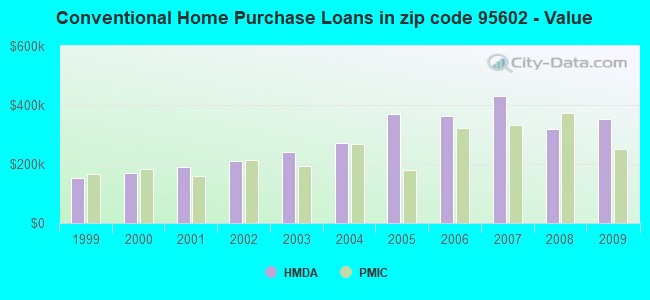
B) Conventional Home Purchase Loans
C) Refinancings
D) Home Improvement Loans
F) Non-occupant Loans on < 5 Family Dwellings (A B C & D)
G) Loans On Manufactured Home Dwelling (A B C & D)
Number
Average Value
Number
Average Value
Number
Average Value
Number
Average Value
Number
Average Value
Number
Average Value
LOANS ORIGINATED
51
$263,324
127
$353,670
714
$272,687
23
$226,010
49
$302,446
9
$166,936
APPLICATIONS APPROVED, NOT ACCEPTED
6
$361,883
16
$207,884
64
$283,128
5
$275,842
2
$75,970
3
$105,937
APPLICATIONS DENIED
9
$190,417
14
$580,836
242
$335,088
22
$139,543
16
$121,041
10
$112,667
APPLICATIONS WITHDRAWN
7
$315,080
14
$297,821
155
$339,184
10
$238,066
11
$199,573
4
$132,072
FILES CLOSED FOR INCOMPLETENESS
2
$242,670
7
$273,059
26
$230,637
0
$0
1
$355,390
0
$0
Aggregated Statistics For Year 2008 (Based on 2 full and 6 partial tracts)
A) FHA, FSA/RHS & VA Home Purchase Loans
B) Conventional Home Purchase Loans
C) Refinancings
D) Home Improvement Loans
E) Loans on Dwellings For 5+ Families
F) Non-occupant Loans on < 5 Family Dwellings (A B C & D)
G) Loans On Manufactured Home Dwelling (A B C & D)
Number
Average Value
Number
Average Value
Number
Average Value
Number
Average Value
Number
Average Value
Number
Average Value
Number
Average Value
LOANS ORIGINATED
8
$373,246
123
$317,454
347
$304,347
35
$183,665
1
$10,195,310
53
$259,571
6
$156,725
APPLICATIONS APPROVED, NOT ACCEPTED
4
$308,412
27
$292,546
66
$306,756
17
$63,662
0
$0
10
$164,568
4
$91,905
APPLICATIONS DENIED
8
$330,789
46
$294,287
185
$370,983
29
$297,861
2
$495,250
29
$157,972
7
$132,093
APPLICATIONS WITHDRAWN
2
$291,525
18
$239,133
92
$280,442
12
$161,992
1
$1,125,410
17
$317,848
0
$0
FILES CLOSED FOR INCOMPLETENESS
1
$277,860
3
$1,184,167
24
$441,493
7
$170,123
0
$0
1
$402,780
0
$0
Aggregated Statistics For Year 2007 (Based on 2 full and 6 partial tracts)
B) Conventional Home Purchase Loans
C) Refinancings
D) Home Improvement Loans
F) Non-occupant Loans on < 5 Family Dwellings (A B C & D)
G) Loans On Manufactured Home Dwelling (A B C & D)
Number
Average Value
Number
Average Value
Number
Average Value
Number
Average Value
Number
Average Value
LOANS ORIGINATED
229
$429,929
550
$352,676
123
$157,522
86
$296,633
14
$159,034
APPLICATIONS APPROVED, NOT ACCEPTED
41
$319,071
123
$352,371
17
$221,516
17
$262,824
12
$58,615
APPLICATIONS DENIED
88
$438,471
289
$437,438
69
$174,081
40
$431,714
24
$122,177
APPLICATIONS WITHDRAWN
26
$408,582
134
$306,193
11
$163,670
21
$191,799
4
$177,360
FILES CLOSED FOR INCOMPLETENESS
9
$597,101
64
$358,282
12
$280,232
5
$170,588
8
$213,809
Aggregated Statistics For Year 2006 (Based on 2 full and 6 partial tracts)
A) FHA, FSA/RHS & VA Home Purchase Loans
B) Conventional Home Purchase Loans
C) Refinancings
D) Home Improvement Loans
F) Non-occupant Loans on < 5 Family Dwellings (A B C & D)
G) Loans On Manufactured Home Dwelling (A B C & D)
Number
Average Value
Number
Average Value
Number
Average Value
Number
Average Value
Number
Average Value
Number
Average Value
LOANS ORIGINATED
0
$0
353
$364,269
722
$341,909
137
$174,225
115
$257,968
21
$116,524
APPLICATIONS APPROVED, NOT ACCEPTED
0
$0
66
$280,423
150
$396,396
22
$120,532
18
$316,691
7
$116,931
APPLICATIONS DENIED
0
$0
133
$381,345
333
$370,420
69
$185,903
30
$246,741
11
$37,447
APPLICATIONS WITHDRAWN
1
$358,350
58
$325,589
246
$321,456
38
$262,277
16
$287,634
3
$127,350
FILES CLOSED FOR INCOMPLETENESS
0
$0
17
$316,279
58
$344,009
2
$196,085
5
$358,042
0
$0
Aggregated Statistics For Year 2005 (Based on 2 full and 6 partial tracts)
A) FHA, FSA/RHS & VA Home Purchase Loans
B) Conventional Home Purchase Loans
C) Refinancings
D) Home Improvement Loans
E) Loans on Dwellings For 5+ Families
F) Non-occupant Loans on < 5 Family Dwellings (A B C & D)
G) Loans On Manufactured Home Dwelling (A B C & D)
Number
Average Value
Number
Average Value
Number
Average Value
Number
Average Value
Number
Average Value
Number
Average Value
Number
Average Value
LOANS ORIGINATED
2
$266,495
488
$370,384
1,038
$296,275
158
$209,868
0
$0
167
$251,625
17
$139,552
APPLICATIONS APPROVED, NOT ACCEPTED
1
$246,710
98
$390,824
172
$282,347
23
$154,833
0
$0
23
$151,333
5
$111,494
APPLICATIONS DENIED
2
$246,705
120
$342,748
294
$304,577
58
$150,330
2
$346,675
60
$148,443
18
$133,093
APPLICATIONS WITHDRAWN
0
$0
78
$311,950
298
$266,323
36
$159,794
0
$0
29
$215,814
5
$128,498
FILES CLOSED FOR INCOMPLETENESS
1
$202,870
39
$420,876
106
$303,939
3
$61,313
0
$0
28
$159,226
1
$303,120
Aggregated Statistics For Year 2004 (Based on 2 full and 6 partial tracts)
A) FHA, FSA/RHS & VA Home Purchase Loans
B) Conventional Home Purchase Loans
C) Refinancings
D) Home Improvement Loans
E) Loans on Dwellings For 5+ Families
F) Non-occupant Loans on < 5 Family Dwellings (A B C & D)
G) Loans On Manufactured Home Dwelling (A B C & D)
Number
Average Value
Number
Average Value
Number
Average Value
Number
Average Value
Number
Average Value
Number
Average Value
Number
Average Value
LOANS ORIGINATED
0
$0
573
$270,384
1,046
$254,335
97
$164,119
3
$6,624,113
178
$164,645
16
$161,016
APPLICATIONS APPROVED, NOT ACCEPTED
0
$0
97
$292,850
180
$238,916
16
$130,850
0
$0
32
$130,368
9
$146,141
APPLICATIONS DENIED
1
$417,590
139
$291,031
323
$274,535
44
$92,702
0
$0
61
$164,658
17
$169,924
APPLICATIONS WITHDRAWN
0
$0
92
$252,467
305
$250,620
36
$135,089
0
$0
33
$124,085
6
$234,698
FILES CLOSED FOR INCOMPLETENESS
0
$0
29
$317,459
108
$285,047
6
$179,020
0
$0
3
$139,197
2
$272,115
Aggregated Statistics For Year 2003 (Based on 2 full and 6 partial tracts)
A) FHA, FSA/RHS & VA Home Purchase Loans
B) Conventional Home Purchase Loans
C) Refinancings
D) Home Improvement Loans
F) Non-occupant Loans on < 5 Family Dwellings (A B C & D)
Number
Average Value
Number
Average Value
Number
Average Value
Number
Average Value
Number
Average Value
LOANS ORIGINATED
2
$122,510
476
$239,340
2,162
$213,023
76
$43,721
204
$150,828
APPLICATIONS APPROVED, NOT ACCEPTED
1
$71,080
75
$214,013
265
$237,004
18
$28,421
21
$201,531
APPLICATIONS DENIED
0
$0
96
$237,415
336
$240,408
54
$35,802
42
$176,430
APPLICATIONS WITHDRAWN
0
$0
75
$214,380
393
$220,680
7
$24,913
19
$158,351
FILES CLOSED FOR INCOMPLETENESS
0
$0
20
$255,646
54
$235,142
3
$109,350
4
$92,730
Aggregated Statistics For Year 2002 (Based on 2 full and 6 partial tracts)
A) FHA, FSA/RHS & VA Home Purchase Loans
B) Conventional Home Purchase Loans
C) Refinancings
D) Home Improvement Loans
F) Non-occupant Loans on < 5 Family Dwellings (A B C & D)
Number
Average Value
Number
Average Value
Number
Average Value
Number
Average Value
Number
Average Value
LOANS ORIGINATED
9
$121,483
524
$210,761
1,648
$214,941
84
$48,641
171
$130,744
APPLICATIONS APPROVED, NOT ACCEPTED
1
$300,600
91
$223,092
178
$219,832
14
$28,310
18
$167,963
APPLICATIONS DENIED
3
$127,350
80
$163,781
317
$194,222
43
$45,007
19
$125,893
APPLICATIONS WITHDRAWN
0
$0
78
$211,166
280
$214,050
16
$77,162
16
$151,020
FILES CLOSED FOR INCOMPLETENESS
1
$119,940
10
$154,596
55
$222,055
1
$84,200
8
$104,160
Aggregated Statistics For Year 2001 (Based on 2 full and 6 partial tracts)
A) FHA, FSA/RHS & VA Home Purchase Loans
B) Conventional Home Purchase Loans
C) Refinancings
D) Home Improvement Loans
E) Loans on Dwellings For 5+ Families
F) Non-occupant Loans on < 5 Family Dwellings (A B C & D)
Number
Average Value
Number
Average Value
Number
Average Value
Number
Average Value
Number
Average Value
Number
Average Value
LOANS ORIGINATED
15
$135,633
498
$189,035
1,240
$188,166
69
$54,613
1
$9,773,280
123
$125,992
APPLICATIONS APPROVED, NOT ACCEPTED
3
$57,750
69
$158,569
117
$198,022
17
$133,804
0
$0
14
$52,884
APPLICATIONS DENIED
5
$113,290
82
$216,288
259
$199,904
22
$52,454
0
$0
24
$103,144
APPLICATIONS WITHDRAWN
3
$67,623
64
$212,972
209
$187,691
20
$31,220
1
$177,700
5
$69,834
FILES CLOSED FOR INCOMPLETENESS
1
$100,690
17
$261,207
73
$194,744
5
$143,836
0
$0
5
$71,440
Aggregated Statistics For Year 2000 (Based on 2 full and 6 partial tracts)
A) FHA, FSA/RHS & VA Home Purchase Loans
B) Conventional Home Purchase Loans
C) Refinancings
D) Home Improvement Loans
F) Non-occupant Loans on < 5 Family Dwellings (A B C & D)
Number
Average Value
Number
Average Value
Number
Average Value
Number
Average Value
Number
Average Value
LOANS ORIGINATED
15
$100,486
433
$170,183
309
$148,937
105
$41,114
73
$102,237
APPLICATIONS APPROVED, NOT ACCEPTED
2
$86,700
60
$130,875
82
$135,571
22
$70,080
13
$77,986
APPLICATIONS DENIED
5
$66,252
110
$114,198
164
$125,644
19
$38,941
33
$93,816
APPLICATIONS WITHDRAWN
1
$68,120
65
$157,868
76
$128,890
9
$36,418
6
$144,923
FILES CLOSED FOR INCOMPLETENESS
0
$0
19
$158,501
26
$121,182
0
$0
6
$148,825
Aggregated Statistics For Year 1999 (Based on 1 full and 3 partial tracts)
A) FHA, FSA/RHS & VA Home Purchase Loans
B) Conventional Home Purchase Loans
C) Refinancings
D) Home Improvement Loans
E) Loans on Dwellings For 5+ Families
F) Non-occupant Loans on < 5 Family Dwellings (A B C & D)
2005 - 2018 National Fire Incident Reporting System (NFIRS) incidents
According to the data from the years 2005 - 2018 the average number of fires per year is 37. The highest number of reported fires - 58 took place in 2014, and the least - 6 in 2006. The data has a growing trend.
When looking into fire subcategories, the most reports belonged to: Outside Fires (55.4%), and Structure Fires (23.6%).
Fire incident types reported to NFIRS in Zip Code 95602


 Nearest zip codes: 95603, 95722, 95949, 95658, 95703, 95736.
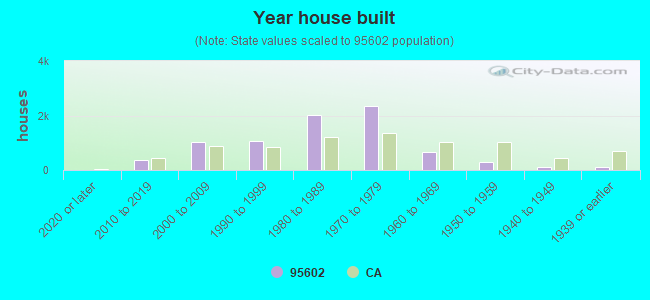


 According to the data from the years 2005 - 2018 the average number of fires per year is 37. The highest number of reported fires - 58 took place in 2014, and the least - 6 in 2006. The data has a growing trend.
 When looking into fire subcategories, the most reports belonged to: Outside Fires (55.4%), and Structure Fires (23.6%).