Estimated zip code population in 2022: 1,213 Zip code population in 2010: 1,305 Zip code population in 2000: 751
Houses and condos: 1,861 Renter-occupied apartments: 45
% of renters here:
7%
State:
44%
March 2022 cost of living index in zip code 95497: 113.4 (more than average, U.S. average is 100)
Land area: 16.2 sq. mi. Water area: 0.1 sq. mi.
Population density: 75 people per square mile
(very low).
OSM Map
General Map
Google Map
MSN Map
OSM Map
General Map
Google Map
MSN Map
OSM Map
General Map
Google Map
MSN Map
OSM Map
General Map
Google Map
MSN Map
Please wait while loading the map...
Real estate property taxes paid for housing units in 2022:
This zip code:
0.6% ($7,392)
California:
0.7% ($4,831)
Median real estate property taxes paid for housing units with mortgages in 2022: $10,252 (0.7%) Median real estate property taxes paid for housing units with no mortgage in 2022: $6,270 (0.6%)
Business Search- 14 Million verified businesses
Males: 623
(51.4%)
Females: 590
(48.6%)
For population 25 years and over in 95497:
High school or higher: 98.9%
Bachelor's degree or higher: 75.9%
Graduate or professional degree: 49.0%
Unemployed: 2.8%
Mean travel time to work (commute): 54.8 minutes
For population 15 years and over in 95497:
Never married: 8.5%
Now married: 64.8%
Separated: 0.0%
Widowed: 13.2%
Divorced: 13.4%
Zip code 95497 compared to state average:
Median house value above state average.
Unemployed percentage below state average.
Black race population percentage significantly below state average.
Hispanic race population percentage significantly below state average.
Median age significantly above state average.
Foreign-born population percentage below state average.
Renting percentage significantly below state average.
Length of stay since moving in above state average.
House age below state average.
Number of college students significantly below state average.
Percentage of population with a bachelor's degree or higher significantly above state average.
Estimated median house/condo value in 2022: $1,199,646
95497:
$1,199,646
California:
$715,900
Median resident age:
This zip code:
69.0 years
California median age:
37.9 years
Average household size:
This zip code:
1.9 people
California:
2.8 people
Averages for the 2004 tax year for zip code 95497, filed in 2005:
Average Adjusted Gross Income (AGI) in 2004: $104,620 (Individual Income Tax Returns)
Here:
$104,620
State:
$58,600
Salary/wage: $50,891 (reported on 43.1% of returns)
Here:
$50,891
State:
$49,455
(% of AGI for various income ranges: 24.4% for AGIs $10k-25k, 24.9% for AGIs $25k-50k, 19.8% for AGIs $50k-75k, 30.4% for AGIs $75k-100k, 19.7% for AGIs over 100k)
Taxable interest for individuals: $3,889 (reported on 81.2% of returns)
This zip code:
$3,889
California:
$2,365
(% of AGI for various income ranges: 15.8% for AGIs below $10k, 12.8% for AGIs $10k-25k, 6.3% for AGIs $25k-50k, 4.3% for AGIs $50k-75k, 1.9% for AGIs $75k-100k, 2.4% for AGIs over 100k)
Taxable dividends: $10,988 (reported on 67.5% of returns)
Here:
$10,988
State:
$4,746
(% of AGI for various income ranges: 12.6% for AGIs below $10k, 9.7% for AGIs $10k-25k, 11.9% for AGIs $25k-50k, 10.7% for AGIs $50k-75k, 4.1% for AGIs $75k-100k, 6.5% for AGIs over 100k)
Net capital gain/loss: +$30,172 (reported on 59.2% of returns)
Here:
+$30,172
State:
+$23,418
(% of AGI for various income ranges: -28.4% for AGIs below $10k, 0.9% for AGIs $10k-25k, 1.8% for AGIs $25k-50k, -0.3% for AGIs $50k-75k, 0.0% for AGIs $75k-100k, 22.7% for AGIs over 100k)
Profit/loss from business: +$42,490 (reported on 38.4% of returns)
Here:
+$42,490
State:
+$16,826
(% of AGI for various income ranges: 105.3% for AGIs below $10k, 3.8% for AGIs $25k-50k, 23.7% for AGIs $75k-100k, 17.4% for AGIs over 100k)
Self-employed pension: $24,737 (reported on 7.5% of returns)
Here:
$24,737
California:
$17,688
Total itemized deductions: $34,751 (26% of AGI, reported on 71.0% of returns)
Here:
$34,751
State:
$28,113
Here:
26.3% of AGI
State:
25.3% of AGI
(% of AGI for various income ranges: 97.1% for AGIs $10k-25k, 31.9% for AGIs $25k-50k, 35.1% for AGIs $50k-75k, 21.4% for AGIs $75k-100k, 20.0% for AGIs over 100k)
Charity contributions deductions: $7,315 (5% of AGI, reported on 64.7% of returns)
Here:
$7,315
State:
$3,923
Here:
5.3% of AGI
State:
3.3% of AGI
(% of AGI for various income ranges: 4.0% for AGIs $10k-25k, 2.1% for AGIs $25k-50k, 3.5% for AGIs $50k-75k, 2.1% for AGIs $75k-100k, 5.2% for AGIs over 100k)
Total tax: $21,047 (reported on 83.9% of returns)
95497:
$21,047
State:
$10,761
(% of AGI for various income ranges: 6.8% for AGIs $10k-25k, 8.6% for AGIs $25k-50k, 8.7% for AGIs $50k-75k, 14.2% for AGIs $75k-100k, 19.1% for AGIs over 100k)
Percentage of individuals using paid preparers for their 2004 taxes: 72.9%
Here:
73%
State:
66%
(% for various income ranges: 67.7% for AGIs below $10k, 69.7% for AGIs $10k-25k, 72.7% for AGIs $25k-50k, 72.4% for AGIs $50k-75k, 62.5% for AGIs $75k-100k, 79.5% for AGIs over 100k)
Household received Food Stamps/SNAP in the past 12 months: 15 Household did not receive Food Stamps/SNAP in the past 12 months: 624
Women who had a birth in the past 12 months: 10 (10 now married, 0 unmarried) Women who did not have a birth in the past 12 months: 26 (25 now married, 0 unmarried)
Housing units in zip code 95497 with a mortgage: 261 (29 second mortgage, 11 home equity loan, 20 both second mortgage and home equity loan) Houses without a mortgage: 32
Median monthly owner costs for units with a mortgage: $3,170 Median monthly owner costs for units without a mortgage: $1,113
Residents with income below the poverty level in 2022:
This zip code:
11.7%
Whole state:
12.2%
Residents with income below 50% of the poverty level in 2022:
This zip code:
5.4%
Whole state:
6.2%
Median number of rooms in houses and condos:
Here:
5.1
State:
6.0
Median number of rooms in apartments:
Here:
4.1
State:
3.9
Notable locations in this zip code not listed on our city pages
Notable locations in zip code 95497: Del Mar Landing (A), Black Point Landing (B), Sea Ranch Volunteer Fire Department North Station (C), Department of Forestry and Fire Protection The Sea Ranch Station (D), Sea Ranch Volunteer Fire Department South Station (E). Display/hide their locations on the map
Size of family households: 334 2-persons, 53 3-persons, 13 4-persons, 13 5-persons
Size of nonfamily households: 221 1-person, 25 2-persons
41 married couples with children.
30 single-parent households (30 men).
90.0% of residents of 95497 zip code speak English at home.
5.4% of residents speak Spanish at home (23% very well, 42% well, 35% not well).
3.5% of residents speak other Indo-European language at home (100% very well).
3.3% of residents speak Asian or Pacific Island language at home (68% very well, 32% well).
Foreign born population: 180 (14.9%) (46.3% of them are naturalized citizens)
This zip code:
14.9%
Whole state:
26.7%
37%Honduras
21%Malaysia
8%Romania
6%Netherlands
5%Taiwan
16%English
11%Italian
10%European
7%German
6%British
5%Canadian
4%Irish
Year of entry for the foreign-born population
1152010 or later
272000 to 2009
251990 to 1999
83Before 1990
Housing units lacking complete plumbing facilities: 0.8% Housing units lacking complete kitchen facilities: 0.8%
58.6%Bottled, tank, or LP gas
16.6%Utility gas
12.0%Electricity
4.5%Wood
3.8%Fuel oil, kerosene, etc.
3.0%Solar energy
2.0%Other fuel
Population in 1990: 576. Population change in the 1990s: +175 (+30.4%).
Place of birth for U.S.-born residents:
This state: 403
Northeast: 113
Midwest: 243
South: 98
West: 95
49% of the 95497 zip code residents lived in the same house 5 years ago. Out of people who lived in different houses, 18% lived in this county. Out of people who lived in different counties, 50% lived in California.
89% of the 95497 zip code residents lived in the same house 1 year ago. Out of people who lived in different houses, 72% moved from different county within same state. Out of people who lived in different houses, 32% moved from different state.
Private vs. public school enrollment:
Students in private schools in grades 1 to 8 (elementary and middle school):
Here:
0.0%
California:
10.5%
Students in private schools in grades 9 to 12 (high school):
Here:
0.0%
California:
8.5%
Occupation by median earnings in the past 12 months ($)
100,308Management occupations
45,626Sales and related occupations
3,899Education, training, and library occupations
3,515Arts, design, entertainment, sports, and media occupations
Top industries in this zip code by the number of employees in 2005:
Other Services (except Public Administration): Other Similar Organizations (except Business, Professional, Labor, and Political Organizations) (50-99 employees: 1 establishment, 1-4 employees: 1 establishment)
Accommodation and Food Services: Hotels (except Casino Hotels) and Motels (50-99: 1)
Finance and Insurance: Real Estate Credit (20-49: 1)
Construction: New Single-Family Housing Construction (except Operative Builders) (5-9: 3, 1-4: 4)
Real Estate and Rental and Leasing: Offices of Real Estate Agents and Brokers (10-19: 1, 1-4: 1)
Arts, Entertainment, and Recreation: Golf Courses and Country Clubs (10-19: 1)
Real Estate and Rental and Leasing: Lessors of Residential Buildings and Dwellings (5-9: 1)
Professional, Scientific, and Technical Services: Architectural Services (1-4: 1)
Health Care and Social Assistance: Offices of Physical, Occupational and Speech Therapists, and Audiologists (1-4: 1)
Fatal accident statistics in 2014:
Fatal accident count: 1
Vehicles involved in fatal accidents: 1
Fatal accidents caused by drunken drivers: 0
Fatalities: 3
Persons involved in fatal accidents: 3
Pedestrians involved in fatal accidents: 0
Fatal accident statistics in 2012:
Fatal accident count: 1
Vehicles involved in fatal accidents: 1
Fatal accidents caused by drunken drivers: 0
Fatalities: 1
Persons involved in fatal accidents: 1
Pedestrians involved in fatal accidents: 0
Home Mortgage Disclosure Act Aggregated Statistics For Year 2009 (Based on 2 partial tracts)
B) Conventional Home Purchase Loans
C) Refinancings
F) Non-occupant Loans on < 5 Family Dwellings (A B C & D)
Number
Average Value
Number
Average Value
Number
Average Value
LOANS ORIGINATED
2
$485,415
11
$321,949
8
$380,639
APPLICATIONS APPROVED, NOT ACCEPTED
0
$0
1
$431,300
1
$340,900
APPLICATIONS DENIED
1
$260,490
3
$333,133
2
$358,425
APPLICATIONS WITHDRAWN
0
$0
1
$520,870
1
$314,270
FILES CLOSED FOR INCOMPLETENESS
0
$0
0
$0
0
$0
Aggregated Statistics For Year 2008 (Based on 2 partial tracts)
B) Conventional Home Purchase Loans
C) Refinancings
F) Non-occupant Loans on < 5 Family Dwellings (A B C & D)
Number
Average Value
Number
Average Value
Number
Average Value
LOANS ORIGINATED
2
$502,655
4
$338,378
4
$422,180
APPLICATIONS APPROVED, NOT ACCEPTED
0
$0
0
$0
0
$0
APPLICATIONS DENIED
0
$0
2
$368,390
1
$443,640
APPLICATIONS WITHDRAWN
0
$0
1
$345,390
1
$208,430
FILES CLOSED FOR INCOMPLETENESS
0
$0
0
$0
0
$0
Aggregated Statistics For Year 2007 (Based on 2 partial tracts)
B) Conventional Home Purchase Loans
C) Refinancings
D) Home Improvement Loans
F) Non-occupant Loans on < 5 Family Dwellings (A B C & D)
Number
Average Value
Number
Average Value
Number
Average Value
Number
Average Value
LOANS ORIGINATED
3
$627,483
5
$387,478
1
$209,220
4
$547,040
APPLICATIONS APPROVED, NOT ACCEPTED
1
$299,500
0
$0
0
$0
1
$321,450
APPLICATIONS DENIED
1
$297,780
2
$351,430
0
$0
1
$236,700
APPLICATIONS WITHDRAWN
1
$253,720
1
$406,540
0
$0
1
$263,670
FILES CLOSED FOR INCOMPLETENESS
0
$0
0
$0
0
$0
0
$0
Aggregated Statistics For Year 2006 (Based on 2 partial tracts)
B) Conventional Home Purchase Loans
C) Refinancings
D) Home Improvement Loans
F) Non-occupant Loans on < 5 Family Dwellings (A B C & D)
Number
Average Value
Number
Average Value
Number
Average Value
Number
Average Value
LOANS ORIGINATED
4
$508,398
6
$393,523
1
$225,600
5
$501,930
APPLICATIONS APPROVED, NOT ACCEPTED
1
$338,100
1
$361,210
0
$0
1
$227,170
APPLICATIONS DENIED
1
$419,070
2
$584,020
0
$0
1
$487,730
APPLICATIONS WITHDRAWN
1
$245,310
1
$454,520
0
$0
1
$220,510
FILES CLOSED FOR INCOMPLETENESS
0
$0
0
$0
0
$0
0
$0
Aggregated Statistics For Year 2005 (Based on 2 partial tracts)
B) Conventional Home Purchase Loans
C) Refinancings
F) Non-occupant Loans on < 5 Family Dwellings (A B C & D)
Number
Average Value
Number
Average Value
Number
Average Value
LOANS ORIGINATED
5
$419,882
8
$328,989
6
$387,445
APPLICATIONS APPROVED, NOT ACCEPTED
1
$289,960
1
$579,890
1
$341,540
APPLICATIONS DENIED
2
$316,310
2
$413,305
1
$563,430
APPLICATIONS WITHDRAWN
1
$340,530
1
$240,260
0
$0
FILES CLOSED FOR INCOMPLETENESS
0
$0
0
$0
0
$0
Aggregated Statistics For Year 2004 (Based on 2 partial tracts)
B) Conventional Home Purchase Loans
C) Refinancings
F) Non-occupant Loans on < 5 Family Dwellings (A B C & D)
Number
Average Value
Number
Average Value
Number
Average Value
LOANS ORIGINATED
7
$392,316
10
$320,496
9
$378,322
APPLICATIONS APPROVED, NOT ACCEPTED
1
$308,700
1
$454,410
1
$244,330
APPLICATIONS DENIED
1
$354,850
2
$340,170
1
$319,360
APPLICATIONS WITHDRAWN
1
$296,880
1
$332,110
0
$0
FILES CLOSED FOR INCOMPLETENESS
0
$0
1
$262,290
0
$0
Aggregated Statistics For Year 2003 (Based on 2 partial tracts)
B) Conventional Home Purchase Loans
C) Refinancings
F) Non-occupant Loans on < 5 Family Dwellings (A B C & D)
Number
Average Value
Number
Average Value
Number
Average Value
LOANS ORIGINATED
5
$379,078
22
$248,101
12
$306,795
APPLICATIONS APPROVED, NOT ACCEPTED
1
$320,930
2
$282,240
1
$337,460
APPLICATIONS DENIED
1
$241,940
3
$265,990
1
$257,270
APPLICATIONS WITHDRAWN
0
$0
3
$242,403
1
$216,960
FILES CLOSED FOR INCOMPLETENESS
0
$0
0
$0
0
$0
Aggregated Statistics For Year 1999 (Based on 1 partial tract)
B) Conventional Home Purchase Loans
C) Refinancings
F) Non-occupant Loans on < 5 Family Dwellings (A B C & D)

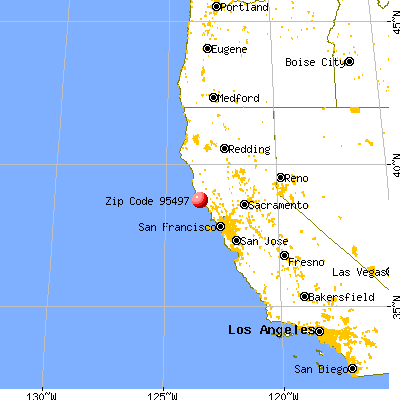


 Nearest zip codes: 95445, 95412, 95494, 95468, 95459, 95415.


