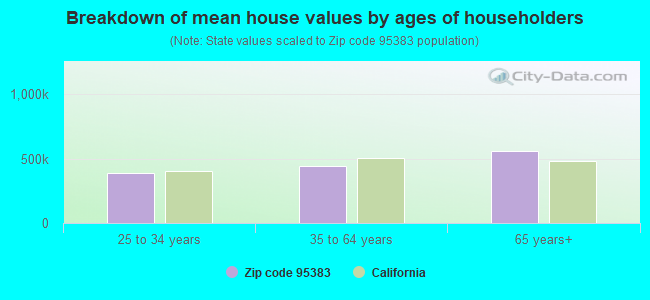
Estimated zip code population in 2022: 3,386 Zip code population in 2010: 3,937 Zip code population in 2000: 4,839
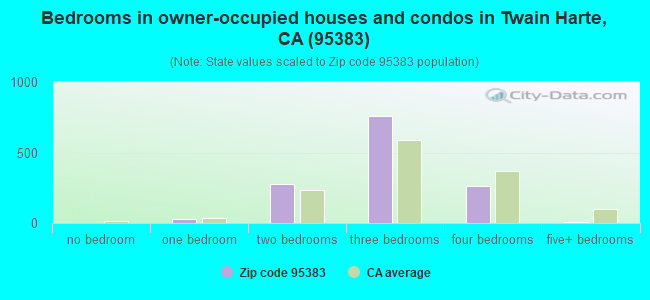
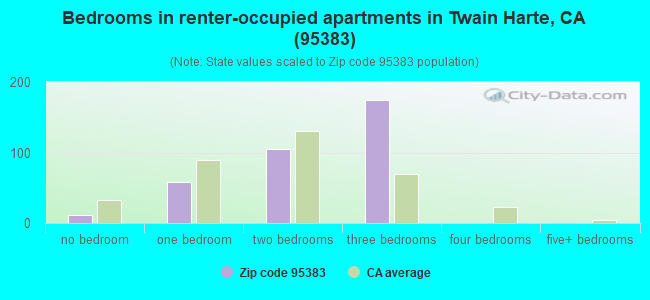
Houses and condos: 3,325 Renter-occupied apartments: 351
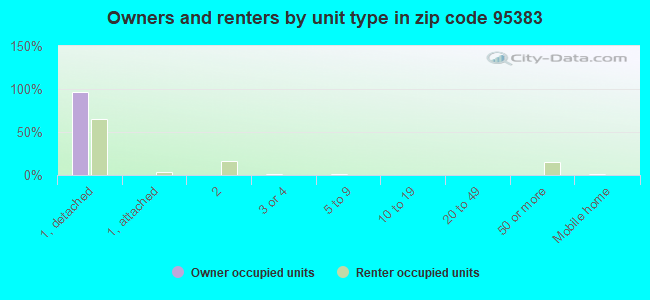
% of renters here:
21%
State:
44%
March 2022 cost of living index in zip code 95383: 93.6 (less than average, U.S. average is 100)
Land area: 78.4 sq. mi. Water area: 0.2 sq. mi.
Population density: 43 people per square mile
(very low).
OSM Map
General Map
Google Map
MSN Map
OSM Map
General Map
Google Map
MSN Map
OSM Map
General Map
Google Map
MSN Map
OSM Map
General Map
Google Map
MSN Map
Please wait while loading the map...
Real estate property taxes paid for housing units in 2022:
This zip code:
0.7% ($3,373)
California:
0.7% ($4,831)
Median real estate property taxes paid for housing units with mortgages in 2022: $3,566 (0.9%) Median real estate property taxes paid for housing units with no mortgage in 2022: $3,071 (0.5%)
Averages for the 2020 tax year for zip code 95383, filed in 2021:
Average Adjusted Gross Income (AGI) in 2020: $78,510 (Individual Income Tax Returns)
Here:
$78,510
State:
$95,910
Salary/wage: $60,920 (reported on 67.5% of returns)
Here:
$60,920
State:
$77,331
(% of AGI for various income ranges: 1017.3% for AGIs below $25k, 3351.4% for AGIs $25k-50k, 6323.8% for AGIs $50k-75k, 9481.7% for AGIs $75k-100k, 15975.0% for AGIs $100k-200k, 75233.3% for AGIs over 200k)
Taxable interest for individuals: $1,869 (reported on 46.4% of returns)
This zip code:
$1,869
California:
$2,294
(% of AGI for various income ranges: 36.1% for AGIs below $25k, 73.4% for AGIs $25k-50k, 81.2% for AGIs $50k-75k, 225.0% for AGIs $75k-100k, 296.1% for AGIs $100k-200k, 1826.7% for AGIs over 200k)
Ordinary dividends: $8,523 (reported on 25.4% of returns)
Here:
$8,523
State:
$10,949
(% of AGI for various income ranges: 77.0% for AGIs below $25k, 126.6% for AGIs $25k-50k, 256.2% for AGIs $50k-75k, 522.5% for AGIs $75k-100k, 668.9% for AGIs $100k-200k, 5516.7% for AGIs over 200k)
Net capital gain/loss in AGI: +$15,494 (reported on 24.9% of returns)
Here:
+$15,494
State:
+$49,306
(% of AGI for various income ranges: 10.0% for AGIs below $25k, 52.8% for AGIs $25k-50k, 294.4% for AGIs $50k-75k, 486.7% for AGIs $75k-100k, 1182.8% for AGIs $100k-200k, 15623.3% for AGIs over 200k)
Profit/loss from business: +$13,988 (reported on 19.1% of returns)
Here:
+$13,988
State:
+$15,671
(% of AGI for various income ranges: 190.9% for AGIs below $25k, 279.3% for AGIs $25k-50k, 484.4% for AGIs $50k-75k, 438.3% for AGIs $75k-100k, 960.0% for AGIs $100k-200k, 3753.3% for AGIs over 200k)
Taxable individual retirement arrangement distribution: $20,816 (reported on 14.8% of returns)
95383:
$20,816
California:
$23,505
(% of AGI for various income ranges: 125.8% for AGIs below $25k, 226.9% for AGIs $25k-50k, 516.9% for AGIs $50k-75k, 585.0% for AGIs $75k-100k, 1092.8% for AGIs $100k-200k, 6280.0% for AGIs over 200k)
Total itemized deductions: $31,679 (reported on 13.4% of returns)
Here:
$31,679
State:
$39,517
(% of AGI for various income ranges: 386.2% for AGIs $25k-50k, 730.0% for AGIs $50k-75k, 1232.5% for AGIs $75k-100k, 1523.9% for AGIs $100k-200k, 7866.7% for AGIs over 200k)
Charity contributions: $8,510 (reported on 10.0% of returns)
Here:
$8,510
State:
$12,598
(% of AGI for various income ranges: 24.2% for AGIs below $25k, 71.9% for AGIs $50k-75k, 253.3% for AGIs $75k-100k, 341.7% for AGIs $100k-200k, 2243.3% for AGIs over 200k)
Taxes paid: $7,546 (reported on 13.4% of returns)
95383:
$7,546
State:
$8,807
(% of AGI for various income ranges: 62.8% for AGIs $25k-50k, 165.6% for AGIs $50k-75k, 306.7% for AGIs $75k-100k, 432.2% for AGIs $100k-200k, 1733.3% for AGIs over 200k)
Earned income credit: $1,559 (reported on 10.5% of returns)
Here:
$1,559
State:
$2,074
(% of AGI for various income ranges: 63.3% for AGIs below $25k, 46.2% for AGIs $25k-50k)
Percentage of individuals using paid preparers for their 2020 taxes: 92.8%
Here:
93%
State:
92%
(% for various income ranges: 93.1% for AGIs below $25k, 91.5% for AGIs $25k-50k, 93.3% for AGIs $50k-75k, 95.7% for AGIs $75k-100k, 92.1% for AGIs $100k-200k, 92.3% for AGIs over 200k)
Averages for the 2012 tax year for zip code 95383, filed in 2013:
Average Adjusted Gross Income (AGI) in 2012: $59,914 (Individual Income Tax Returns)
Here:
$59,914
State:
$72,726
Salary/wage: $44,297 (reported on 67.7% of returns)
Here:
$44,297
State:
$59,079
(% of AGI for various income ranges: 59.3% for AGIs below $25k, 58.2% for AGIs $25k-50k, 49.8% for AGIs $50k-75k, 50.9% for AGIs $75k-100k, 56.8% for AGIs $100k-200k, 34.3% for AGIs over 200k)
Taxable interest for individuals: $1,889 (reported on 48.7% of returns)
This zip code:
$1,889
California:
$2,146
(% of AGI for various income ranges: 2.3% for AGIs below $25k, 1.0% for AGIs $25k-50k, 2.4% for AGIs $50k-75k, 0.9% for AGIs $75k-100k, 1.0% for AGIs $100k-200k, 2.0% for AGIs over 200k)
Ordinary dividends: $7,932 (reported on 27.2% of returns)
Here:
$7,932
State:
$9,308
(% of AGI for various income ranges: 4.2% for AGIs below $25k, 3.1% for AGIs $25k-50k, 2.3% for AGIs $50k-75k, 3.2% for AGIs $75k-100k, 3.1% for AGIs $100k-200k, 5.4% for AGIs over 200k)
Net capital gain/loss in AGI: +$9,988 (reported on 25.1% of returns)
Here:
+$9,988
State:
+$30,460
(% of AGI for various income ranges: 0.9% for AGIs $50k-75k, 0.9% for AGIs $75k-100k, 3.8% for AGIs $100k-200k, 13.7% for AGIs over 200k)
Profit/loss from business: +$11,988 (reported on 20.5% of returns)
Here:
+$11,988
State:
+$17,064
(% of AGI for various income ranges: 11.6% for AGIs below $25k, 9.1% for AGIs $25k-50k, 6.2% for AGIs $50k-75k, 2.4% for AGIs $75k-100k, 2.6% for AGIs $100k-200k)
Taxable individual retirement arrangement distribution: $17,794 (reported on 17.4% of returns)
95383:
$17,794
California:
$19,557
(% of AGI for various income ranges: 6.5% for AGIs below $25k, 5.3% for AGIs $25k-50k, 5.4% for AGIs $50k-75k, 5.7% for AGIs $75k-100k, 9.0% for AGIs $100k-200k)
Total itemized deductions: $25,174 (25% of AGI, reported on 41.0% of returns)
Here:
$25,174
State:
$34,004
Here:
25.3% of AGI
State:
22.7% of AGI
(% of AGI for various income ranges: 21.8% for AGIs below $25k, 17.2% for AGIs $25k-50k, 16.8% for AGIs $50k-75k, 16.3% for AGIs $75k-100k, 18.7% for AGIs $100k-200k, 15.1% for AGIs over 200k)
Charity contributions: $3,367 (reported on 33.8% of returns)
Here:
$3,367
State:
$4,659
(% of AGI for various income ranges: 1.0% for AGIs below $25k, 1.9% for AGIs $25k-50k, 1.5% for AGIs $50k-75k, 1.9% for AGIs $75k-100k, 2.1% for AGIs $100k-200k, 2.3% for AGIs over 200k)
Taxes paid: $8,536 (reported on 41.0% of returns)
95383:
$8,536
State:
$14,448
(% of AGI for various income ranges: 4.6% for AGIs below $25k, 3.8% for AGIs $25k-50k, 3.9% for AGIs $50k-75k, 4.9% for AGIs $75k-100k, 6.9% for AGIs $100k-200k, 8.4% for AGIs over 200k)
Earned income credit: $2,021 (reported on 14.9% of returns)
Here:
$2,021
State:
$2,286
(% of AGI for various income ranges: 5.1% for AGIs below $25k, 0.9% for AGIs $25k-50k)
Percentage of individuals using paid preparers for their 2012 taxes: 66.2%
Here:
66%
State:
64%
(% for various income ranges: 58.3% for AGIs below $25k, 65.9% for AGIs $25k-50k, 70.0% for AGIs $50k-75k, 71.4% for AGIs $75k-100k, 72.7% for AGIs $100k-200k, 100.0% for AGIs over 200k)
Averages for the 2004 tax year for zip code 95383, filed in 2005:
Average Adjusted Gross Income (AGI) in 2004: $46,932 (Individual Income Tax Returns)
Here:
$46,932
State:
$58,600
Salary/wage: $36,406 (reported on 69.7% of returns)
Here:
$36,406
State:
$49,455
(% of AGI for various income ranges: 140.4% for AGIs below $10k, 56.5% for AGIs $10k-25k, 60.6% for AGIs $25k-50k, 54.4% for AGIs $50k-75k, 57.2% for AGIs $75k-100k, 46.1% for AGIs over 100k)
Taxable interest for individuals: $1,990 (reported on 56.9% of returns)
This zip code:
$1,990
California:
$2,365
(% of AGI for various income ranges: 14.2% for AGIs below $10k, 3.7% for AGIs $10k-25k, 2.4% for AGIs $25k-50k, 2.2% for AGIs $50k-75k, 2.1% for AGIs $75k-100k, 2.1% for AGIs over 100k)
Taxable dividends: $3,678 (reported on 31.1% of returns)
Here:
$3,678
State:
$4,746
(% of AGI for various income ranges: 8.0% for AGIs below $10k, 3.3% for AGIs $10k-25k, 2.6% for AGIs $25k-50k, 2.7% for AGIs $50k-75k, 1.7% for AGIs $75k-100k, 2.2% for AGIs over 100k)
Net capital gain/loss: +$11,271 (reported on 28.2% of returns)
Here:
+$11,271
State:
+$23,418
(% of AGI for various income ranges: -5.8% for AGIs below $10k, -0.8% for AGIs $10k-25k, 0.7% for AGIs $25k-50k, 2.1% for AGIs $50k-75k, 4.0% for AGIs $75k-100k, 16.2% for AGIs over 100k)
Profit/loss from business: +$19,073 (reported on 21.8% of returns)
Here:
+$19,073
State:
+$16,826
(% of AGI for various income ranges: 8.5% for AGIs below $10k, 14.4% for AGIs $10k-25k, 9.1% for AGIs $25k-50k, 7.6% for AGIs $50k-75k, 8.4% for AGIs $75k-100k, 8.3% for AGIs over 100k)
IRA payment deduction: $3,500 (reported on 3.1% of returns)
95383:
$3,500
California:
$3,192
(% of AGI for various income ranges: 2.7% for AGIs below $10k, 0.4% for AGIs $25k-50k, 0.3% for AGIs $50k-75k, 0.4% for AGIs $75k-100k)
Self-employed pension: $13,243 (reported on 1.7% of returns)
Here:
$13,243
California:
$17,688
Total itemized deductions: $19,508 (26% of AGI, reported on 44.7% of returns)
Here:
$19,508
State:
$28,113
Here:
26.1% of AGI
State:
25.3% of AGI
(% of AGI for various income ranges: 45.6% for AGIs below $10k, 22.4% for AGIs $10k-25k, 19.8% for AGIs $25k-50k, 18.4% for AGIs $50k-75k, 19.8% for AGIs $75k-100k, 15.8% for AGIs over 100k)
Charity contributions deductions: $2,754 (3% of AGI, reported on 38.0% of returns)
Here:
$2,754
State:
$3,923
Here:
3.4% of AGI
State:
3.3% of AGI
(% of AGI for various income ranges: 2.1% for AGIs below $10k, 1.4% for AGIs $10k-25k, 1.7% for AGIs $25k-50k, 2.0% for AGIs $50k-75k, 2.8% for AGIs $75k-100k, 2.5% for AGIs over 100k)
Total tax: $6,822 (reported on 79.3% of returns)
95383:
$6,822
State:
$10,761
(% of AGI for various income ranges: 8.1% for AGIs below $10k, 5.5% for AGIs $10k-25k, 7.4% for AGIs $25k-50k, 9.4% for AGIs $50k-75k, 10.6% for AGIs $75k-100k, 16.9% for AGIs over 100k)
Earned income credit: $1,486 (reported on 11.3% of returns)
Here:
$1,486
State:
$1,763
Percentage of individuals using paid preparers for their 2004 taxes: 67.9%
Here:
68%
State:
66%
(% for various income ranges: 56.7% for AGIs below $10k, 68.0% for AGIs $10k-25k, 64.9% for AGIs $25k-50k, 74.3% for AGIs $50k-75k, 75.5% for AGIs $75k-100k, 78.7% for AGIs over 100k)
Household received Food Stamps/SNAP in the past 12 months: 94 Household did not receive Food Stamps/SNAP in the past 12 months: 1,575
Women who had a birth in the past 12 months: 38 (38 now married, 0 unmarried) Women who did not have a birth in the past 12 months: 345 (263 now married, 76 unmarried)
Housing units in zip code 95383 with a mortgage: 859 (53 second mortgage, 21 home equity loan, 15 both second mortgage and home equity loan) Median monthly owner costs for units with a mortgage: $1,949 Median monthly owner costs for units without a mortgage: $912
Residents with income below the poverty level in 2022:
This zip code:
5.4%
Whole state:
12.2%
Residents with income below 50% of the poverty level in 2022:
This zip code:
4.6%
Whole state:
6.2%
Median number of rooms in houses and condos:
Here:
5.5
State:
6.0
Median number of rooms in apartments:
Here:
4.8
State:
3.9
Notable locations in this zip code not listed on our city pages
Notable locations in zip code 95383: Twain Harte F D Fires Station (A), Twain Harte Golf Course (B), Sierra Pines Golf Course (C), Eagle Creek Camp (D), Twain Harte Community Center (E), Department of Forestry and Fire Protection Twaine Harte Forest Fire (F), Twain Harte Community Services District Fire and Rescue Division (G), Tuolumne County Fire Department Station 77 Mi - Wuk (H). Display/hide their locations on the map
Churches in zip code 95383 include: All Saints Catholic Church (A), Chapel in the Pines (B), Mount Calvary Lutheran Church (C), Twain Harte Evangelical Free Church (D). Display/hide their locations on the map
Size of family households: 681 2-persons, 206 3-persons, 115 4-persons, 50 5-persons
Size of nonfamily households: 494 1-person, 152 2-persons, 10 4-persons
394 married couples with children.
49 single-parent households (40 men, 9 women).
91.1% of residents of 95383 zip code speak English at home.
4.3% of residents speak Spanish at home (89% very well, 11% well).
5.0% of residents speak other Indo-European language at home (80% very well, 11% well, 9% not well).
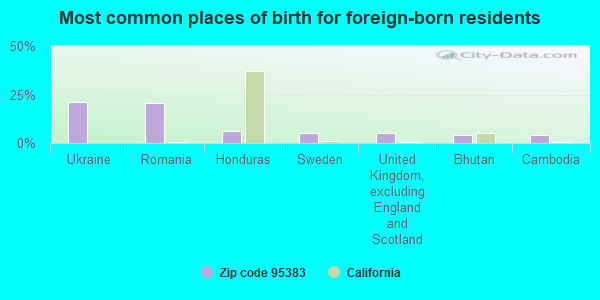
Foreign born population: 247 (7.3%) (95.6% of them are naturalized citizens)
This zip code:
7.3%
Whole state:
26.7%
21%Ukraine
21%Romania
6%Honduras
5%Sweden
5%United Kingdom, excluding England and Scotland
4%Bhutan
4%Cambodia
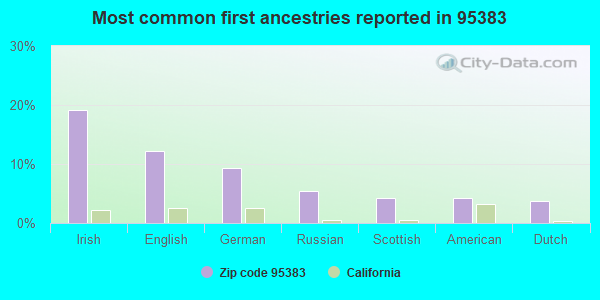
19%Irish
12%English
9%German
5%Russian
4%Scottish
4%American
4%Dutch
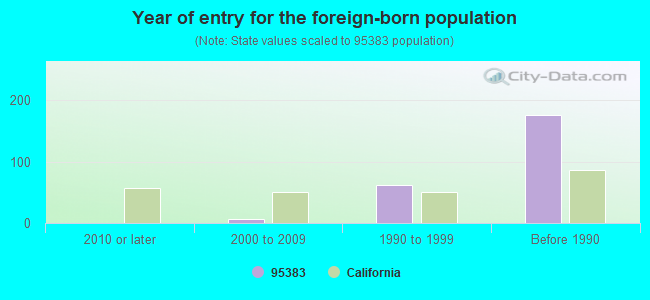
Year of entry for the foreign-born population
02010 or later
62000 to 2009
621990 to 1999
176Before 1990
Facilities with environmental interests located in this zip code:
JOHN HICKS TRUCKING (23672 KIT CARSON DR in TWAIN HARTE, CA)
TRANSPORTER (Resource Conservation and Recovery Act (tracking hazardous waste)) Organizations: JOHN E HICKS (CONTACT/OWNER)
Housing units lacking complete plumbing facilities: 1.6% Housing units lacking complete kitchen facilities: 1.5%
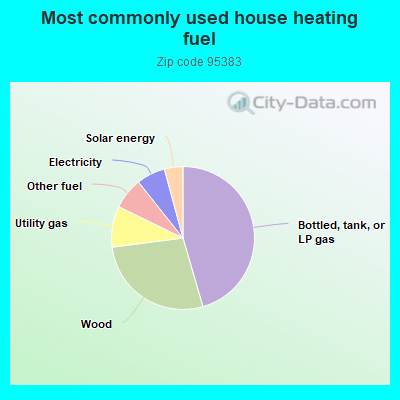
45.6%Bottled, tank, or LP gas
27.5%Wood
9.3%Utility gas
7.1%Other fuel
6.5%Electricity
4.2%Solar energy
Population in 1990: 5,133.
Place of birth for U.S.-born residents:
This state: 2,379
Northeast: 103
Midwest: 228
South: 128
West: 271
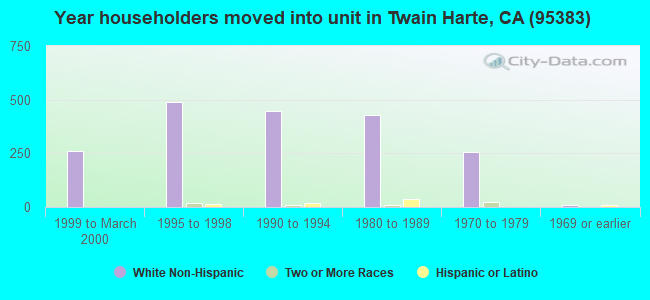
61% of the 95383 zip code residents lived in the same house 5 years ago. Out of people who lived in different houses, 42% lived in this county. Out of people who lived in different counties, 50% lived in California.
90% of the 95383 zip code residents lived in the same house 1 year ago. Out of people who lived in different houses, 15% moved from this county. Out of people who lived in different houses, 48% moved from different county within same state. Out of people who lived in different houses, 22% moved from different state. Out of people who lived in different houses, 21% moved from abroad.
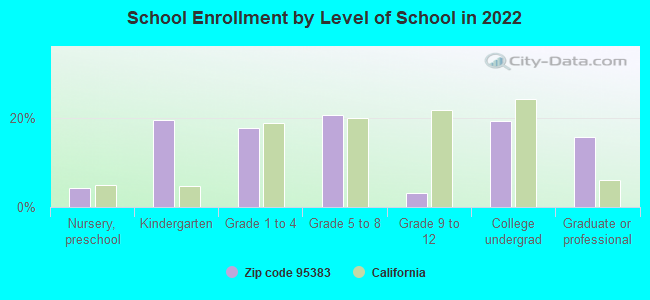
Private vs. public school enrollment:
Students in private schools in grades 1 to 8 (elementary and middle school): 34
Here:
31.5%
California:
10.5%
Students in private schools in grades 9 to 12 (high school):
Here:
0.0%
California:
8.5%
Students in private undergraduate colleges:
Here:
0.0%
California:
15.9%
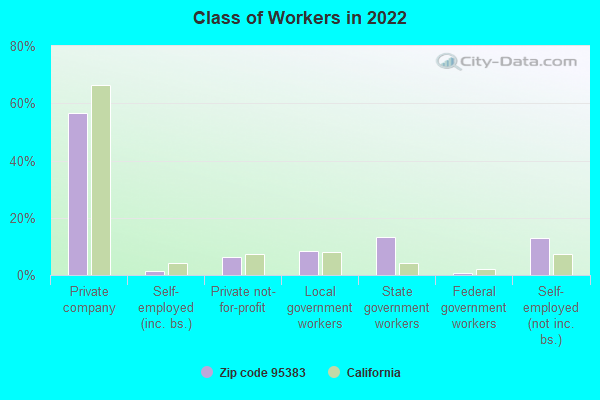
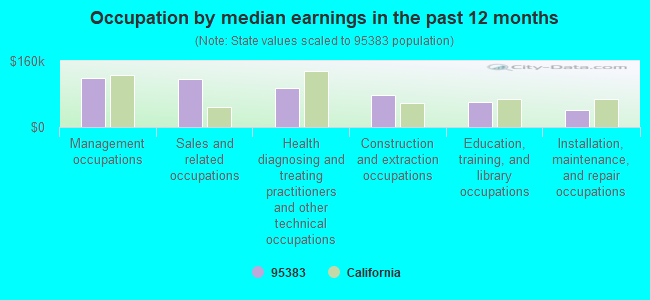
Occupation by median earnings in the past 12 months ($)
119,393Management occupations
115,433Sales and related occupations
93,873Health diagnosing and treating practitioners and other technical occupations
76,478Construction and extraction occupations
60,043Education, training, and library occupations
41,769Installation, maintenance, and repair occupations
Top industries in this zip code by the number of employees in 2005:
Arts, Entertainment, and Recreation: Golf Courses and Country Clubs (100-249 employees: 1 establishment, 10-19 employees: 1 establishment)
Other Services (except Public Administration): Religious Organizations (5-9: 2, 1-4: 2)
Fatal accident statistics in 2011:
Fatal accident count: 2
Vehicles involved in fatal accidents: 3
Fatal accidents caused by drunken drivers: 1
Fatalities: 2
Persons involved in fatal accidents: 4
Pedestrians involved in fatal accidents: 0
Fatal accident statistics in 2010:
Fatal accident count: 1
Vehicles involved in fatal accidents: 1
Fatal accidents caused by drunken drivers: 0
Fatalities: 1
Persons involved in fatal accidents: 1
Pedestrians involved in fatal accidents: 0
2005 - 2018 National Fire Incident Reporting System (NFIRS) incidents
According to the data from the years 2005 - 2018 the average number of fires per year is 30. The highest number of fire incidents - 50 took place in 2009, and the least - 7 in 2005. The data has a growing trend.
When looking into fire subcategories, the most reports belonged to: Outside Fires (44.1%), and Structure Fires (32.8%).
Fire incident types reported to NFIRS in Zip Code 95383


 Nearest zip codes: 95346, 95372, 95335, 95233, 95310, 95224.


 According to the data from the years 2005 - 2018 the average number of fires per year is 30. The highest number of fire incidents - 50 took place in 2009, and the least - 7 in 2005. The data has a growing trend.
 When looking into fire subcategories, the most reports belonged to: Outside Fires (44.1%), and Structure Fires (32.8%).