Estimated zip code population in 2022: 508 Zip code population in 2010: 718 Zip code population in 2000: 589
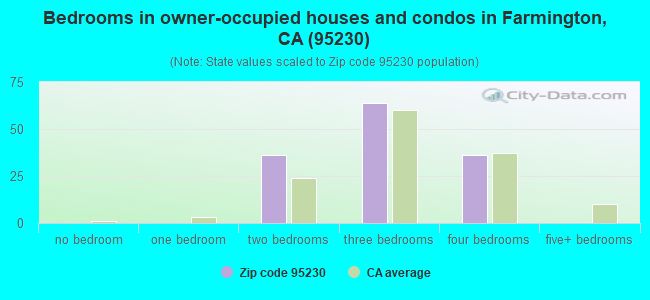
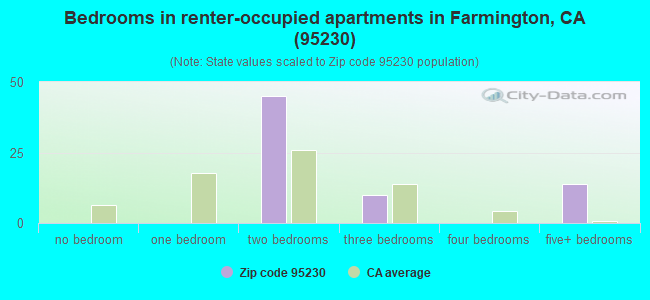
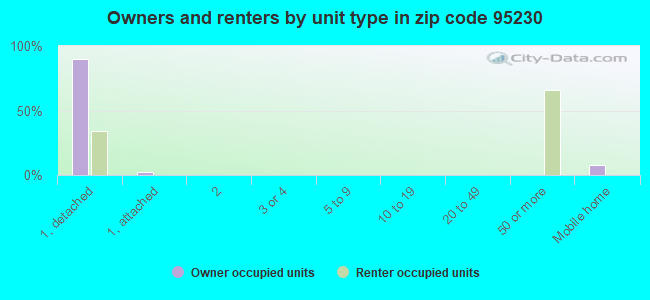
Houses and condos: 256 Renter-occupied apartments: 68
% of renters here:
33%
State:
44%
March 2022 cost of living index in zip code 95230: 98.3 (near average, U.S. average is 100)
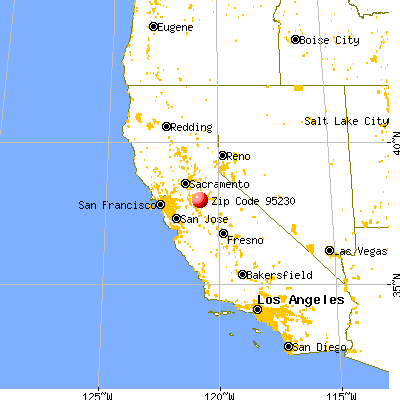
Land area: 113.7 sq. mi. Water area: 6.7 sq. mi.
Population density: 4 people per square mile
(very low).
OSM Map
General Map
Google Map
MSN Map
OSM Map
General Map
Google Map
MSN Map
OSM Map
General Map
Google Map
MSN Map
OSM Map
General Map
Google Map
MSN Map
Please wait while loading the map...
Real estate property taxes paid for housing units in 2022:
This zip code:
0.5% ($3,816)
California:
0.7% ($4,831)
Median real estate property taxes paid for housing units with mortgages in 2022: $7,145 (1.0%) Median real estate property taxes paid for housing units with no mortgage in 2022: $2,748 (0.4%)
Business Search- 14 Million verified businesses
Males: 300
(59.0%)
Females: 208
(41.0%)
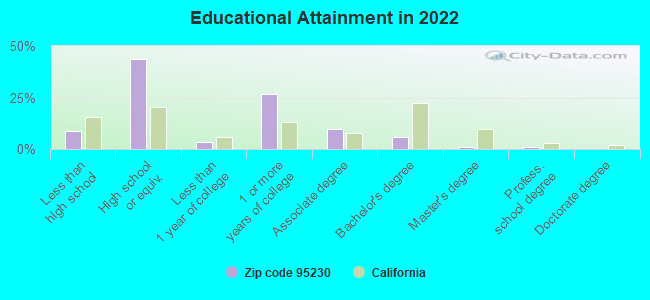
For population 25 years and over in 95230:
High school or higher: 89.1%
Bachelor's degree or higher: 7.2%
Graduate or professional degree: 1.7%
Unemployed: 3.9%
Mean travel time to work (commute): 21.5 minutes
For population 15 years and over in 95230:
Never married: 19.7%
Now married: 66.1%
Separated: 0.0%
Widowed: 5.6%
Divorced: 8.6%
Zip code 95230 compared to state average:
Black race population percentage significantly below state average.
Foreign-born population percentage significantly below state average.
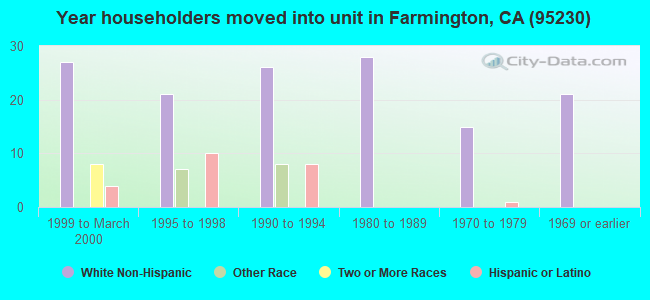
Length of stay since moving in significantly below state average.
Number of college students significantly below state average.
Percentage of population with a bachelor's degree or higher significantly below state average.
Estimated median house/condo value in 2022: $725,564
95230:
$725,564
California:
$715,900
According to our research of California and other state lists, there was 1 registered sex offender living in 95230 zip code as of July 17, 2024. The ratio of all residents to sex offenders in zip code 95230 is 881 to 1. The ratio of registered sex offenders to all residents in this zip code is near the state average.
Median resident age:
This zip code:
38.7 years
California median age:
37.9 years
Average household size:
This zip code:
2.4 people
California:
2.8 people
Averages for the 2020 tax year for zip code 95230, filed in 2021:
Average Adjusted Gross Income (AGI) in 2020: $66,875 (Individual Income Tax Returns)
Here:
$66,875
State:
$95,910
Salary/wage: $60,309 (reported on 71.9% of returns)
Here:
$60,309
State:
$77,331
(% of AGI for various income ranges: 1600.0% for AGIs below $25k, 4538.3% for AGIs $25k-50k, 5967.5% for AGIs $50k-75k, 9765.0% for AGIs $75k-100k, 20560.0% for AGIs $100k-200k)
Taxable interest for individuals: $2,418 (reported on 34.4% of returns)
This zip code:
$2,418
California:
$2,294
(% of AGI for various income ranges: 12.5% for AGIs below $25k, 20.0% for AGIs $25k-50k, 127.5% for AGIs $50k-75k, 660.0% for AGIs $100k-200k)
Ordinary dividends: $4,720 (reported on 15.6% of returns)
Here:
$4,720
State:
$10,949
(% of AGI for various income ranges: 1180.0% for AGIs $75k-100k)
Net capital gain/loss in AGI: +$6,580 (reported on 15.6% of returns)
Here:
+$6,580
State:
+$49,306
(% of AGI for various income ranges: 285.0% for AGIs below $25k, 1075.0% for AGIs $75k-100k)
Profit/loss from business: +$5,825 (reported on 12.5% of returns)
Here:
+$5,825
State:
+$15,671
(% of AGI for various income ranges: 388.3% for AGIs $25k-50k)
Total itemized deductions: $32,375 (reported on 12.5% of returns)
Here:
$32,375
State:
$39,517
(% of AGI for various income ranges: 4316.7% for AGIs $100k-200k)
Charity contributions: $9,167 (reported on 9.4% of returns)
Here:
$9,167
State:
$12,598
(% of AGI for various income ranges: 1375.0% for AGIs $75k-100k)
Taxes paid: $8,767 (reported on 9.4% of returns)
95230:
$8,767
State:
$8,807
(% of AGI for various income ranges: 876.7% for AGIs $100k-200k)
Earned income credit: $1,725 (reported on 12.5% of returns)
Here:
$1,725
State:
$2,074
(% of AGI for various income ranges: 90.0% for AGIs below $25k, 55.0% for AGIs $25k-50k)
Percentage of individuals using paid preparers for their 2020 taxes: 87.5%
Here:
88%
State:
92%
(% for various income ranges: 87.5% for AGIs below $25k, 88.9% for AGIs $25k-50k, 100.0% for AGIs $50k-75k, 75.0% for AGIs $75k-100k, 83.3% for AGIs $100k-200k)
Averages for the 2012 tax year for zip code 95230, filed in 2013:
Average Adjusted Gross Income (AGI) in 2012: $52,133 (Individual Income Tax Returns)
Here:
$52,133
State:
$72,726
Salary/wage: $41,508 (reported on 78.8% of returns)
Here:
$41,508
State:
$59,079
(% of AGI for various income ranges: 74.5% for AGIs below $25k, 84.4% for AGIs $25k-50k, 102.3% for AGIs $50k-75k, 50.2% for AGIs $100k-200k)
Taxable interest for individuals: $1,133 (reported on 36.4% of returns)
This zip code:
$1,133
California:
$2,146
(% of AGI for various income ranges: 1.3% for AGIs below $25k, 1.1% for AGIs $25k-50k, 1.7% for AGIs $50k-75k, 0.4% for AGIs $100k-200k)
Ordinary dividends: $1,225 (reported on 12.1% of returns)
Here:
$1,225
State:
$9,308
Net capital gain/loss in AGI: +$6,100 (reported on 9.1% of returns)
Here:
+$6,100
State:
+$30,460
Profit/loss from business: +$14,300 (reported on 9.1% of returns)
Here:
+$14,300
State:
+$17,064
Taxable individual retirement arrangement distribution: $6,350 (reported on 6.1% of returns)
95230:
$6,350
California:
$19,557
Total itemized deductions: $25,822 (24% of AGI, reported on 27.3% of returns)
Here:
$25,822
State:
$34,004
Here:
24.5% of AGI
State:
22.7% of AGI
(% of AGI for various income ranges: 26.2% for AGIs below $25k, 28.6% for AGIs $50k-75k, 15.3% for AGIs $100k-200k)
Charity contributions: $3,650 (reported on 24.2% of returns)
Here:
$3,650
State:
$4,659
Taxes paid: $7,811 (reported on 27.3% of returns)
95230:
$7,811
State:
$14,448
(% of AGI for various income ranges: 4.0% for AGIs below $25k, 7.5% for AGIs $50k-75k, 6.0% for AGIs $100k-200k)
Earned income credit: $1,400 (reported on 18.2% of returns)
Here:
$1,400
State:
$2,286
(% of AGI for various income ranges: 3.3% for AGIs below $25k, 1.2% for AGIs $25k-50k)
Percentage of individuals using paid preparers for their 2012 taxes: 72.7%
Here:
73%
State:
64%
(% for various income ranges: 70.0% for AGIs below $25k, 80.0% for AGIs $25k-50k, 66.7% for AGIs $50k-75k, 66.7% for AGIs $75k-100k, 75.0% for AGIs $100k-200k)
Averages for the 2004 tax year for zip code 95230, filed in 2005:
Average Adjusted Gross Income (AGI) in 2004: $44,021 (Individual Income Tax Returns)
Here:
$44,021
State:
$58,600
Salary/wage: $38,409 (reported on 80.2% of returns)
Here:
$38,409
State:
$49,455
(% of AGI for various income ranges: 98.7% for AGIs $10k-25k, 83.9% for AGIs $25k-50k, 78.3% for AGIs $50k-75k, 68.6% for AGIs $75k-100k, 43.3% for AGIs over 100k)
Taxable interest for individuals: $3,255 (reported on 42.9% of returns)
This zip code:
$3,255
California:
$2,365
(% of AGI for various income ranges: 1.4% for AGIs $10k-25k, 0.4% for AGIs $25k-50k, 0.9% for AGIs $50k-75k, 0.9% for AGIs $75k-100k, 7.3% for AGIs over 100k)
Taxable dividends: $958 (reported on 21.9% of returns)
Here:
$958
State:
$4,746
(% of AGI for various income ranges: 0.1% for AGIs $25k-50k, 0.3% for AGIs $50k-75k, 0.3% for AGIs $75k-100k, 0.4% for AGIs over 100k)
Net capital gain/loss: +$28,785 (reported on 19.8% of returns)
Here:
+$28,785
State:
+$23,418
(% of AGI for various income ranges: 0.5% for AGIs $10k-25k, 8.2% for AGIs $50k-75k, 32.6% for AGIs over 100k)
Profit/loss from business: +$7,971 (reported on 10.6% of returns)
Here:
+$7,971
State:
+$16,826
Profit/loss from farming: +$1,326 (reported on 14.0% of returns)
Here:
+$1,326
State:
-$7,562
Total itemized deductions: $22,821 (25% of AGI, reported on 28.9% of returns)
Here:
$22,821
State:
$28,113
Here:
24.7% of AGI
State:
25.3% of AGI
(% of AGI for various income ranges: 6.6% for AGIs $25k-50k, 15.5% for AGIs $50k-75k, 19.4% for AGIs $75k-100k, 18.3% for AGIs over 100k)
Charity contributions deductions: $3,658 (4% of AGI, reported on 23.1% of returns)
Here:
$3,658
State:
$3,923
Here:
3.8% of AGI
State:
3.3% of AGI
(% of AGI for various income ranges: 0.7% for AGIs $25k-50k, 1.4% for AGIs $50k-75k, 5.4% for AGIs $75k-100k, 2.1% for AGIs over 100k)
Total tax: $7,266 (reported on 65.0% of returns)
95230:
$7,266
State:
$10,761
(% of AGI for various income ranges: 3.3% for AGIs $10k-25k, 5.3% for AGIs $25k-50k, 9.5% for AGIs $50k-75k, 10.7% for AGIs $75k-100k, 16.8% for AGIs over 100k)
Earned income credit: $1,367 (reported on 18.2% of returns)
Here:
$1,367
State:
$1,763
Percentage of individuals using paid preparers for their 2004 taxes: 72.6%
Here:
73%
State:
66%
(% for various income ranges: 73.8% for AGIs below $10k, 66.3% for AGIs $10k-25k, 73.6% for AGIs $25k-50k, 71.7% for AGIs $50k-75k, 79.2% for AGIs $75k-100k, 83.3% for AGIs over 100k)
Household received Food Stamps/SNAP in the past 12 months: 0 Household did not receive Food Stamps/SNAP in the past 12 months: 199
Women who did not have a birth in the past 12 months: 79 (62 now married, 16 unmarried)
Housing units in zip code 95230 with a mortgage: 75 Median monthly owner costs for units with a mortgage: $2,815 Median monthly owner costs for units without a mortgage: $596
Median number of rooms in houses and condos:
Here:
6.1
State:
6.0
Median number of rooms in apartments:
Here:
3.3
State:
3.9
Notable locations in this zip code not listed on our city pages
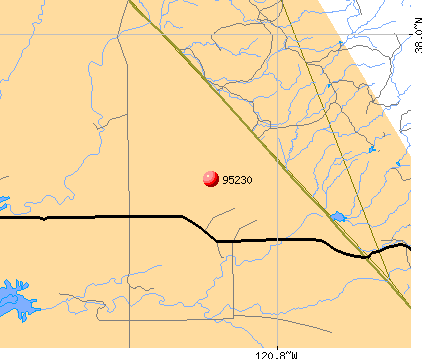
Notable locations in zip code 95230: Bund Ranch (A), Tower Ranch (B), Snow Ranch (C), Red House Ranch (D), Rock Creek Dairy (E), Farmington Rural Fire Protection District (F). Display/hide their locations on the map
Creeks: Hoods Creek (A), North Fork Duck Creek (B), Telegraph Creek (C), Snow Creek (D), Simmons Creek (E), Shirley Creek (F), Smith Creek (G), Salt Creek (H). Display/hide their locations on the map
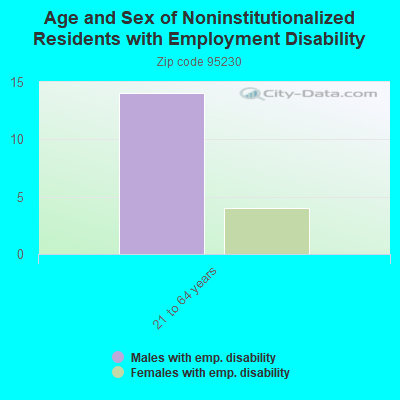
In group quarters: 14 (-1 institutionalized population)
Size of family households: 60 2-persons, 16 3-persons, 67 4-persons
Size of nonfamily households: 59 1-person
117 married couples with children.
4 single-parent households (4 women).
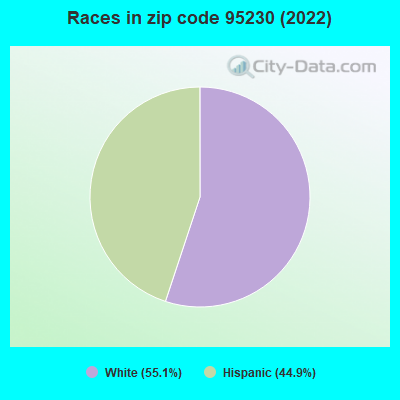
56.7% of residents of 95230 zip code speak English at home.
33.1% of residents speak Spanish at home (88% very well, 4% not well, 8% not at all).
9.0% of residents speak other Indo-European language at home (100% very well).
Foreign born population: 40 (8.0%) (49.2% of them are naturalized citizens)
This zip code:
8.0%
Whole state:
26.7%
70%Honduras
28%Italy
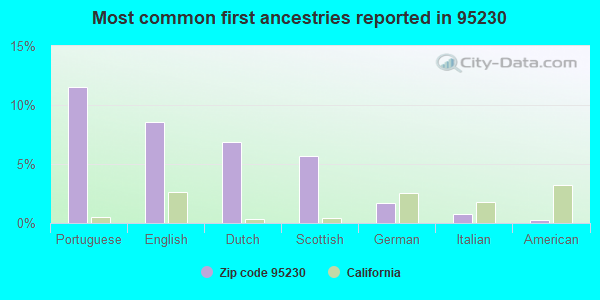
12%Portuguese
9%English
7%Dutch
6%Scottish
2%German
1%Italian
0%American
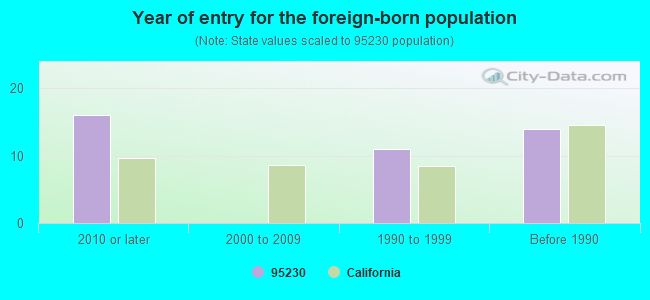
Year of entry for the foreign-born population
162010 or later
02000 to 2009
111990 to 1999
14Before 1990
Facilities with environmental interests located in this zip code:
FARMINGTON ELEMENTARY (25233 E. HWY. 4 in FARMINGTON, CA)
(National Center for Education Statistics) - STATE ID-6041800 Organizations: ESCALON UNIFIED (SCHOOL DISTRICT)
ESCALON UNIFIED FARMINGTON ELEMENTARY (25238 E HIGHWAY 4 in FARMINGTON, CA)
Small Quantity Generators, between 100 kg and 1000 kg of hazardous waste/month (Resource Conservation and Recovery Act (tracking hazardous waste)) - notification Organizations: ESCALON UNIFIED SCHOOL DIST (CONTACT/OWNER)
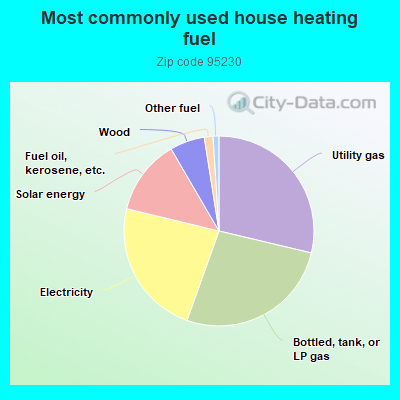
29.1%Utility gas
27.1%Bottled, tank, or LP gas
23.6%Electricity
13.0%Solar energy
6.0%Wood
1.5%Fuel oil, kerosene, etc.
1.0%Other fuel
Population in 1990: 141. Population change in the 1990s: +448 (+317.7%).
Place of birth for U.S.-born residents:
This state: 418
Midwest: 24
South: 14
West: 10
67% of the 95230 zip code residents lived in the same house 5 years ago. Out of people who lived in different houses, 59% lived in this county. Out of people who lived in different counties, 50% lived in California.
93% of the 95230 zip code residents lived in the same house 1 year ago. Out of people who lived in different houses, 58% moved from this county. Out of people who lived in different houses, 38% moved from different county within same state.
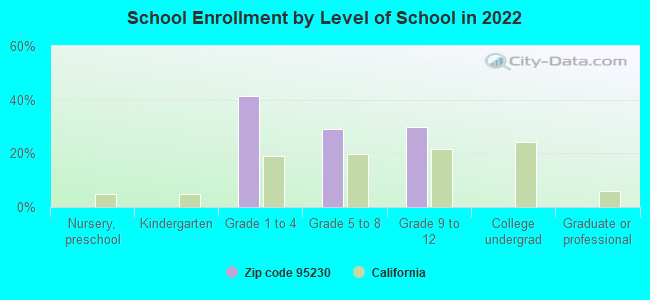
Private vs. public school enrollment:
Students in private schools in grades 1 to 8 (elementary and middle school):
Here:
0.0%
California:
10.5%
Students in private schools in grades 9 to 12 (high school):
Here:
0.0%
California:
8.5%
Top industries in this zip code by the number of employees in 2005:
Accommodation and Food Services: Full-Service Restaurants (5-9 employees: 1 establishment)
Arts, Entertainment, and Recreation: Golf Courses and Country Clubs (1-4: 1)
Other Services (except Public Administration): Religious Organizations (1-4: 1)
Utilities: Water Supply and Irrigation Systems (1-4: 1)
Construction: Residential Remodelers (1-4: 1)
Other Services (except Public Administration): Cemeteries and Crematories (1-4: 1)
People in group quarters in 2010:
8 people in workers' group living quarters and job corps centers
Fatal accident statistics in 2012:
Fatal accident count: 2
Vehicles involved in fatal accidents: 2
Fatal accidents caused by drunken drivers: 1
Fatalities: 2
Persons involved in fatal accidents: 3
Pedestrians involved in fatal accidents: 0
Fatal accident statistics in 2011:
Fatal accident count: 1
Vehicles involved in fatal accidents: 1
Fatal accidents caused by drunken drivers: 0
Fatalities: 1
Persons involved in fatal accidents: 1
Pedestrians involved in fatal accidents: 0
Home Mortgage Disclosure Act Aggregated Statistics For Year 2009 (Based on 4 partial tracts)
A) FHA, FSA/RHS & VA Home Purchase Loans
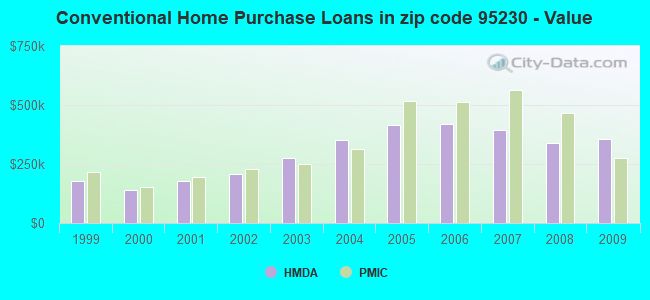
B) Conventional Home Purchase Loans
C) Refinancings
D) Home Improvement Loans
F) Non-occupant Loans on < 5 Family Dwellings (A B C & D)
G) Loans On Manufactured Home Dwelling (A B C & D)
Number
Average Value
Number
Average Value
Number
Average Value
Number
Average Value
Number
Average Value
Number
Average Value
LOANS ORIGINATED
20
$254,989
29
$354,357
127
$261,492
7
$209,491
7
$204,276
8
$238,149
APPLICATIONS APPROVED, NOT ACCEPTED
2
$272,880
6
$276,185
16
$285,228
2
$105,790
4
$200,940
1
$110,290
APPLICATIONS DENIED
5
$200,846
9
$308,730
100
$324,418
6
$245,942
3
$294,060
5
$101,756
APPLICATIONS WITHDRAWN
4
$201,848
10
$298,490
39
$307,020
2
$290,915
1
$223,950
1
$109,440
FILES CLOSED FOR INCOMPLETENESS
0
$0
1
$697,750
7
$274,801
1
$186,780
0
$0
0
$0
Aggregated Statistics For Year 2008 (Based on 4 partial tracts)
A) FHA, FSA/RHS & VA Home Purchase Loans
B) Conventional Home Purchase Loans
C) Refinancings
D) Home Improvement Loans
E) Loans on Dwellings For 5+ Families
F) Non-occupant Loans on < 5 Family Dwellings (A B C & D)
G) Loans On Manufactured Home Dwelling (A B C & D)
Number
Average Value
Number
Average Value
Number
Average Value
Number
Average Value
Number
Average Value
Number
Average Value
Number
Average Value
LOANS ORIGINATED
9
$286,386
43
$340,336
66
$278,263
16
$146,886
1
$1,060,130
9
$269,203
10
$158,365
APPLICATIONS APPROVED, NOT ACCEPTED
0
$0
6
$400,313
10
$380,064
3
$123,267
0
$0
0
$0
3
$178,800
APPLICATIONS DENIED
0
$0
20
$305,290
78
$377,132
14
$155,496
0
$0
5
$334,058
6
$127,042
APPLICATIONS WITHDRAWN
1
$306,960
13
$309,433
29
$284,607
2
$81,470
0
$0
1
$286,980
1
$222,720
FILES CLOSED FOR INCOMPLETENESS
0
$0
3
$335,117
11
$379,779
0
$0
0
$0
0
$0
1
$398,390
Aggregated Statistics For Year 2007 (Based on 4 partial tracts)
B) Conventional Home Purchase Loans
C) Refinancings
D) Home Improvement Loans
F) Non-occupant Loans on < 5 Family Dwellings (A B C & D)
G) Loans On Manufactured Home Dwelling (A B C & D)
Number
Average Value
Number
Average Value
Number
Average Value
Number
Average Value
Number
Average Value
LOANS ORIGINATED
62
$392,314
165
$393,595
26
$252,960
9
$521,711
13
$215,815
APPLICATIONS APPROVED, NOT ACCEPTED
16
$372,244
40
$386,642
10
$194,037
3
$503,930
3
$150,070
APPLICATIONS DENIED
28
$426,261
130
$475,362
19
$263,462
8
$378,020
17
$263,388
APPLICATIONS WITHDRAWN
11
$379,616
59
$406,524
7
$366,770
2
$505,305
2
$88,750
FILES CLOSED FOR INCOMPLETENESS
3
$518,793
32
$404,744
1
$341,000
0
$0
0
$0
Aggregated Statistics For Year 2006 (Based on 4 partial tracts)
B) Conventional Home Purchase Loans
C) Refinancings
D) Home Improvement Loans
F) Non-occupant Loans on < 5 Family Dwellings (A B C & D)
G) Loans On Manufactured Home Dwelling (A B C & D)
Number
Average Value
Number
Average Value
Number
Average Value
Number
Average Value
Number
Average Value
LOANS ORIGINATED
127
$418,715
241
$405,924
40
$251,993
17
$277,082
10
$248,726
APPLICATIONS APPROVED, NOT ACCEPTED
29
$317,915
45
$402,226
13
$116,445
1
$432,270
4
$115,345
APPLICATIONS DENIED
63
$432,817
112
$389,932
16
$181,299
14
$426,205
9
$321,509
APPLICATIONS WITHDRAWN
24
$303,523
83
$479,287
6
$87,987
7
$447,369
3
$186,813
FILES CLOSED FOR INCOMPLETENESS
9
$414,438
23
$428,627
4
$378,290
0
$0
0
$0
Aggregated Statistics For Year 2005 (Based on 4 partial tracts)
A) FHA, FSA/RHS & VA Home Purchase Loans
B) Conventional Home Purchase Loans
C) Refinancings
D) Home Improvement Loans
F) Non-occupant Loans on < 5 Family Dwellings (A B C & D)
G) Loans On Manufactured Home Dwelling (A B C & D)
Number
Average Value
Number
Average Value
Number
Average Value
Number
Average Value
Number
Average Value
Number
Average Value
LOANS ORIGINATED
1
$266,720
152
$416,467
235
$388,662
41
$244,120
17
$481,730
13
$272,205
APPLICATIONS APPROVED, NOT ACCEPTED
0
$0
38
$348,990
37
$351,289
3
$48,727
4
$317,030
5
$154,766
APPLICATIONS DENIED
0
$0
63
$466,483
119
$348,606
17
$180,631
10
$439,700
10
$241,700
APPLICATIONS WITHDRAWN
0
$0
44
$409,827
101
$358,863
9
$270,302
11
$241,840
8
$325,759
FILES CLOSED FOR INCOMPLETENESS
0
$0
10
$315,199
34
$382,228
4
$150,068
1
$686,230
1
$212,620
Aggregated Statistics For Year 2004 (Based on 4 partial tracts)
A) FHA, FSA/RHS & VA Home Purchase Loans
B) Conventional Home Purchase Loans
C) Refinancings
D) Home Improvement Loans
F) Non-occupant Loans on < 5 Family Dwellings (A B C & D)
G) Loans On Manufactured Home Dwelling (A B C & D)
Number
Average Value
Number
Average Value
Number
Average Value
Number
Average Value
Number
Average Value
Number
Average Value
LOANS ORIGINATED
2
$162,135
122
$353,350
296
$281,487
32
$157,189
25
$245,579
8
$188,005
APPLICATIONS APPROVED, NOT ACCEPTED
0
$0
34
$337,819
51
$299,235
3
$146,960
4
$265,642
6
$183,708
APPLICATIONS DENIED
0
$0
46
$324,518
106
$302,925
22
$137,014
15
$337,491
11
$116,828
APPLICATIONS WITHDRAWN
0
$0
30
$274,426
74
$334,560
6
$193,138
3
$239,830
0
$0
FILES CLOSED FOR INCOMPLETENESS
0
$0
2
$369,295
31
$325,571
1
$401,990
0
$0
0
$0
Aggregated Statistics For Year 2003 (Based on 4 partial tracts)
A) FHA, FSA/RHS & VA Home Purchase Loans
B) Conventional Home Purchase Loans
C) Refinancings
D) Home Improvement Loans
E) Loans on Dwellings For 5+ Families
F) Non-occupant Loans on < 5 Family Dwellings (A B C & D)
Number
Average Value
Number
Average Value
Number
Average Value
Number
Average Value
Number
Average Value
Number
Average Value
LOANS ORIGINATED
1
$307,030
98
$276,157
558
$231,762
10
$74,272
0
$0
23
$211,367
APPLICATIONS APPROVED, NOT ACCEPTED
0
$0
10
$204,911
72
$247,420
8
$23,390
0
$0
4
$201,922
APPLICATIONS DENIED
0
$0
22
$256,193
179
$244,089
11
$44,530
1
$2,363,340
11
$164,145
APPLICATIONS WITHDRAWN
0
$0
12
$322,633
104
$222,717
2
$56,840
0
$0
1
$254,110
FILES CLOSED FOR INCOMPLETENESS
0
$0
6
$358,612
21
$235,079
1
$540,190
0
$0
2
$345,305
Aggregated Statistics For Year 2002 (Based on 2 partial tracts)
B) Conventional Home Purchase Loans
C) Refinancings
D) Home Improvement Loans
F) Non-occupant Loans on < 5 Family Dwellings (A B C & D)
Number
Average Value
Number
Average Value
Number
Average Value
Number
Average Value
LOANS ORIGINATED
22
$205,527
70
$188,568
9
$41,520
2
$95,940
APPLICATIONS APPROVED, NOT ACCEPTED
4
$171,180
9
$169,320
4
$23,760
0
$0
APPLICATIONS DENIED
7
$266,914
14
$176,169
6
$35,760
0
$0
APPLICATIONS WITHDRAWN
3
$172,200
12
$186,060
2
$27,900
1
$147,240
FILES CLOSED FOR INCOMPLETENESS
2
$120,780
6
$204,540
0
$0
0
$0
Aggregated Statistics For Year 2001 (Based on 2 partial tracts)
A) FHA, FSA/RHS & VA Home Purchase Loans
B) Conventional Home Purchase Loans
C) Refinancings
D) Home Improvement Loans
F) Non-occupant Loans on < 5 Family Dwellings (A B C & D)
Number
Average Value
Number
Average Value
Number
Average Value
Number
Average Value
Number
Average Value
LOANS ORIGINATED
5
$204,696
36
$179,100
44
$181,538
6
$36,060
3
$183,840
APPLICATIONS APPROVED, NOT ACCEPTED
0
$0
4
$141,030
8
$153,180
0
$0
1
$106,920
APPLICATIONS DENIED
0
$0
4
$178,200
18
$195,980
1
$19,080
1
$222,120
APPLICATIONS WITHDRAWN
0
$0
5
$170,712
12
$192,300
1
$82,440
1
$186,840
FILES CLOSED FOR INCOMPLETENESS
0
$0
0
$0
1
$200,520
0
$0
0
$0
Aggregated Statistics For Year 2000 (Based on 2 partial tracts)
A) FHA, FSA/RHS & VA Home Purchase Loans
B) Conventional Home Purchase Loans
C) Refinancings
D) Home Improvement Loans
F) Non-occupant Loans on < 5 Family Dwellings (A B C & D)
Number
Average Value
Number
Average Value
Number
Average Value
Number
Average Value
Number
Average Value
LOANS ORIGINATED
3
$177,360
23
$137,958
12
$104,460
4
$33,210
2
$82,800
APPLICATIONS APPROVED, NOT ACCEPTED
0
$0
3
$129,960
3
$152,760
2
$21,060
1
$114,480
APPLICATIONS DENIED
0
$0
5
$172,296
9
$130,640
2
$33,300
0
$0
APPLICATIONS WITHDRAWN
0
$0
2
$214,740
6
$97,740
0
$0
0
$0
FILES CLOSED FOR INCOMPLETENESS
0
$0
1
$92,160
4
$112,500
0
$0
0
$0
Aggregated Statistics For Year 1999 (Based on 2 partial tracts)
A) FHA, FSA/RHS & VA Home Purchase Loans
B) Conventional Home Purchase Loans
C) Refinancings
D) Home Improvement Loans
F) Non-occupant Loans on < 5 Family Dwellings (A B C & D)
Detailed PMIC statistics for the following Tracts:0001.01
, 0048.00
2005 - 2018 National Fire Incident Reporting System (NFIRS) incidents
According to the data from the years 2005 - 2018 the average number of fire incidents per year is 17. The highest number of fires - 48 took place in 2006, and the least - 1 in 2005. The data has a rising trend.
When looking into fire subcategories, the most incidents belonged to: Outside Fires (64.8%), and Mobile Property/Vehicle Fires (22.5%).
Fire incident types reported to NFIRS in Zip Code 95230


+$1,326
-$7,562
 Nearest zip codes: 95236, 95252, 95225, 95254, 95228, 95320.


 According to the data from the years 2005 - 2018 the average number of fire incidents per year is 17. The highest number of fires - 48 took place in 2006, and the least - 1 in 2005. The data has a rising trend.
 When looking into fire subcategories, the most incidents belonged to: Outside Fires (64.8%), and Mobile Property/Vehicle Fires (22.5%).