Estimated zip code population in 2022: 713 Zip code population in 2010: 623 Zip code population in 2000: 488
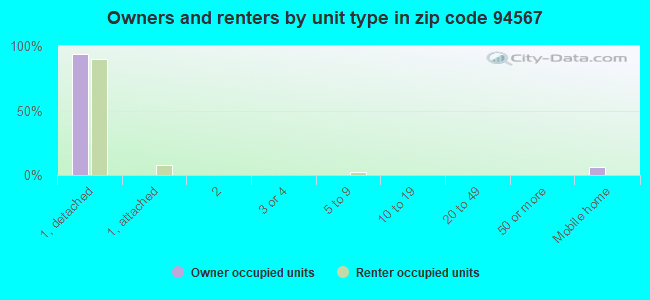
Houses and condos: 294 Renter-occupied apartments: 80
% of renters here:
36%
State:
44%
March 2022 cost of living index in zip code 94567: 107.1 (more than average, U.S. average is 100)
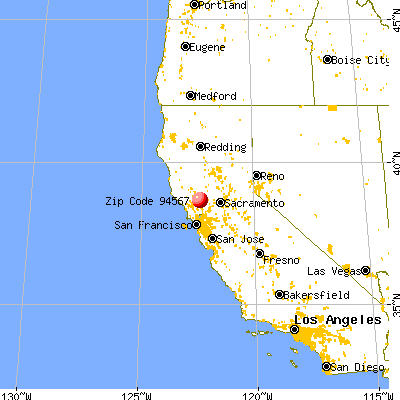
Land area: 131.4 sq. mi. Water area: 2.4 sq. mi.
Population density: 5 people per square mile
(very low).
OSM Map
General Map
Google Map
MSN Map
OSM Map
General Map
Google Map
MSN Map
OSM Map
General Map
Google Map
MSN Map
OSM Map
General Map
Google Map
MSN Map
Please wait while loading the map...
Real estate property taxes paid for housing units in 2022:
This zip code:
1.0% ($4,002)
California:
0.7% ($4,831)
Median real estate property taxes paid for housing units with mortgages in 2022: $4,229 (1.1%) Median real estate property taxes paid for housing units with no mortgage in 2022: $3,699 (0.6%)
Business Search- 14 Million verified businesses
Males: 343
(48.2%)
Females: 369
(51.8%)
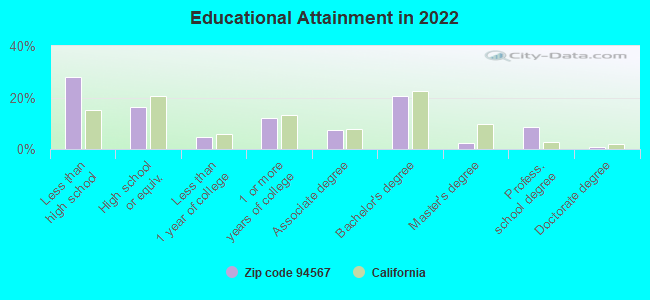
For population 25 years and over in 94567:
High school or higher: 73.5%
Bachelor's degree or higher: 32.3%
Graduate or professional degree: 11.5%
Unemployed: 1.5%
Mean travel time to work (commute): 31.7 minutes
For population 15 years and over in 94567:
Never married: 26.4%
Now married: 49.0%
Separated: 0.7%
Widowed: 5.1%
Divorced: 18.8%
Zip code 94567 compared to state average:
Median household income below state average.
Median house value below state average.
Unemployed percentage significantly below state average.
Black race population percentage significantly below state average.
Median age above state average.
Foreign-born population percentage below state average.
Length of stay since moving in significantly below state average.
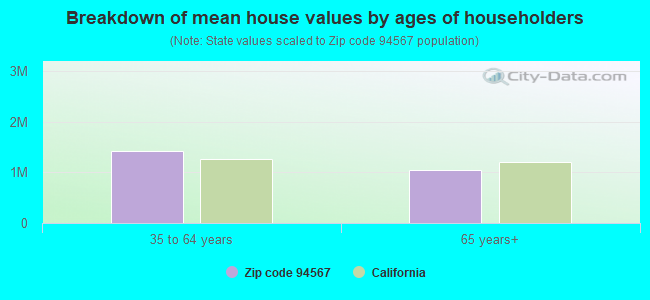
Estimated median house/condo value in 2022: $410,559
94567:
$410,559
California:
$715,900
According to our research of California and other state lists, there was 1 registered sex offender living in 94567 zip code as of July 18, 2024. The ratio of all residents to sex offenders in zip code 94567 is 595 to 1.
Median resident age:
This zip code:
43.0 years
California median age:
37.9 years
Average household size:
This zip code:
3.2 people
California:
2.8 people
Averages for the 2020 tax year for zip code 94567, filed in 2021:
Average Adjusted Gross Income (AGI) in 2020: $155,710 (Individual Income Tax Returns)
Here:
$155,710
State:
$95,910
Salary/wage: $64,620 (reported on 83.3% of returns)
Here:
$64,620
State:
$77,331
(% of AGI for various income ranges: 1364.0% for AGIs below $25k, 4897.5% for AGIs $25k-50k, 8220.0% for AGIs $50k-75k, 10165.0% for AGIs $75k-100k, 30050.0% for AGIs $100k-200k)
Taxable interest for individuals: $2,167 (reported on 40.0% of returns)
This zip code:
$2,167
California:
$2,294
(% of AGI for various income ranges: 14.0% for AGIs below $25k, 6.7% for AGIs $50k-75k, 250.0% for AGIs $100k-200k)
Ordinary dividends: $17,220 (reported on 16.7% of returns)
Here:
$17,220
State:
$10,949
(% of AGI for various income ranges: 126.0% for AGIs below $25k, 2660.0% for AGIs $100k-200k)
Net capital gain/loss in AGI: +$109,580 (reported on 16.7% of returns)
Here:
+$109,580
State:
+$49,306
(% of AGI for various income ranges: 18.0% for AGIs below $25k, 18233.3% for AGIs $100k-200k)
Profit/loss from business: +$27,825 (reported on 13.3% of returns)
Here:
+$27,825
State:
+$15,671
(% of AGI for various income ranges: 5565.0% for AGIs $75k-100k)
Taxable individual retirement arrangement distribution: $20,650 (reported on 6.7% of returns)
94567:
$20,650
California:
$23,505
(% of AGI for various income ranges: 1376.7% for AGIs $50k-75k)
Total itemized deductions: $25,250 (reported on 13.3% of returns)
Here:
$25,250
State:
$39,517
(% of AGI for various income ranges: 3366.7% for AGIs $100k-200k)
Taxes paid: $8,900 (reported on 10.0% of returns)
94567:
$8,900
State:
$8,807
(% of AGI for various income ranges: 890.0% for AGIs $100k-200k)
Earned income credit: $1,075 (reported on 13.3% of returns)
Here:
$1,075
State:
$2,074
(% of AGI for various income ranges: 86.0% for AGIs below $25k)
Percentage of individuals using paid preparers for their 2020 taxes: 90.0%
Here:
90%
State:
92%
(% for various income ranges: 88.9% for AGIs below $25k, 85.7% for AGIs $25k-50k, 80.0% for AGIs $50k-75k, 100.0% for AGIs $75k-100k, 100.0% for AGIs $100k-200k, 100.0% for AGIs over 200k)
Averages for the 2012 tax year for zip code 94567, filed in 2013:
Average Adjusted Gross Income (AGI) in 2012: $55,453 (Individual Income Tax Returns)
Here:
$55,453
State:
$72,726
Salary/wage: $43,370 (reported on 71.9% of returns)
Here:
$43,370
State:
$59,079
(% of AGI for various income ranges: 57.5% for AGIs below $25k, 72.7% for AGIs $25k-50k, 61.0% for AGIs $50k-75k, 78.5% for AGIs $75k-100k, 43.9% for AGIs $100k-200k)
Taxable interest for individuals: $2,077 (reported on 40.6% of returns)
This zip code:
$2,077
California:
$2,146
(% of AGI for various income ranges: 1.1% for AGIs below $25k, 1.0% for AGIs $25k-50k, 0.6% for AGIs $50k-75k, 2.4% for AGIs $100k-200k)
Ordinary dividends: $11,386 (reported on 21.9% of returns)
Here:
$11,386
State:
$9,308
Net capital gain/loss in AGI: +$15,283 (reported on 18.8% of returns)
Here:
+$15,283
State:
+$30,460
Profit/loss from business: +$19,186 (reported on 21.9% of returns)
Here:
+$19,186
State:
+$17,064
(% of AGI for various income ranges: 14.9% for AGIs below $25k, 30.1% for AGIs $25k-50k, 10.5% for AGIs $75k-100k)
Taxable individual retirement arrangement distribution: $7,450 (reported on 6.2% of returns)
94567:
$7,450
California:
$19,557
Total itemized deductions: $22,338 (24% of AGI, reported on 40.6% of returns)
Here:
$22,338
State:
$34,004
Here:
23.7% of AGI
State:
22.7% of AGI
(% of AGI for various income ranges: 20.9% for AGIs below $25k, 11.6% for AGIs $25k-50k, 36.5% for AGIs $50k-75k, 16.5% for AGIs $100k-200k)
Charity contributions: $3,278 (reported on 28.1% of returns)
Here:
$3,278
State:
$4,659
(% of AGI for various income ranges: 3.2% for AGIs below $25k, 3.6% for AGIs $50k-75k, 1.9% for AGIs $100k-200k)
Taxes paid: $10,192 (reported on 37.5% of returns)
94567:
$10,192
State:
$14,448
(% of AGI for various income ranges: 5.3% for AGIs below $25k, 2.7% for AGIs $25k-50k, 12.1% for AGIs $50k-75k, 9.0% for AGIs $100k-200k)
Earned income credit: $1,660 (reported on 15.6% of returns)
Here:
$1,660
State:
$2,286
(% of AGI for various income ranges: 5.2% for AGIs below $25k)
Percentage of individuals using paid preparers for their 2012 taxes: 62.5%
Here:
62%
State:
64%
(% for various income ranges: 58.3% for AGIs below $25k, 62.5% for AGIs $25k-50k, 50.0% for AGIs $50k-75k, 66.7% for AGIs $75k-100k, 80.0% for AGIs $100k-200k)
Averages for the 2004 tax year for zip code 94567, filed in 2005:
Average Adjusted Gross Income (AGI) in 2004: $52,562 (Individual Income Tax Returns)
Here:
$52,562
State:
$58,600
Salary/wage: $43,359 (reported on 74.8% of returns)
Here:
$43,359
State:
$49,455
(% of AGI for various income ranges: 70.4% for AGIs $10k-25k, 73.6% for AGIs $25k-50k, 80.1% for AGIs $50k-75k, 80.3% for AGIs $75k-100k, 34.0% for AGIs over 100k)
Taxable interest for individuals: $1,507 (reported on 51.0% of returns)
This zip code:
$1,507
California:
$2,365
(% of AGI for various income ranges: 1.2% for AGIs $10k-25k, 4.0% for AGIs $25k-50k, 0.9% for AGIs $50k-75k, 0.1% for AGIs $75k-100k, 0.6% for AGIs over 100k)
Taxable dividends: $3,100 (reported on 20.7% of returns)
Here:
$3,100
State:
$4,746
(% of AGI for various income ranges: 0.7% for AGIs $25k-50k, 0.9% for AGIs $50k-75k, 1.9% for AGIs over 100k)
Net capital gain/loss: +$15,515 (reported on 22.8% of returns)
Here:
+$15,515
State:
+$23,418
(% of AGI for various income ranges: -0.9% for AGIs $25k-50k, 2.1% for AGIs $50k-75k, 15.1% for AGIs over 100k)
Profit/loss from business: +$9,419 (reported on 21.4% of returns)
Here:
+$9,419
State:
+$16,826
(% of AGI for various income ranges: 10.0% for AGIs $10k-25k, 4.6% for AGIs $25k-50k, 6.7% for AGIs $50k-75k)
Total itemized deductions: $25,669 (32% of AGI, reported on 50.0% of returns)
Here:
$25,669
State:
$28,113
Here:
31.5% of AGI
State:
25.3% of AGI
(% of AGI for various income ranges: 29.9% for AGIs $10k-25k, 23.9% for AGIs $25k-50k, 25.1% for AGIs $50k-75k, 25.2% for AGIs $75k-100k, 21.5% for AGIs over 100k)
Charity contributions deductions: $4,252 (5% of AGI, reported on 41.0% of returns)
Here:
$4,252
State:
$3,923
Here:
5.0% of AGI
State:
3.3% of AGI
(% of AGI for various income ranges: 2.1% for AGIs $10k-25k, 3.1% for AGIs $25k-50k, 4.5% for AGIs $50k-75k, 1.9% for AGIs $75k-100k, 3.2% for AGIs over 100k)
Total tax: $7,575 (reported on 77.9% of returns)
94567:
$7,575
State:
$10,761
(% of AGI for various income ranges: 4.4% for AGIs $10k-25k, 6.3% for AGIs $25k-50k, 7.6% for AGIs $50k-75k, 9.1% for AGIs $75k-100k, 15.4% for AGIs over 100k)
Earned income credit: $1,125 (reported on 8.3% of returns)
Here:
$1,125
State:
$1,763
Percentage of individuals using paid preparers for their 2004 taxes: 64.8%
Here:
65%
State:
66%
(% for various income ranges: 53.8% for AGIs below $10k, 63.2% for AGIs $10k-25k, 68.5% for AGIs $25k-50k, 66.7% for AGIs $50k-75k, 69.2% for AGIs $75k-100k, 71.4% for AGIs over 100k)
Household received Food Stamps/SNAP in the past 12 months: 67 Household did not receive Food Stamps/SNAP in the past 12 months: 163
Women who had a birth in the past 12 months: 8 (1 now married, 7 unmarried) Women who did not have a birth in the past 12 months: 125 (49 now married, 76 unmarried)
Housing units in zip code 94567 with a mortgage: 93 (3 second mortgage) Median monthly owner costs for units with a mortgage: $2,300 Median monthly owner costs for units without a mortgage: $959
Residents with income below the poverty level in 2022:
This zip code:
21.0%
Whole state:
12.2%
Residents with income below 50% of the poverty level in 2022:
This zip code:
18.5%
Whole state:
6.2%
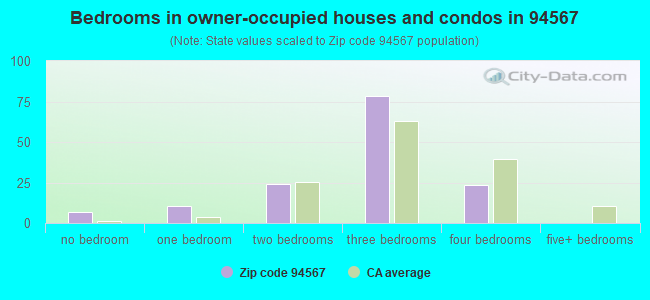
Median number of rooms in houses and condos:
Here:
5.8
State:
6.0
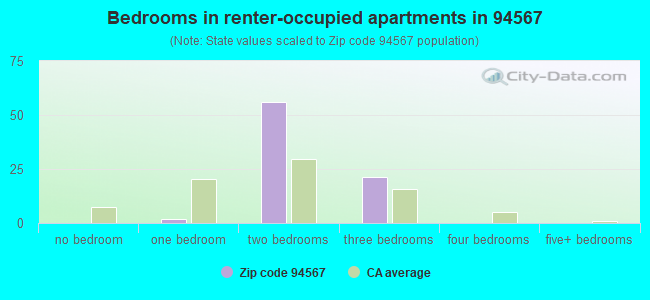
Median number of rooms in apartments:
Here:
4.5
State:
3.9
Notable locations in this zip code not listed on our city pages
Notable locations in zip code 94567: Round Corral (A), Putah Creek Park (B), Camp Berryessa (C), Pope Valley Winery (D). Display/hide their locations on the map
Creeks: Cement Creek (A), Dyer Creek (B), Foley Creek (C), Jerd Creek (D), John Thomas Creek (E), Knoxville Creek (F), Mysterious Creek (G), Nevada Creek (H), Zim Zim Creek (I). Display/hide their locations on the map
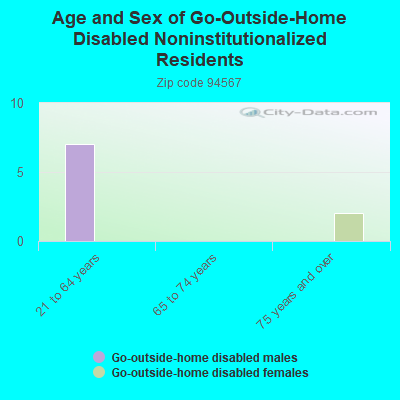
In group quarters: 5 (-1 institutionalized population)
Size of family households: 47 2-persons, 19 3-persons, 51 4-persons, 3 5-persons, 18 6-persons, 7 7-or-more-persons
Size of nonfamily households: 62 1-person, 9 2-persons, 2 3-persons
88 married couples with children.
101 single-parent households (17 men, 84 women).
72.9% of residents of 94567 zip code speak English at home.
26.5% of residents speak Spanish at home (34% very well, 28% well, 18% not well, 19% not at all).
0.7% of residents speak other Indo-European language at home (100% very well).
Foreign born population: 115 (16.2%) (44.4% of them are naturalized citizens)
This zip code:
16.2%
Whole state:
26.7%
55%Honduras
9%Azores Islands
8%Guyana
5%Belize
3%Costa Rica
3%El Salvador
3%Chile
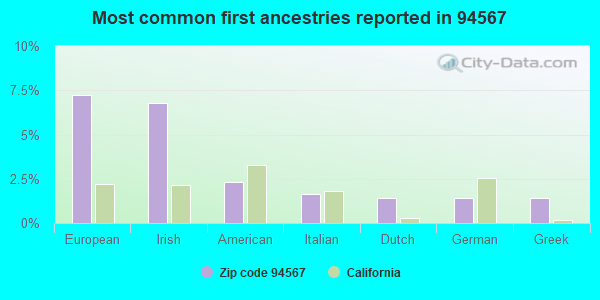
7%European
7%Irish
2%American
2%Italian
1%Dutch
1%German
1%Greek
Year of entry for the foreign-born population
22010 or later
02000 to 2009
661990 to 1999
48Before 1990
Facilities with environmental interests located in this zip code:
LAKE BERRYESSA ESTATES DISPOSAL SITE (1/2 MI E DEPUTY DR & STAGECOAT in POPE VALLEY, CA)
CRITERIA AND HAZARDOUS AIR POLLUTANT INVENTORY (Inventory of air pollution sources) Business SIC classification: REFUSE SYSTEMS Business NAICS classification: SOLID WASTE LANDFILL.
Housing units lacking complete plumbing facilities: 3.4% Housing units lacking complete kitchen facilities: 3.2%
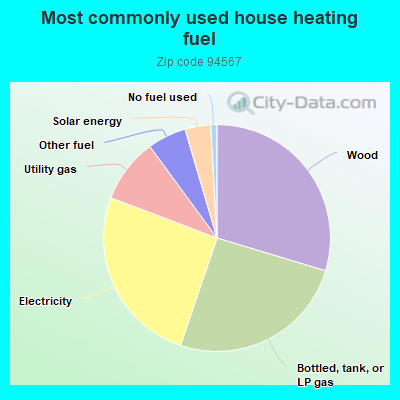
30.1%Wood
25.9%Bottled, tank, or LP gas
25.9%Electricity
9.3%Utility gas
5.6%Other fuel
3.7%Solar energy
0.9%No fuel used
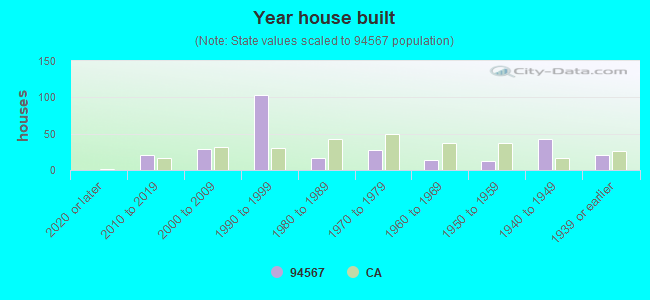
Population in 1990: 286. Population change in the 1990s: +202 (+70.6%).
Place of birth for U.S.-born residents:
This state: 526
Northeast: 2
Midwest: 27
South: 32
West: 2
56% of the 94567 zip code residents lived in the same house 5 years ago. Out of people who lived in different houses, 48% lived in this county. Out of people who lived in different counties, 50% lived in California.
90% of the 94567 zip code residents lived in the same house 1 year ago. Out of people who lived in different houses, 75% moved from this county. Out of people who lived in different houses, 14% moved from different county within same state. Out of people who lived in different houses, 6% moved from different state.
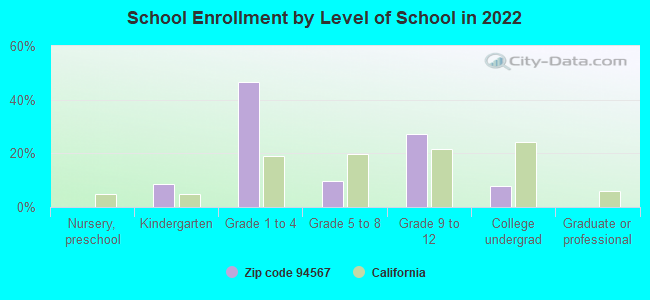
Private vs. public school enrollment:
Students in private schools in grades 1 to 8 (elementary and middle school): 30
Here:
29.6%
California:
10.5%
Students in private schools in grades 9 to 12 (high school): 8
Here:
16.5%
California:
8.5%
Students in private undergraduate colleges:
Here:
0.0%
California:
15.9%
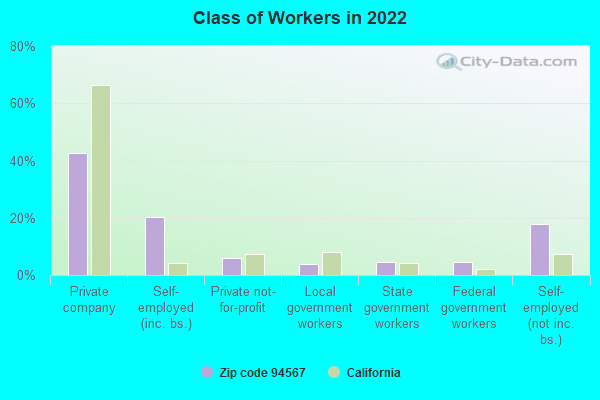
Occupation by median earnings in the past 12 months ($)
71,665Management occupations
65,401Construction and extraction occupations
54,869Building and grounds cleaning and maintenance occupations
31,532Healthcare support occupations
30,618Office and administrative support occupations
16,594Sales and related occupations
Top industries in this zip code by the number of employees in 2005:
Real Estate and Rental and Leasing: Offices of Real Estate Agents and Brokers (20-49 employees: 1 establishment)
Other Services (except Public Administration): Religious Organizations (10-19: 1)
Construction: Drywall and Insulation Contractors (5-9: 1)
Construction: Structural Steel and Precast Concrete Contractors (5-9: 1)
Construction: Plumbing, Heating, and Air-Conditioning Contractors (5-9: 1)
Construction: Land Subdivision (5-9: 1)
Construction: New Single-Family Housing Construction (except Operative Builders) (1-4: 2)
Real Estate and Rental and Leasing: Other Activities Related to Real Estate (1-4: 1)
Professional, Scientific, and Technical Services: All Other Professional, Scientific, and Technical Services (1-4: 1)
People in group quarters in 2010:
5 people in other noninstitutional facilities
Fatal accident statistics in 2012:
Fatal accident count: 1
Vehicles involved in fatal accidents: 1
Fatal accidents caused by drunken drivers: 0
Fatalities: 1
Persons involved in fatal accidents: 1
Pedestrians involved in fatal accidents: 0
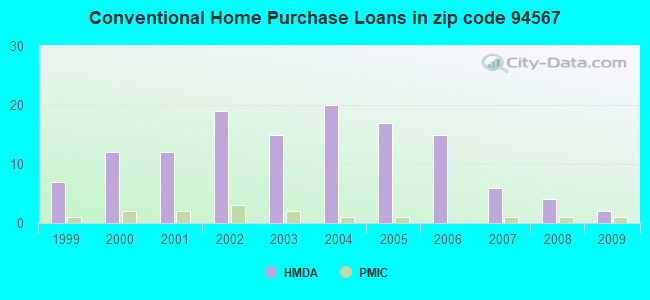
Home Mortgage Disclosure Act Aggregated Statistics For Year 2009 (Based on 2 partial tracts)
A) FHA, FSA/RHS & VA Home Purchase Loans
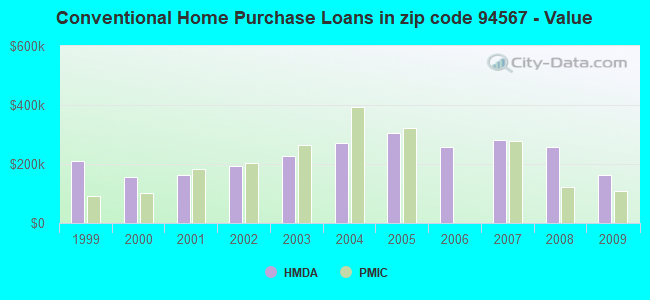
B) Conventional Home Purchase Loans
C) Refinancings
F) Non-occupant Loans on < 5 Family Dwellings (A B C & D)
G) Loans On Manufactured Home Dwelling (A B C & D)
Number
Average Value
Number
Average Value
Number
Average Value
Number
Average Value
Number
Average Value
LOANS ORIGINATED
2
$155,365
2
$162,930
10
$265,796
3
$260,473
1
$100,510
APPLICATIONS APPROVED, NOT ACCEPTED
0
$0
1
$36,210
3
$221,653
1
$144,560
1
$78,360
APPLICATIONS DENIED
1
$119,430
1
$215,620
10
$316,701
2
$165,090
1
$208,050
APPLICATIONS WITHDRAWN
1
$58,090
1
$160,770
5
$271,388
1
$179,950
2
$139,290
FILES CLOSED FOR INCOMPLETENESS
0
$0
0
$0
1
$54,040
0
$0
0
$0
Aggregated Statistics For Year 2008 (Based on 2 partial tracts)
A) FHA, FSA/RHS & VA Home Purchase Loans
B) Conventional Home Purchase Loans
C) Refinancings
D) Home Improvement Loans
F) Non-occupant Loans on < 5 Family Dwellings (A B C & D)
G) Loans On Manufactured Home Dwelling (A B C & D)
Number
Average Value
Number
Average Value
Number
Average Value
Number
Average Value
Number
Average Value
Number
Average Value
LOANS ORIGINATED
1
$222,640
4
$258,582
7
$305,827
1
$150,230
4
$197,788
2
$148,070
APPLICATIONS APPROVED, NOT ACCEPTED
0
$0
1
$99,160
2
$320,455
0
$0
0
$0
0
$0
APPLICATIONS DENIED
0
$0
1
$62,690
11
$308,470
1
$120,240
2
$330,185
1
$72,140
APPLICATIONS WITHDRAWN
0
$0
0
$0
3
$292,807
0
$0
0
$0
1
$93,220
FILES CLOSED FOR INCOMPLETENESS
0
$0
0
$0
1
$143,750
0
$0
1
$120,780
0
$0
Aggregated Statistics For Year 2007 (Based on 2 partial tracts)
B) Conventional Home Purchase Loans
C) Refinancings
D) Home Improvement Loans
F) Non-occupant Loans on < 5 Family Dwellings (A B C & D)
G) Loans On Manufactured Home Dwelling (A B C & D)
Number
Average Value
Number
Average Value
Number
Average Value
Number
Average Value
Number
Average Value
LOANS ORIGINATED
6
$279,747
19
$427,513
4
$145,368
5
$281,548
5
$233,020
APPLICATIONS APPROVED, NOT ACCEPTED
2
$418,405
5
$325,536
1
$83,220
1
$311,810
0
$0
APPLICATIONS DENIED
4
$353,895
17
$364,023
4
$147,800
2
$282,900
2
$246,965
APPLICATIONS WITHDRAWN
1
$629,300
6
$432,770
1
$120,240
0
$0
0
$0
FILES CLOSED FOR INCOMPLETENESS
1
$212,650
4
$351,192
0
$0
0
$0
0
$0
Aggregated Statistics For Year 2006 (Based on 2 partial tracts)
B) Conventional Home Purchase Loans
C) Refinancings
D) Home Improvement Loans
F) Non-occupant Loans on < 5 Family Dwellings (A B C & D)
G) Loans On Manufactured Home Dwelling (A B C & D)
Number
Average Value
Number
Average Value
Number
Average Value
Number
Average Value
Number
Average Value
LOANS ORIGINATED
15
$258,545
26
$317,142
5
$233,994
5
$335,534
4
$222,848
APPLICATIONS APPROVED, NOT ACCEPTED
4
$245,882
6
$368,373
1
$39,990
1
$450,690
1
$173,200
APPLICATIONS DENIED
4
$282,495
19
$305,084
2
$296,005
3
$308,750
2
$174,415
APPLICATIONS WITHDRAWN
3
$362,337
13
$303,497
1
$322,890
1
$397,460
1
$265,340
FILES CLOSED FOR INCOMPLETENESS
1
$235,070
4
$255,340
0
$0
1
$54,310
0
$0
Aggregated Statistics For Year 2005 (Based on 2 partial tracts)
A) FHA, FSA/RHS & VA Home Purchase Loans
B) Conventional Home Purchase Loans
C) Refinancings
D) Home Improvement Loans
F) Non-occupant Loans on < 5 Family Dwellings (A B C & D)
G) Loans On Manufactured Home Dwelling (A B C & D)
Number
Average Value
Number
Average Value
Number
Average Value
Number
Average Value
Number
Average Value
Number
Average Value
LOANS ORIGINATED
1
$135,640
17
$304,436
25
$311,832
3
$193,733
6
$256,375
6
$258,087
APPLICATIONS APPROVED, NOT ACCEPTED
0
$0
5
$256,150
5
$283,494
1
$136,450
1
$211,570
3
$146,720
APPLICATIONS DENIED
0
$0
7
$225,694
17
$309,951
2
$198,595
2
$291,410
4
$233,790
APPLICATIONS WITHDRAWN
0
$0
2
$275,335
13
$289,384
2
$192,790
2
$237,910
2
$286,140
FILES CLOSED FOR INCOMPLETENESS
0
$0
1
$247,230
7
$333,157
0
$0
0
$0
1
$409,620
Aggregated Statistics For Year 2004 (Based on 2 partial tracts)
B) Conventional Home Purchase Loans
C) Refinancings
D) Home Improvement Loans
F) Non-occupant Loans on < 5 Family Dwellings (A B C & D)
G) Loans On Manufactured Home Dwelling (A B C & D)
Number
Average Value
Number
Average Value
Number
Average Value
Number
Average Value
Number
Average Value
LOANS ORIGINATED
20
$272,564
35
$264,619
5
$156,230
7
$263,136
6
$190,267
APPLICATIONS APPROVED, NOT ACCEPTED
3
$259,483
5
$268,958
1
$318,300
1
$155,370
2
$144,825
APPLICATIONS DENIED
5
$202,110
17
$258,756
4
$223,185
1
$323,160
1
$418,810
APPLICATIONS WITHDRAWN
3
$219,763
8
$225,618
1
$18,910
1
$150,500
1
$58,090
FILES CLOSED FOR INCOMPLETENESS
1
$186,170
5
$200,812
0
$0
0
$0
1
$196,170
Aggregated Statistics For Year 2003 (Based on 2 partial tracts)
B) Conventional Home Purchase Loans
C) Refinancings
D) Home Improvement Loans
F) Non-occupant Loans on < 5 Family Dwellings (A B C & D)
Number
Average Value
Number
Average Value
Number
Average Value
Number
Average Value
LOANS ORIGINATED
15
$225,869
50
$221,926
3
$62,057
9
$205,082
APPLICATIONS APPROVED, NOT ACCEPTED
2
$218,185
7
$164,629
1
$16,210
1
$174,280
APPLICATIONS DENIED
4
$226,360
17
$214,030
1
$22,970
1
$182,930
APPLICATIONS WITHDRAWN
4
$188,870
15
$202,127
0
$0
1
$209,680
FILES CLOSED FOR INCOMPLETENESS
1
$115,650
3
$229,490
1
$16,210
0
$0
Aggregated Statistics For Year 2002 (Based on 2 partial tracts)
A) FHA, FSA/RHS & VA Home Purchase Loans
B) Conventional Home Purchase Loans
C) Refinancings
D) Home Improvement Loans
F) Non-occupant Loans on < 5 Family Dwellings (A B C & D)
Number
Average Value
Number
Average Value
Number
Average Value
Number
Average Value
Number
Average Value
LOANS ORIGINATED
1
$187,790
19
$194,885
36
$176,756
2
$62,820
7
$169,531
APPLICATIONS APPROVED, NOT ACCEPTED
0
$0
2
$168,065
7
$146,564
0
$0
1
$202,650
APPLICATIONS DENIED
0
$0
5
$149,420
13
$175,381
2
$89,705
2
$174,685
APPLICATIONS WITHDRAWN
0
$0
2
$233,860
8
$173,638
0
$0
2
$120,510
FILES CLOSED FOR INCOMPLETENESS
0
$0
0
$0
2
$150,500
0
$0
0
$0
Aggregated Statistics For Year 2001 (Based on 2 partial tracts)
A) FHA, FSA/RHS & VA Home Purchase Loans
B) Conventional Home Purchase Loans
C) Refinancings
D) Home Improvement Loans
F) Non-occupant Loans on < 5 Family Dwellings (A B C & D)
Number
Average Value
Number
Average Value
Number
Average Value
Number
Average Value
Number
Average Value
LOANS ORIGINATED
1
$90,790
12
$161,399
26
$206,287
3
$38,820
4
$220,078
APPLICATIONS APPROVED, NOT ACCEPTED
0
$0
3
$165,003
5
$168,984
0
$0
1
$230,750
APPLICATIONS DENIED
0
$0
7
$113,446
12
$162,435
1
$19,720
1
$187,250
APPLICATIONS WITHDRAWN
0
$0
1
$124,020
9
$139,213
1
$37,290
1
$95,380
FILES CLOSED FOR INCOMPLETENESS
0
$0
1
$59,980
4
$150,772
0
$0
1
$85,920
Aggregated Statistics For Year 2000 (Based on 2 partial tracts)
A) FHA, FSA/RHS & VA Home Purchase Loans
B) Conventional Home Purchase Loans
C) Refinancings
D) Home Improvement Loans
F) Non-occupant Loans on < 5 Family Dwellings (A B C & D)
Number
Average Value
Number
Average Value
Number
Average Value
Number
Average Value
Number
Average Value
LOANS ORIGINATED
3
$149,510
12
$155,005
7
$240,324
1
$26,210
4
$132,938
APPLICATIONS APPROVED, NOT ACCEPTED
0
$0
2
$97,270
1
$131,590
0
$0
1
$65,120
APPLICATIONS DENIED
0
$0
4
$87,275
6
$143,117
2
$21,885
0
$0
APPLICATIONS WITHDRAWN
0
$0
1
$108,620
4
$147,598
0
$0
1
$74,580
FILES CLOSED FOR INCOMPLETENESS
0
$0
0
$0
1
$196,980
0
$0
0
$0
Aggregated Statistics For Year 1999 (Based on 1 partial tract)
A) FHA, FSA/RHS & VA Home Purchase Loans
B) Conventional Home Purchase Loans
C) Refinancings
D) Home Improvement Loans
F) Non-occupant Loans on < 5 Family Dwellings (A B C & D)


 Nearest zip codes: 94508, 94574, 95461, 95467, 94576, 95679.