Estimated zip code population in 2022: 62,596 Zip code population in 2010: 61,087 Zip code population in 2000: 58,537
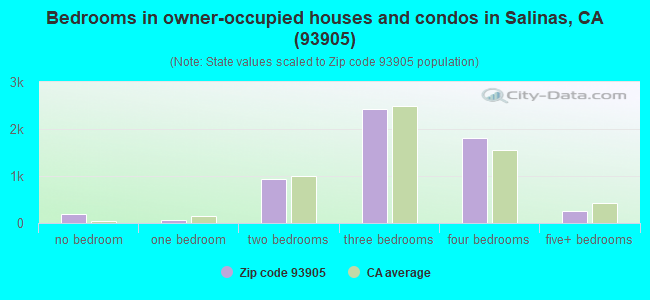
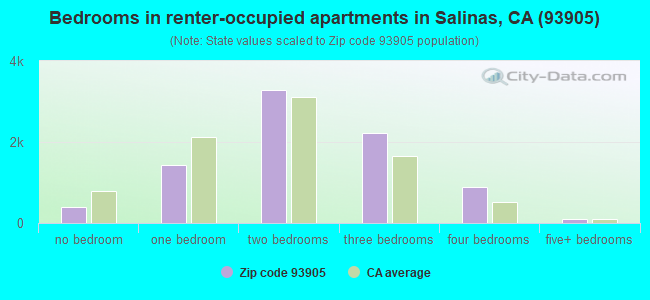
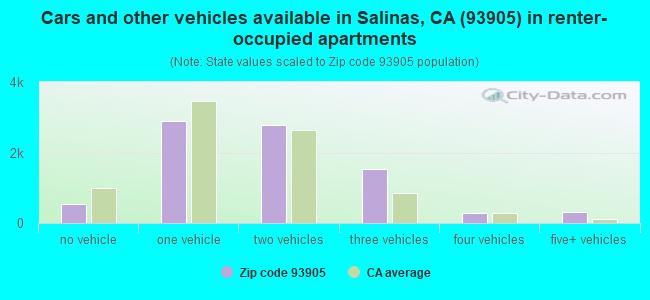
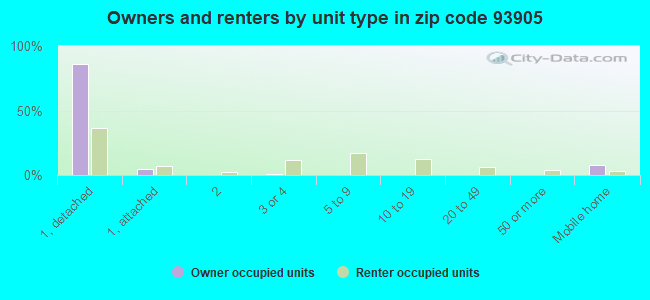
Houses and condos: 14,332 Renter-occupied apartments: 8,353
% of renters here:
60%
State:
44%
March 2022 cost of living index in zip code 93905: 106.7 (more than average, U.S. average is 100)
Land area: 9.3 sq. mi. Water area: 0.0 sq. mi.
Population density: 6,726 people per square mile
(high).
OSM Map
General Map
Google Map
MSN Map
OSM Map
General Map
Google Map
MSN Map
OSM Map
General Map
Google Map
MSN Map
OSM Map
General Map
Google Map
MSN Map
Please wait while loading the map...
Real estate property taxes paid for housing units in 2022:
This zip code:
0.7% ($4,046)
California:
0.7% ($4,831)
Median real estate property taxes paid for housing units with mortgages in 2022: $4,526 (0.8%) Median real estate property taxes paid for housing units with no mortgage in 2022: $3,051 (0.6%)
Business Search- 14 Million verified businesses
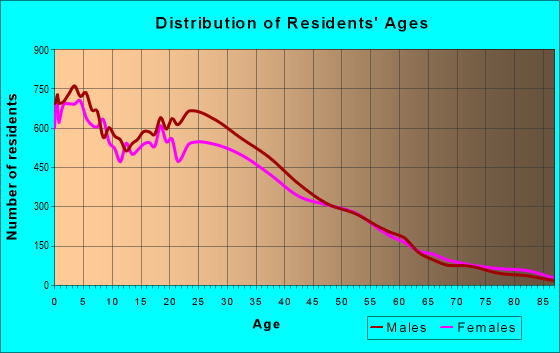
Males: 32,748
(52.3%)
Females: 29,846
(47.7%)
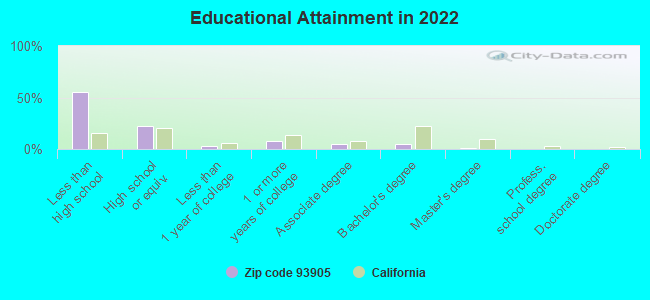
For population 25 years and over in 93905:
High school or higher: 43.7%
Bachelor's degree or higher: 6.1%
Graduate or professional degree: 1.5%
Unemployed: 4.7%
Mean travel time to work (commute): 24.6 minutes
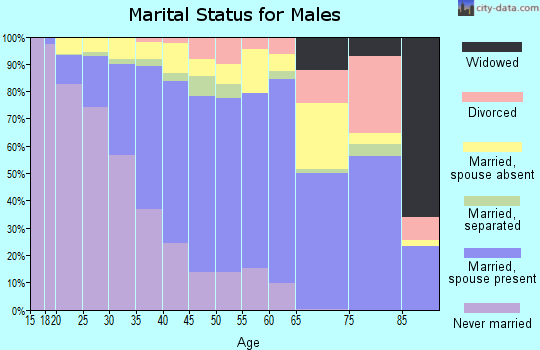
For population 15 years and over in 93905:
Never married: 49.9%
Now married: 41.7%
Separated: 1.5%
Widowed: 2.4%
Divorced: 4.6%
Zip code 93905 compared to state average:
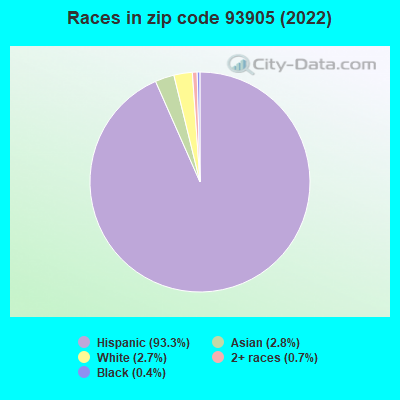
Black race population percentage significantly below state average.
Hispanic race population percentage above state average.
Median age significantly below state average.
Foreign-born population percentage above state average.
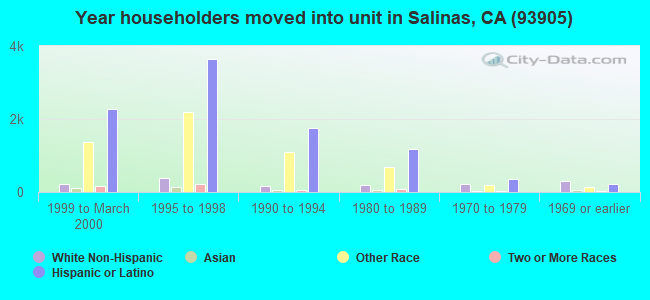
Length of stay since moving in significantly above state average.
Percentage of population with a bachelor's degree or higher significantly below state average.
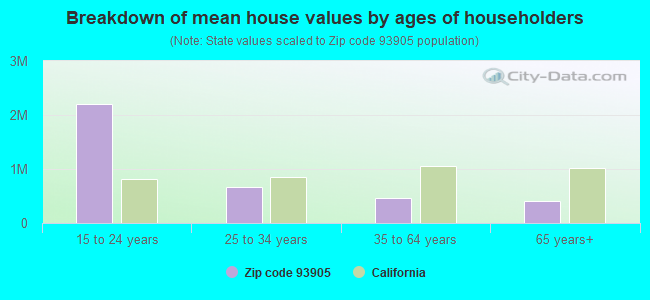
Estimated median house/condo value in 2022: $557,366
93905:
$557,366
California:
$715,900
According to our research of California and other state lists, there were 85 registered sex offenders living in 93905 zip code as of July 05, 2024. The ratio of all residents to sex offenders in zip code 93905 is 734 to 1. The ratio of registered sex offenders to all residents in this zip code is near the state average.
Median resident age:
This zip code:
29.1 years
California median age:
37.9 years
Average household size:
This zip code:
4.4 people
California:
2.8 people
Averages for the 2020 tax year for zip code 93905, filed in 2021:
Average Adjusted Gross Income (AGI) in 2020: $39,144 (Individual Income Tax Returns)
Here:
$39,144
State:
$95,910
Salary/wage: $36,678 (reported on 92.9% of returns)
Here:
$36,678
State:
$77,331
(% of AGI for various income ranges: 2645.8% for AGIs below $25k, 5619.9% for AGIs $25k-50k, 9454.8% for AGIs $50k-75k, 13399.2% for AGIs $75k-100k, 22721.9% for AGIs $100k-200k, 72387.5% for AGIs over 200k)
Taxable interest for individuals: $252 (reported on 14.6% of returns)
This zip code:
$252
California:
$2,294
(% of AGI for various income ranges: 2.5% for AGIs below $25k, 4.7% for AGIs $25k-50k, 11.2% for AGIs $50k-75k, 21.4% for AGIs $75k-100k, 21.1% for AGIs $100k-200k, 150.0% for AGIs over 200k)
Ordinary dividends: $1,315 (reported on 2.0% of returns)
Here:
$1,315
State:
$10,949
(% of AGI for various income ranges: 1.4% for AGIs below $25k, 2.2% for AGIs $25k-50k, 5.1% for AGIs $50k-75k, 18.2% for AGIs $75k-100k, 32.3% for AGIs $100k-200k, 77.5% for AGIs over 200k)
Net capital gain/loss in AGI: +$5,399 (reported on 2.5% of returns)
Here:
+$5,399
State:
+$49,306
(% of AGI for various income ranges: 1.1% for AGIs below $25k, 5.3% for AGIs $25k-50k, 11.0% for AGIs $50k-75k, 30.4% for AGIs $75k-100k, 144.9% for AGIs $100k-200k, 5352.5% for AGIs over 200k)
Profit/loss from business: +$6,564 (reported on 8.7% of returns)
Here:
+$6,564
State:
+$15,671
(% of AGI for various income ranges: 40.8% for AGIs below $25k, 49.5% for AGIs $25k-50k, 137.6% for AGIs $50k-75k, 316.0% for AGIs $75k-100k, 427.1% for AGIs $100k-200k, 5952.5% for AGIs over 200k)
Taxable individual retirement arrangement distribution: $8,655 (reported on 1.0% of returns)
93905:
$8,655
California:
$23,505
(% of AGI for various income ranges: 8.5% for AGIs below $25k, 8.7% for AGIs $25k-50k, 23.8% for AGIs $50k-75k, 35.3% for AGIs $75k-100k, 102.0% for AGIs $100k-200k)
Total itemized deductions: $27,122 (reported on 4.6% of returns)
Here:
$27,122
State:
$39,517
(% of AGI for various income ranges: 31.3% for AGIs below $25k, 99.6% for AGIs $25k-50k, 333.9% for AGIs $50k-75k, 714.1% for AGIs $75k-100k, 1693.3% for AGIs $100k-200k, 7225.0% for AGIs over 200k)
Charity contributions: $2,999 (reported on 3.5% of returns)
Here:
$2,999
State:
$12,598
(% of AGI for various income ranges: 0.9% for AGIs below $25k, 4.4% for AGIs $25k-50k, 22.9% for AGIs $50k-75k, 55.3% for AGIs $75k-100k, 187.1% for AGIs $100k-200k, 932.5% for AGIs over 200k)
Taxes paid: $8,164 (reported on 4.6% of returns)
93905:
$8,164
State:
$8,807
(% of AGI for various income ranges: 6.3% for AGIs below $25k, 27.4% for AGIs $25k-50k, 99.0% for AGIs $50k-75k, 230.0% for AGIs $75k-100k, 556.1% for AGIs $100k-200k, 1847.5% for AGIs over 200k)
Earned income credit: $2,378 (reported on 21.5% of returns)
Here:
$2,378
State:
$2,074
(% of AGI for various income ranges: 155.1% for AGIs below $25k, 111.3% for AGIs $25k-50k, 2.4% for AGIs $50k-75k)
Percentage of individuals using paid preparers for their 2020 taxes: 86.7%
Here:
87%
State:
92%
(% for various income ranges: 83.6% for AGIs below $25k, 87.6% for AGIs $25k-50k, 89.9% for AGIs $50k-75k, 90.4% for AGIs $75k-100k, 92.7% for AGIs $100k-200k, 93.3% for AGIs over 200k)
Averages for the 2012 tax year for zip code 93905, filed in 2013:
Average Adjusted Gross Income (AGI) in 2012: $28,710 (Individual Income Tax Returns)
Here:
$28,710
State:
$72,726
Salary/wage: $27,067 (reported on 95.2% of returns)
Here:
$27,067
State:
$59,079
(% of AGI for various income ranges: 90.3% for AGIs below $25k, 91.1% for AGIs $25k-50k, 90.5% for AGIs $50k-75k, 90.2% for AGIs $75k-100k, 85.1% for AGIs $100k-200k, 55.6% for AGIs over 200k)
Taxable interest for individuals: $286 (reported on 11.8% of returns)
This zip code:
$286
California:
$2,146
(% of AGI for various income ranges: 0.2% for AGIs $50k-75k, 0.1% for AGIs $75k-100k, 0.3% for AGIs $100k-200k)
Ordinary dividends: $1,308 (reported on 1.4% of returns)
Here:
$1,308
State:
$9,308
(% of AGI for various income ranges: 0.2% for AGIs $100k-200k)
Net capital gain/loss in AGI: +$734 (reported on 1.2% of returns)
Here:
+$734
State:
+$30,460
(% of AGI for various income ranges: 0.6% for AGIs $100k-200k)
Profit/loss from business: +$10,619 (reported on 6.4% of returns)
Here:
+$10,619
State:
+$17,064
(% of AGI for various income ranges: 3.1% for AGIs below $25k, 1.7% for AGIs $25k-50k, 1.1% for AGIs $50k-75k, 2.2% for AGIs $75k-100k, 5.3% for AGIs $100k-200k)
Taxable individual retirement arrangement distribution: $8,826 (reported on 1.0% of returns)
93905:
$8,826
California:
$19,557
(% of AGI for various income ranges: 0.2% for AGIs below $25k, 0.2% for AGIs $25k-50k, 0.5% for AGIs $50k-75k, 0.4% for AGIs $75k-100k, 0.7% for AGIs $100k-200k)
Total itemized deductions: $20,519 (33% of AGI, reported on 13.3% of returns)
Here:
$20,519
State:
$34,004
Here:
32.9% of AGI
State:
22.7% of AGI
(% of AGI for various income ranges: 2.1% for AGIs below $25k, 7.5% for AGIs $25k-50k, 17.4% for AGIs $50k-75k, 19.5% for AGIs $75k-100k, 20.3% for AGIs $100k-200k, 15.9% for AGIs over 200k)
Charity contributions: $1,492 (reported on 9.8% of returns)
Here:
$1,492
State:
$4,659
(% of AGI for various income ranges: 0.3% for AGIs $25k-50k, 0.8% for AGIs $50k-75k, 1.1% for AGIs $75k-100k, 1.6% for AGIs $100k-200k, 2.0% for AGIs over 200k)
Taxes paid: $5,245 (reported on 13.2% of returns)
93905:
$5,245
State:
$14,448
(% of AGI for various income ranges: 0.4% for AGIs below $25k, 1.6% for AGIs $25k-50k, 4.1% for AGIs $50k-75k, 5.3% for AGIs $75k-100k, 7.0% for AGIs $100k-200k, 8.1% for AGIs over 200k)
Earned income credit: $2,719 (reported on 25.3% of returns)
Here:
$2,719
State:
$2,286
(% of AGI for various income ranges: 5.7% for AGIs below $25k, 1.7% for AGIs $25k-50k)
Percentage of individuals using paid preparers for their 2012 taxes: 83.0%
Here:
83%
State:
64%
(% for various income ranges: 82.8% for AGIs below $25k, 83.7% for AGIs $25k-50k, 85.0% for AGIs $50k-75k, 80.0% for AGIs $75k-100k, 76.0% for AGIs $100k-200k, 75.0% for AGIs over 200k)
Averages for the 2004 tax year for zip code 93905, filed in 2005:
Average Adjusted Gross Income (AGI) in 2004: $26,837 (Individual Income Tax Returns)
Here:
$26,837
State:
$58,600
Salary/wage: $25,460 (reported on 94.8% of returns)
Here:
$25,460
State:
$49,455
(% of AGI for various income ranges: 96.0% for AGIs below $10k, 88.4% for AGIs $10k-25k, 91.2% for AGIs $25k-50k, 92.6% for AGIs $50k-75k, 90.9% for AGIs $75k-100k, 80.1% for AGIs over 100k)
Taxable interest for individuals: $496 (reported on 20.7% of returns)
This zip code:
$496
California:
$2,365
(% of AGI for various income ranges: 0.8% for AGIs below $10k, 0.3% for AGIs $10k-25k, 0.3% for AGIs $25k-50k, 0.4% for AGIs $50k-75k, 0.7% for AGIs $75k-100k, 0.6% for AGIs over 100k)
Taxable dividends: $1,107 (reported on 3.1% of returns)
Here:
$1,107
State:
$4,746
(% of AGI for various income ranges: 0.3% for AGIs below $10k, 0.1% for AGIs $10k-25k, 0.1% for AGIs $25k-50k, 0.2% for AGIs $50k-75k, 0.1% for AGIs $75k-100k, 0.2% for AGIs over 100k)
Net capital gain/loss: +$6,598 (reported on 2.3% of returns)
Here:
+$6,598
State:
+$23,418
(% of AGI for various income ranges: -0.3% for AGIs below $10k, -0.1% for AGIs $10k-25k, 0.0% for AGIs $25k-50k, 0.1% for AGIs $50k-75k, 1.0% for AGIs $75k-100k, 6.7% for AGIs over 100k)
Profit/loss from business: +$7,683 (reported on 7.4% of returns)
Here:
+$7,683
State:
+$16,826
(% of AGI for various income ranges: 6.5% for AGIs below $10k, 2.4% for AGIs $10k-25k, 1.6% for AGIs $25k-50k, 1.7% for AGIs $50k-75k, 1.6% for AGIs $75k-100k, 3.1% for AGIs over 100k)
IRA payment deduction: $2,830 (reported on 0.5% of returns)
93905:
$2,830
California:
$3,192
(% of AGI for various income ranges: 0.0% for AGIs $10k-25k, 0.1% for AGIs $25k-50k, 0.1% for AGIs $50k-75k, 0.2% for AGIs $75k-100k)
Total itemized deductions: $21,356 (40% of AGI, reported on 21.1% of returns)
Here:
$21,356
State:
$28,113
Here:
40.4% of AGI
State:
25.3% of AGI
(% of AGI for various income ranges: 5.2% for AGIs below $10k, 5.5% for AGIs $10k-25k, 18.1% for AGIs $25k-50k, 26.2% for AGIs $50k-75k, 27.1% for AGIs $75k-100k, 24.2% for AGIs over 100k)
Charity contributions deductions: $1,241 (2% of AGI, reported on 16.9% of returns)
Here:
$1,241
State:
$3,923
Here:
2.2% of AGI
State:
3.3% of AGI
(% of AGI for various income ranges: 0.2% for AGIs below $10k, 0.2% for AGIs $10k-25k, 0.7% for AGIs $25k-50k, 1.2% for AGIs $50k-75k, 1.5% for AGIs $75k-100k, 2.0% for AGIs over 100k)
Total tax: $2,532 (reported on 42.0% of returns)
93905:
$2,532
State:
$10,761
(% of AGI for various income ranges: 1.9% for AGIs below $10k, 1.5% for AGIs $10k-25k, 3.1% for AGIs $25k-50k, 4.9% for AGIs $50k-75k, 7.2% for AGIs $75k-100k, 12.1% for AGIs over 100k)
Earned income credit: $2,156 (reported on 31.4% of returns)
Here:
$2,156
State:
$1,763
Percentage of individuals using paid preparers for their 2004 taxes: 82.2%
Here:
82%
State:
66%
(% for various income ranges: 76.3% for AGIs below $10k, 84.2% for AGIs $10k-25k, 83.7% for AGIs $25k-50k, 81.9% for AGIs $50k-75k, 72.9% for AGIs $75k-100k, 74.8% for AGIs over 100k)
Likely homosexual households (counted as self-reported same-sex unmarried-partner households)
Lesbian couples: 0.0% of all households
Gay men: 0.1% of all households
Household received Food Stamps/SNAP in the past 12 months: 2,356 Household did not receive Food Stamps/SNAP in the past 12 months: 11,794
Women who had a birth in the past 12 months: 689 (353 now married, 338 unmarried) Women who did not have a birth in the past 12 months: 14,966 (5,433 now married, 9,553 unmarried)
Housing units in zip code 93905 with a mortgage: 3,938 (66 second mortgage, 33 both second mortgage and home equity loan) Houses without a mortgage: 15
Median monthly owner costs for units with a mortgage: $2,137 Median monthly owner costs for units without a mortgage: $647
Residents with income below the poverty level in 2022:
This zip code:
19.4%
Whole state:
12.2%
Residents with income below 50% of the poverty level in 2022:
This zip code:
11.7%
Whole state:
6.2%
Median number of rooms in houses and condos:
Here:
5.5
State:
6.0
Median number of rooms in apartments:
Here:
4.2
State:
3.9
Notable locations in this zip code not listed on our city pages
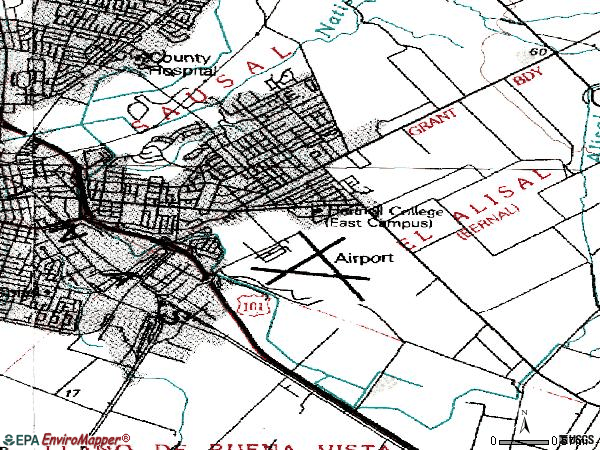
Notable locations in zip code 93905: Salinas Fairways Golf Course (A), Monterey County Public Works Center (B), Monterey County Parks and Flood Control Office (C), California Shock Trauma Air Rescue - CALSTAR 5 Air Ambulance Salinas (D), Salinas Fire Department Station 5 (E), Salinas Fire Department Station 4 (F). Display/hide their locations on the map
Parks in zip code 93905 include: Hebron Community Park (1), Loma Linda Park (2), Frank Paul Park (3), Gene Robertson Park (4), Los Padres Park (5), Closter Park (6). Display/hide their locations on the map
8,994 married couples with children.
7,124 single-parent households (1,605 men, 5,519 women).
10.4% of residents of 93905 zip code speak English at home.
88.4% of residents speak Spanish at home (43% very well, 15% well, 17% not well, 25% not at all).
0.3% of residents speak other Indo-European language at home (56% very well, 34% well, 9% not well).
1.9% of residents speak Asian or Pacific Island language at home (57% very well, 30% well, 13% not well).
0.1% of residents speak other language at home (64% not well, 36% not at all).
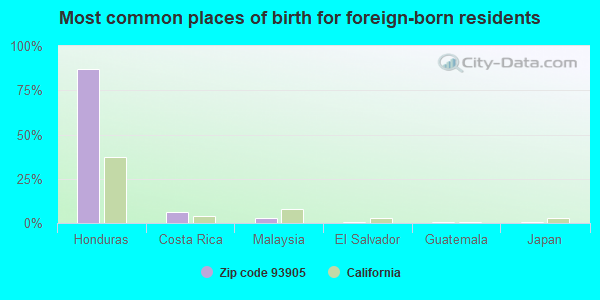
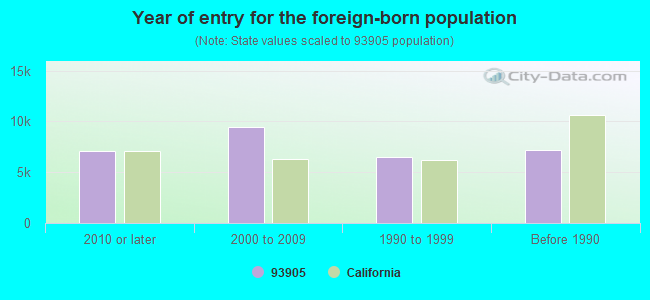
Foreign born population: 29,030 (46.4%) (17.7% of them are naturalized citizens)
Major facilities with environmental interests located in this zip code:
INTEGRATED DEVICE TECHNOLOGY INCORPORATED (1566 MOFFETT STREET in SALINAS, CA)
STATE MASTER (California - Hazardous Waste Tracking) - HAZARDOU WASTE PROGRAM CRITERIA AND HAZARDOUS AIR POLLUTANT INVENTORY (Inventory of air pollution sources) AIR MAJOR ("Best Available" air pollution technologies tracking) HAZARDOUS WASTE BIENNIAL REPORTER (Resource Conservation and Recovery Act (tracking hazardous waste)) Large Quantity Generators, more that 1000 kg of hazardous waste/month (Resource Conservation and Recovery Act (tracking hazardous waste)) TRI REPORTER (Tracking of toxic chemicals releasing facilities) Business SIC classification: SEMICONDUCTORS AND RELATED DEVICES Business NAICS classification: SEMICONDUCTOR AND RELATED DEVICE MANUFACTURING.; SEMICONDUCTOR AND RELATED DEVICE MANUFACTURING. Organizations: INTEGRATED DEVICE TECHNOLOGY, INC. (CONTACT/OPERATOR)
Alternative names: INTEGRATED DEVICE TECHNOLOGY, INC.
LAUREL CHEVRON SERVICE (650 EAST LAUREL DRIVE in SALINAS, CA)
STATE MASTER (California - Hazardous Waste Tracking) - HAZARDOU WASTE PROGRAM CRITERIA AND HAZARDOUS AIR POLLUTANT INVENTORY (Inventory of air pollution sources) Small Quantity Generators, between 100 kg and 1000 kg of hazardous waste/month (Resource Conservation and Recovery Act (tracking hazardous waste)) - notification Business SIC classification: GASOLINE SERVICE STATIONS Organizations: CHEVRON PRODUCTS CO (CONTACT/OWNER)
Alternative names: CHEVRON PRODUCTS COMPANY, CHEVRON STATION NO 93969
ALISAL HIGH SCHOOL (777 WILLIAMS RD. in SALINAS, CA)
(Geographic Names Information System) (National Center for Education Statistics) - STATE ID-2730109 Organizations: SALINAS UNION HIGH (SCHOOL DISTRICT)
ALISAL COMMUNITY (ELEM) (1437 DEL MONTE AVE. in SALINAS, CA)
(National Center for Education Statistics) - STATE ID-6025977 Organizations: ALISAL UNION ELEMENTARY (SCHOOL DISTRICT)
EL SAUSAL MIDDLE (1155 E. ALISAL ST. in SALINAS, CA)
(National Center for Education Statistics) - STATE ID-6058762 Organizations: SALINAS UNION HIGH (SCHOOL DISTRICT)
FRANK PAUL ELEMENTARY (1300 RIDER AVE. in SALINAS, CA)
(National Center for Education Statistics) - STATE ID-6101802 Organizations: ALISAL UNION ELEMENTARY (SCHOOL DISTRICT)
FREMONT ELEMENTARY (1255 E. MARKET ST. in SALINAS, CA)
(National Center for Education Statistics) - STATE ID-6025993 Organizations: ALISAL UNION ELEMENTARY (SCHOOL DISTRICT)
LA PAZ MIDDLE (1300 N. SANBORN RD. in SALINAS, CA)
(National Center for Education Statistics) - STATE ID-6118129 Organizations: SALINAS UNION HIGH (SCHOOL DISTRICT)
LOS PADRES ELEMENTARY (1130 JOHN ST. in SALINAS, CA)
(National Center for Education Statistics) - STATE ID-6026561 Organizations: SALINAS CITY ELEMENTARY (SCHOOL DISTRICT)
LOYA (OSCAR F.) ELEMENTARY (1505 COUGAR DR. in SALINAS, CA)
(National Center for Education Statistics) - STATE ID-6117691 Organizations: ALISAL UNION ELEMENTARY (SCHOOL DISTRICT)
CHAVEZ (CESAR) ELEMENTARY (1225 TOWT ST. in SALINAS, CA)
(National Center for Education Statistics) - STATE ID-6113542 Organizations: ALISAL UNION ELEMENTARY (SCHOOL DISTRICT)
BARDIN ELEMENTARY (425 BARDIN ROAD in SALINAS, CA)
(National Center for Education Statistics) - STATE ID-6025985 Organizations: ALISAL UNION ELEMENTARY (SCHOOL DISTRICT)
ALISAL AUTO PAINTING (518 E ALISAL ST in SALINAS, CA)
Small Quantity Generators, between 100 kg and 1000 kg of hazardous waste/month (Resource Conservation and Recovery Act (tracking hazardous waste)) - notification Business NAICS classification: AUTOMOTIVE BODY, PAINT, AND INTERIOR REPAIR AND MAINTENANCE. Organizations: PEDRO QUINONES (CONTACT/OWNER)
Housing units lacking complete plumbing facilities: 0.1% Housing units lacking complete kitchen facilities: 0.3%
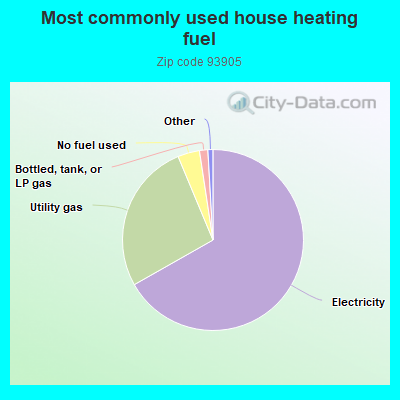
66.8%Electricity
26.9%Utility gas
3.9%No fuel used
1.5%Bottled, tank, or LP gas
Population in 1990: 41,956. Population change in the 1990s: +16,581 (+39.5%).
Place of birth for U.S.-born residents:
This state: 31,309
Northeast: 179
Midwest: 232
South: 674
West: 474
54% of the 93905 zip code residents lived in the same house 5 years ago. Out of people who lived in different houses, 81% lived in this county. Out of people who lived in different counties, 50% lived in California.
96% of the 93905 zip code residents lived in the same house 1 year ago. Out of people who lived in different houses, 72% moved from this county. Out of people who lived in different houses, 18% moved from different county within same state. Out of people who lived in different houses, 7% moved from different state. Out of people who lived in different houses, 10% moved from abroad.
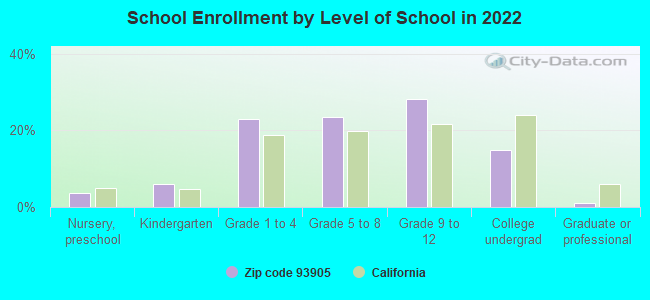
Private vs. public school enrollment:
Students in private schools in grades 1 to 8 (elementary and middle school): 143
Here:
1.5%
California:
10.5%
Students in private schools in grades 9 to 12 (high school): 121
Here:
2.1%
California:
8.5%
Students in private undergraduate colleges: 266
Here:
8.9%
California:
15.9%
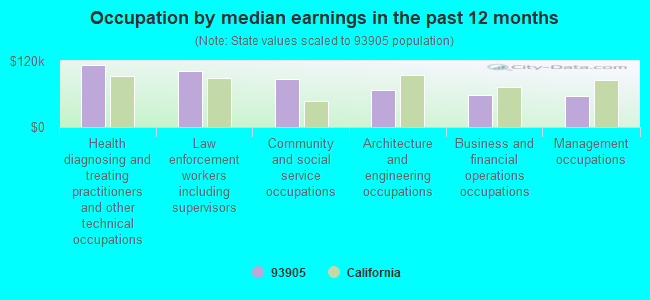
Occupation by median earnings in the past 12 months ($)
112,920Health diagnosing and treating practitioners and other technical occupations
101,245Law enforcement workers including supervisors
87,644Community and social service occupations
66,476Architecture and engineering occupations
57,705Business and financial operations occupations
56,608Management occupations
Companies with federal contracts located in this zip code:
A V C SATELLITE T V LP (443 EAST ALISAL STREET, SU in SALINAS, CA; small business) : $1,685,255 in 13 contractsfrom 2002 to 2005
Contracts for Audio/Visual Services, Video Recording and Reproducing Equipment by Army Signed by year:2000: $0; 2001: $0; 2002: $74,166; 2003: $853,682; 2004: $626,471; 2005: $130,936; 2006: $0.
Biggest contracts:
$518,503 with Army for Audio/Visual Services. Signed on 2004-11-05. Effective on 2004-10-01. Completion date: 2005-01-01.
$514,436, same as above.Signed on 2003-11-20. Completion date: 2004-09-30.
$294,498, same as above.Signed on 2003-04-01. Completion date: 2003-09-30.
$93,423, same as above.Signed on 2005-04-13. Effective on 2005-04-06. Completion date: 2005-01-01.
PAPE' MATERIAL HANDLING INC (500 JOHN ST in SALINAS, CA; small business)
$9,049 with Navy for Tractors, Wheeled. Signed on 2005-01-18. Completion date: 2005-02-14.
BAY AREA METROLOGY & ENGINEERI (1233 E LAUREL DR in SALINAS, CA; small business)
$7,156 with Navy for Miscellaneous Items. Taking place in FL. Signed on 2005-03-04. Completion date: 2005-03-23.
Top industries in this zip code by the number of employees in 2005:
2005 - 2018 National Fire Incident Reporting System (NFIRS) incidents
Based on the data from the years 2005 - 2018 the average number of fires per year is 40. The highest number of fire incidents - 152 took place in 2005, and the least - 0 in 2009. The data has a declining trend.
When looking into fire subcategories, the most reports belonged to: Outside Fires (52.8%), and Structure Fires (25.8%).
Fire incident types reported to NFIRS in Zip Code 93905
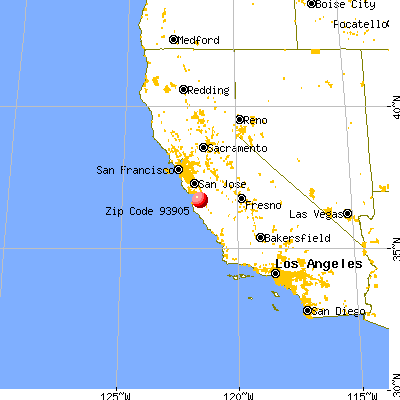


 Nearest zip codes: 93908, 93906, 93901, 93962, 93907, 95045.


 Based on the data from the years 2005 - 2018 the average number of fires per year is 40. The highest number of fire incidents - 152 took place in 2005, and the least - 0 in 2009. The data has a declining trend.
 When looking into fire subcategories, the most reports belonged to: Outside Fires (52.8%), and Structure Fires (25.8%).