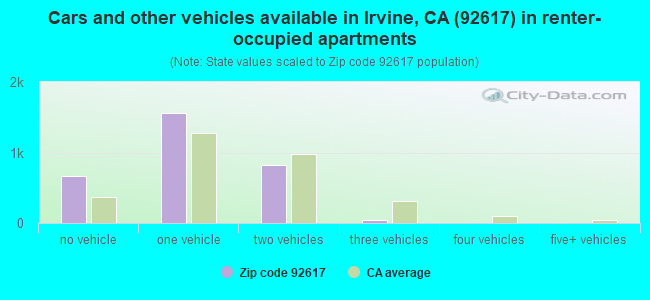
Houses and condos: 4,904 Renter-occupied apartments: 3,087
% of renters here:
70%
State:
44%
March 2022 cost of living index in zip code 92617: 77.6 (low, U.S. average is 100)
Land area: 2.4 sq. mi. Water area: 0.0 sq. mi.
Population density: 8,428 people per square mile
(high).
OSM Map
Google Map
MSN Map
OSM Map
General Map
Google Map
MSN Map
OSM Map
Google Map
MSN Map
OSM Map
Google Map
MSN Map
Please wait while loading the map...
Real estate property taxes paid for housing units in 2022:
This zip code:
0.8% ($6,353)
California:
0.7% ($4,831)
Median real estate property taxes paid for housing units with mortgages in 2022: $7,030 (0.8%) Median real estate property taxes paid for housing units with no mortgage in 2022: $5,376 (0.9%)
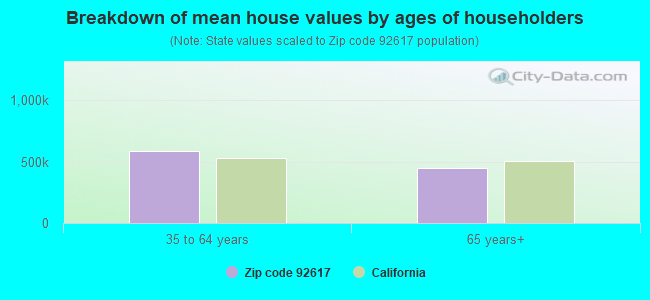
Estimated median house/condo value in 2022: $751,299
92617:
$751,299
California:
$715,900
Median resident age:
This zip code:
21.2 years
California median age:
37.9 years
Average household size:
This zip code:
2.6 people
California:
2.8 people
Averages for the 2020 tax year for zip code 92617, filed in 2021:
Average Adjusted Gross Income (AGI) in 2020: $116,188 (Individual Income Tax Returns)
Here:
$116,188
State:
$95,910
Salary/wage: $98,377 (reported on 92.1% of returns)
Here:
$98,377
State:
$77,331
(% of AGI for various income ranges: 1406.8% for AGIs below $25k, 4340.7% for AGIs $25k-50k, 7196.4% for AGIs $50k-75k, 11050.0% for AGIs $75k-100k, 19827.0% for AGIs $100k-200k, 67487.8% for AGIs over 200k)
Taxable interest for individuals: $1,292 (reported on 45.1% of returns)
This zip code:
$1,292
California:
$2,294
(% of AGI for various income ranges: 5.7% for AGIs below $25k, 16.4% for AGIs $25k-50k, 26.8% for AGIs $50k-75k, 46.9% for AGIs $75k-100k, 128.2% for AGIs $100k-200k, 500.0% for AGIs over 200k)
Ordinary dividends: $7,201 (reported on 35.6% of returns)
Here:
$7,201
State:
$10,949
(% of AGI for various income ranges: 18.0% for AGIs below $25k, 47.5% for AGIs $25k-50k, 78.0% for AGIs $50k-75k, 106.9% for AGIs $75k-100k, 347.0% for AGIs $100k-200k, 2689.6% for AGIs over 200k)
Net capital gain/loss in AGI: +$16,630 (reported on 34.0% of returns)
Here:
+$16,630
State:
+$49,306
(% of AGI for various income ranges: 28.7% for AGIs below $25k, 63.7% for AGIs $25k-50k, 149.2% for AGIs $50k-75k, 158.8% for AGIs $75k-100k, 354.8% for AGIs $100k-200k, 6721.1% for AGIs over 200k)
Profit/loss from business: +$10,780 (reported on 19.3% of returns)
Here:
+$10,780
State:
+$15,671
(% of AGI for various income ranges: 42.2% for AGIs below $25k, 58.1% for AGIs $25k-50k, 126.8% for AGIs $50k-75k, 90.6% for AGIs $75k-100k, 367.8% for AGIs $100k-200k, 1873.0% for AGIs over 200k)
Taxable individual retirement arrangement distribution: $31,285 (reported on 5.4% of returns)
92617:
$31,285
California:
$23,505
(% of AGI for various income ranges: 67.8% for AGIs $25k-50k, 317.8% for AGIs $100k-200k, 1698.5% for AGIs over 200k)
Self-employed (Keogh) retirement plans: $16,075 (reported on 1.1% of returns)
92617:
$16,075
California:
$30,163
(% of AGI for various income ranges: 238.1% for AGIs over 200k)
Total itemized deductions: $35,702 (reported on 12.8% of returns)
Here:
$35,702
State:
$39,517
(% of AGI for various income ranges: 45.0% for AGIs below $25k, 443.1% for AGIs $75k-100k, 1198.2% for AGIs $100k-200k, 4050.4% for AGIs over 200k)
Charity contributions: $13,942 (reported on 10.9% of returns)
Here:
$13,942
State:
$12,598
(% of AGI for various income ranges: 37.5% for AGIs $75k-100k, 254.0% for AGIs $100k-200k, 1667.0% for AGIs over 200k)
Taxes paid: $9,400 (reported on 12.8% of returns)
92617:
$9,400
State:
$8,807
(% of AGI for various income ranges: 191.2% for AGIs $75k-100k, 391.2% for AGIs $100k-200k, 943.3% for AGIs over 200k)
Earned income credit: $1,045 (reported on 6.0% of returns)
Here:
$1,045
State:
$2,074
(% of AGI for various income ranges: 21.6% for AGIs below $25k, 11.2% for AGIs $25k-50k)
Percentage of individuals using paid preparers for their 2020 taxes: 93.2%
Here:
93%
State:
92%
(% for various income ranges: 93.6% for AGIs below $25k, 93.8% for AGIs $25k-50k, 91.2% for AGIs $50k-75k, 91.3% for AGIs $75k-100k, 92.4% for AGIs $100k-200k, 94.3% for AGIs over 200k)
Averages for the 2012 tax year for zip code 92617, filed in 2013:
Average Adjusted Gross Income (AGI) in 2012: $82,934 (Individual Income Tax Returns)
Here:
$82,934
State:
$72,726
Salary/wage: $71,492 (reported on 94.1% of returns)
Here:
$71,492
State:
$59,079
(% of AGI for various income ranges: 96.8% for AGIs below $25k, 94.5% for AGIs $25k-50k, 92.7% for AGIs $50k-75k, 87.8% for AGIs $75k-100k, 86.3% for AGIs $100k-200k, 69.9% for AGIs over 200k)
Taxable interest for individuals: $1,202 (reported on 46.0% of returns)
This zip code:
$1,202
California:
$2,146
(% of AGI for various income ranges: 0.3% for AGIs below $25k, 0.2% for AGIs $25k-50k, 0.7% for AGIs $50k-75k, 0.4% for AGIs $75k-100k, 0.5% for AGIs $100k-200k, 0.9% for AGIs over 200k)
Ordinary dividends: $6,493 (reported on 29.4% of returns)
Here:
$6,493
State:
$9,308
(% of AGI for various income ranges: 1.3% for AGIs below $25k, 0.6% for AGIs $25k-50k, 0.9% for AGIs $50k-75k, 1.3% for AGIs $75k-100k, 1.3% for AGIs $100k-200k, 3.8% for AGIs over 200k)
Net capital gain/loss in AGI: +$7,081 (reported on 23.9% of returns)
Here:
+$7,081
State:
+$30,460
(% of AGI for various income ranges: 0.1% for AGIs $50k-75k, 0.6% for AGIs $75k-100k, 0.7% for AGIs $100k-200k, 4.3% for AGIs over 200k)
Profit/loss from business: +$11,662 (reported on 21.1% of returns)
Here:
+$11,662
State:
+$17,064
(% of AGI for various income ranges: 2.6% for AGIs below $25k, 1.5% for AGIs $25k-50k, 1.0% for AGIs $50k-75k, 1.2% for AGIs $75k-100k, 2.1% for AGIs $100k-200k, 4.6% for AGIs over 200k)
Taxable individual retirement arrangement distribution: $25,950 (reported on 4.8% of returns)
92617:
$25,950
California:
$19,557
(% of AGI for various income ranges: 0.5% for AGIs below $25k, 1.4% for AGIs $50k-75k, 0.8% for AGIs $100k-200k, 2.7% for AGIs over 200k)
Self-employment retirement plans: $16,700 (reported on 1.7% of returns)
92617:
$16,700
California:
$24,530
(% of AGI for various income ranges: 0.8% for AGIs $25k-50k, 0.7% for AGIs over 200k)
Total itemized deductions: $33,891 (18% of AGI, reported on 34.3% of returns)
Here:
$33,891
State:
$34,004
Here:
18.3% of AGI
State:
22.7% of AGI
(% of AGI for various income ranges: 2.3% for AGIs below $25k, 3.3% for AGIs $25k-50k, 7.5% for AGIs $50k-75k, 12.6% for AGIs $75k-100k, 16.1% for AGIs $100k-200k, 17.3% for AGIs over 200k)
Charity contributions: $6,185 (reported on 29.1% of returns)
Here:
$6,185
State:
$4,659
(% of AGI for various income ranges: 0.3% for AGIs $25k-50k, 0.7% for AGIs $50k-75k, 1.2% for AGIs $75k-100k, 1.9% for AGIs $100k-200k, 3.4% for AGIs over 200k)
Taxes paid: $16,671 (reported on 34.3% of returns)
92617:
$16,671
State:
$14,448
(% of AGI for various income ranges: 0.3% for AGIs below $25k, 0.6% for AGIs $25k-50k, 2.3% for AGIs $50k-75k, 5.2% for AGIs $75k-100k, 7.7% for AGIs $100k-200k, 9.4% for AGIs over 200k)
Earned income credit: $1,162 (reported on 8.3% of returns)
Here:
$1,162
State:
$2,286
(% of AGI for various income ranges: 1.7% for AGIs below $25k, 0.3% for AGIs $25k-50k)
Percentage of individuals using paid preparers for their 2012 taxes: 34.6%
Here:
35%
State:
64%
(% for various income ranges: 26.9% for AGIs below $25k, 22.2% for AGIs $25k-50k, 36.0% for AGIs $50k-75k, 40.9% for AGIs $75k-100k, 46.0% for AGIs $100k-200k, 60.0% for AGIs over 200k)
Averages for the 2004 tax year for zip code 92617, filed in 2005:
Average Adjusted Gross Income (AGI) in 2004: $48,281 (Individual Income Tax Returns)
Here:
$48,281
State:
$58,600
Salary/wage: $44,878 (reported on 92.1% of returns)
Here:
$44,878
State:
$49,455
(% of AGI for various income ranges: 128.3% for AGIs below $10k, 97.0% for AGIs $10k-25k, 95.6% for AGIs $25k-50k, 94.1% for AGIs $50k-75k, 92.6% for AGIs $75k-100k, 77.2% for AGIs over 100k)
Taxable interest for individuals: $1,042 (reported on 45.5% of returns)
This zip code:
$1,042
California:
$2,365
(% of AGI for various income ranges: 1.5% for AGIs below $10k, 0.5% for AGIs $10k-25k, 0.4% for AGIs $25k-50k, 1.1% for AGIs $50k-75k, 0.5% for AGIs $75k-100k, 1.2% for AGIs over 100k)
Taxable dividends: $2,277 (reported on 25.3% of returns)
Here:
$2,277
State:
$4,746
(% of AGI for various income ranges: 2.7% for AGIs below $10k, 0.5% for AGIs $10k-25k, 0.5% for AGIs $25k-50k, 1.0% for AGIs $50k-75k, 0.7% for AGIs $75k-100k, 1.5% for AGIs over 100k)
Net capital gain/loss: +$9,843 (reported on 19.4% of returns)
Here:
+$9,843
State:
+$23,418
(% of AGI for various income ranges: -2.7% for AGIs below $10k, 0.5% for AGIs $10k-25k, 0.1% for AGIs $25k-50k, -0.6% for AGIs $50k-75k, -0.1% for AGIs $75k-100k, 7.1% for AGIs over 100k)
Profit/loss from business: +$10,899 (reported on 14.1% of returns)
Here:
+$10,899
State:
+$16,826
(% of AGI for various income ranges: 0.6% for AGIs below $10k, 0.7% for AGIs $10k-25k, 0.8% for AGIs $25k-50k, 3.0% for AGIs $50k-75k, 1.0% for AGIs $75k-100k, 4.6% for AGIs over 100k)
IRA payment deduction: $2,591 (reported on 1.7% of returns)
92617:
$2,591
California:
$3,192
Self-employed pension: $15,577 (reported on 1.0% of returns)
Here:
$15,577
California:
$17,688
Total itemized deductions: $16,201 (18% of AGI, reported on 37.9% of returns)
Here:
$16,201
State:
$28,113
Here:
17.9% of AGI
State:
25.3% of AGI
(% of AGI for various income ranges: 9.8% for AGIs below $10k, 3.6% for AGIs $10k-25k, 5.5% for AGIs $25k-50k, 11.5% for AGIs $50k-75k, 14.9% for AGIs $75k-100k, 15.5% for AGIs over 100k)
Charity contributions deductions: $3,288 (2% of AGI, reported on 22.0% of returns)
Here:
$3,288
State:
$3,923
Here:
2.4% of AGI
State:
3.3% of AGI
(% of AGI for various income ranges: 0.3% for AGIs below $10k, 0.2% for AGIs $10k-25k, 0.6% for AGIs $25k-50k, 1.0% for AGIs $50k-75k, 1.4% for AGIs $75k-100k, 2.0% for AGIs over 100k)
Total tax: $9,015 (reported on 73.4% of returns)
92617:
$9,015
State:
$10,761
(% of AGI for various income ranges: 2.5% for AGIs below $10k, 5.4% for AGIs $10k-25k, 7.4% for AGIs $25k-50k, 10.0% for AGIs $50k-75k, 11.6% for AGIs $75k-100k, 17.9% for AGIs over 100k)
Earned income credit: $1,000 (reported on 6.6% of returns)
Here:
$1,000
State:
$1,763
Percentage of individuals using paid preparers for their 2004 taxes: 24.9%
Here:
25%
State:
66%
(% for various income ranges: 15.0% for AGIs below $10k, 15.9% for AGIs $10k-25k, 24.8% for AGIs $25k-50k, 33.0% for AGIs $50k-75k, 32.3% for AGIs $75k-100k, 55.3% for AGIs over 100k)
Likely homosexual households (counted as self-reported same-sex unmarried-partner households)
Lesbian couples: 0.7% of all households
Gay men: 0.0% of all households
Household received Food Stamps/SNAP in the past 12 months: 371 Household did not receive Food Stamps/SNAP in the past 12 months: 4,022
Women who had a birth in the past 12 months: 14 (14 now married, 0 unmarried) Women who did not have a birth in the past 12 months: 9,552 (1,140 now married, 8,522 unmarried)
Housing units in zip code 92617 with a mortgage: 836 (54 second mortgage, 30 both second mortgage and home equity loan) Median monthly owner costs for units with a mortgage: $2,959 Median monthly owner costs for units without a mortgage: $751
Residents with income below the poverty level in 2022:
This zip code:
29.9%
Whole state:
12.2%
Residents with income below 50% of the poverty level in 2022:
This zip code:
3.6%
Whole state:
6.2%
Median number of rooms in houses and condos:
Here:
6.4
State:
6.0
Median number of rooms in apartments:
Here:
3.7
State:
3.9
Notable locations in this zip code not listed on our city pages
1,553 married couples with children.
307 single-parent households (18 men, 289 women).
47.5% of residents of 92617 zip code speak English at home.
14.0% of residents speak Spanish at home (95% very well, 4% well, 1% not well).
9.2% of residents speak other Indo-European language at home (91% very well, 9% well).
27.4% of residents speak Asian or Pacific Island language at home (70% very well, 25% well, 5% not well).
1.4% of residents speak other language at home (68% very well, 24% well, 7% not well, 1% not at all).
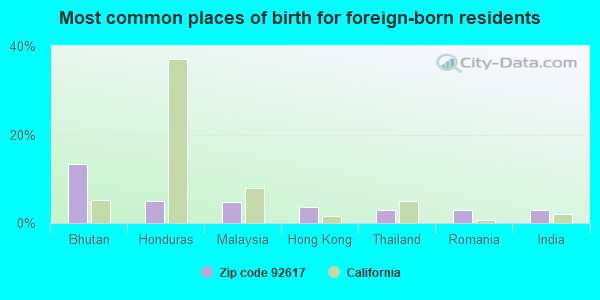
Foreign born population: 5,758 (28.4%) (30.8% of them are naturalized citizens)
This zip code:
28.4%
Whole state:
26.7%
13%Bhutan
5%Honduras
5%Malaysia
4%Hong Kong
3%Thailand
3%Romania
3%India
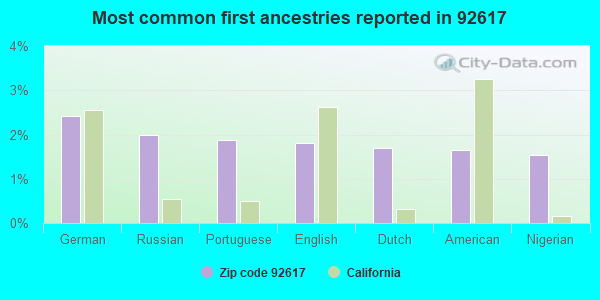
2%German
2%Russian
2%Portuguese
2%English
2%Dutch
2%American
2%Nigerian
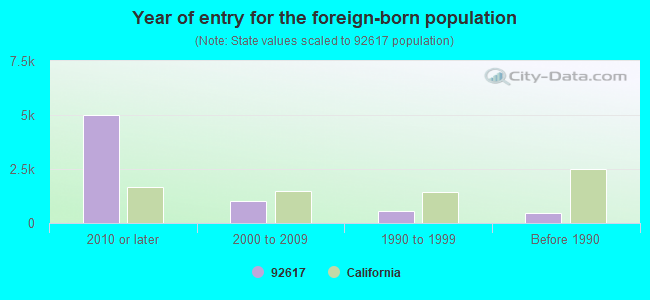
Year of entry for the foreign-born population
5,0142010 or later
1,0112000 to 2009
5571990 to 1999
475Before 1990
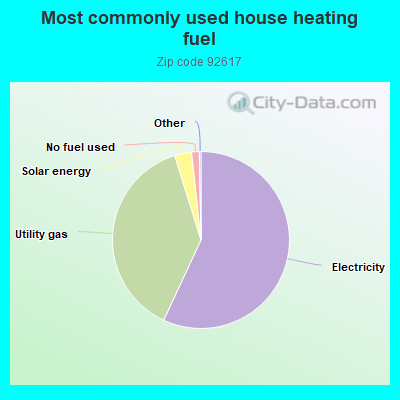
Housing units lacking complete kitchen facilities: 0.3%
57.0%Electricity
38.3%Utility gas
3.1%Solar energy
1.4%No fuel used
Place of birth for U.S.-born residents:
This state: 10,951
Northeast: 733
Midwest: 924
South: 562
West: 687
80% of the 92617 zip code residents lived in the same house 1 year ago. Out of people who lived in different houses, 41% moved from this county. Out of people who lived in different houses, 20% moved from different county within same state. Out of people who lived in different houses, 20% moved from different state. Out of people who lived in different houses, 20% moved from abroad.
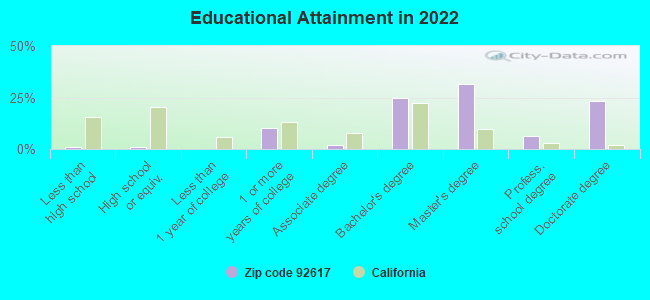
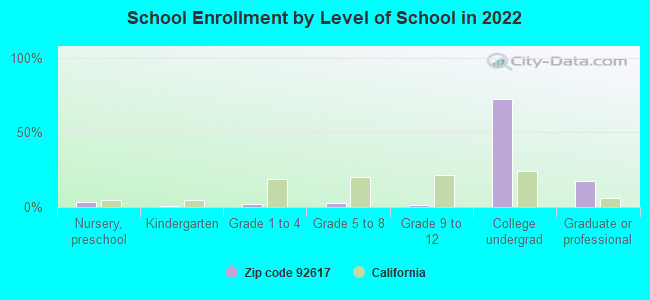
Private vs. public school enrollment:
Students in private schools in grades 1 to 8 (elementary and middle school): 183
Here:
26.4%
California:
10.5%
Students in private schools in grades 9 to 12 (high school):
Here:
0.0%
California:
8.5%
Students in private undergraduate colleges: 704
Here:
6.6%
California:
15.9%
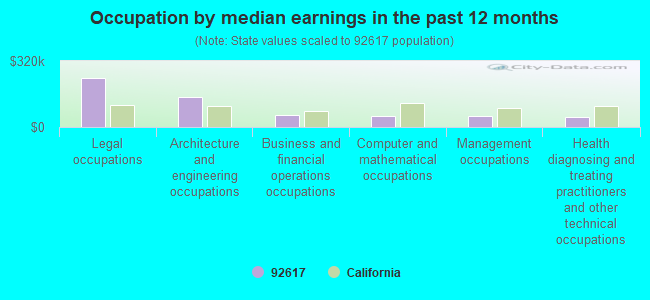
Occupation by median earnings in the past 12 months ($)
237,352Legal occupations
143,410Architecture and engineering occupations
56,469Business and financial operations occupations
53,406Computer and mathematical occupations
53,211Management occupations
50,360Health diagnosing and treating practitioners and other technical occupations
Companies with federal contracts located in this zip code:
27 TECHNOLOGY DRIVE LLC (111 INNOVATION DDRIVE in IRVINE, CA; small business) : $0 in 8 contractsin 2006
Contracts for Lease or Rental of Facilities -- Office Buildings by Public Buildings Service Signed by year:2000: $0; 2001: $0; 2002: $0; 2003: $0; 2004: $0; 2005: $0; 2006: $0.
Biggest contracts:
$0 with Public Buildings Service for Lease or Rental of Facilities -- Office Buildings. Signed on 2006-04-01. Completion date: 2006-09-30.
$0, same as above.Signed on 2006-04-01. Completion date: 2006-09-30.
$0, same as above.Signed on 2006-01-01. Completion date: 2006-09-30.
$0, same as above.Signed on 2006-04-01. Completion date: 2006-09-30.
Top industries in this zip code by the number of employees in 2005:
Real Estate and Rental and Leasing: Residential Property Managers (500-999 employees: 1 establishment, 100-249 employees: 1 establishment)
Management of Companies and Enterprises: Corporate, Subsidiary, and Regional Managing Offices (50-99: 1)
Arts, Entertainment, and Recreation: Fitness and Recreational Sports Centers (20-49: 1)
Health Care and Social Assistance: Medical Laboratories (20-49: 1)
Other Services (except Public Administration): Voluntary Health Organizations (20-49: 1)
Wholesale Trade: Stationery and Office Supplies Merchant Wholesalers (5-9: 1)
Professional, Scientific, and Technical Services: Research and Development in the Physical, Engineering, and Life Sciences (1-4: 2)


 : $0 in 8 contracts in 2006