Estimated zip code population in 2022: 720 Zip code population in 2010: 618 Zip code population in 2000: 360
March 2022 cost of living index in zip code 88339: 84.3 (less than average, U.S. average is 100)
Land area: 449.4 sq. mi. Water area: 0.3 sq. mi.
Population density: 2 people per square mile
(very low).
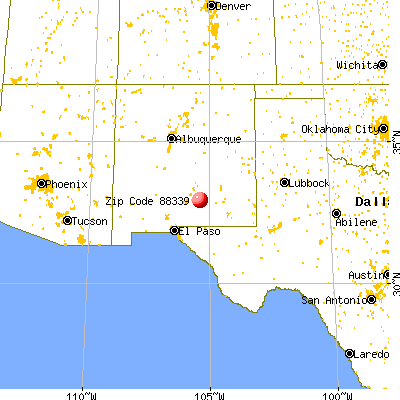
OSM Map
General Map
Google Map
MSN Map
OSM Map
General Map
Google Map
MSN Map
OSM Map
General Map
Google Map
MSN Map
OSM Map
General Map
Google Map
MSN Map
Please wait while loading the map...
Real estate property taxes paid for housing units in 2022:
This zip code:
0.3% ($997)
New Mexico:
0.7% ($1,638)
Median real estate property taxes paid for housing units with mortgages in 2022: $724 (0.4%) Median real estate property taxes paid for housing units with no mortgage in 2022: $1,224 (0.9%)
Business Search- 14 Million verified businesses
Males: 450
(62.7%)
Females: 268
(37.3%)
For population 25 years and over in 88339:
High school or higher: 99.7%
Bachelor's degree or higher: 24.8%
Graduate or professional degree: 6.3%
Mean travel time to work (commute): 42.1 minutes
For population 15 years and over in 88339:
Never married: 19.0%
Now married: 61.7%
Separated: 0.0%
Widowed: 0.6%
Divorced: 18.7%
Zip code 88339 compared to state average:
Unemployed percentage significantly below state average.
Black race population percentage significantly below state average.
Hispanic race population percentage significantly below state average.
Median age significantly above state average.
Foreign-born population percentage significantly below state average.
Renting percentage significantly below state average.
Length of stay since moving in significantly above state average.
Number of college students significantly below state average.
Estimated median house/condo value in 2022: $313,441
88339:
$313,441
New Mexico:
$243,100
Median resident age:
This zip code:
62.2 years
New Mexico median age:
39.4 years
Average household size:
This zip code:
2.7 people
New Mexico:
2.4 people
Averages for the 2020 tax year for zip code 88339, filed in 2021:
Average Adjusted Gross Income (AGI) in 2020: $62,813 (Individual Income Tax Returns)
Here:
$62,813
State:
$59,146
Salary/wage: $44,761 (reported on 58.1% of returns)
Here:
$44,761
State:
$48,327
(% of AGI for various income ranges: 888.6% for AGIs below $25k, 2655.0% for AGIs $25k-50k, 4533.3% for AGIs $50k-75k, 8780.0% for AGIs $75k-100k, 10856.7% for AGIs $100k-200k)
Taxable interest for individuals: $1,317 (reported on 38.7% of returns)
This zip code:
$1,317
New Mexico:
$1,616
(% of AGI for various income ranges: 32.9% for AGIs below $25k, 143.3% for AGIs $50k-75k, 306.7% for AGIs $100k-200k)
Ordinary dividends: $2,133 (reported on 19.4% of returns)
Here:
$2,133
State:
$7,816
(% of AGI for various income ranges: 40.0% for AGIs below $25k, 143.3% for AGIs $50k-75k, 190.0% for AGIs $100k-200k)
Net capital gain/loss in AGI: +$6,900 (reported on 19.4% of returns)
Here:
+$6,900
State:
+$19,595
(% of AGI for various income ranges: 282.5% for AGIs $25k-50k, 1003.3% for AGIs $100k-200k)
Profit/loss from business: +$2,150 (reported on 19.4% of returns)
Here:
+$2,150
State:
+$11,430
(% of AGI for various income ranges: 247.1% for AGIs below $25k)
Taxable individual retirement arrangement distribution: $24,120 (reported on 16.1% of returns)
88339:
$24,120
New Mexico:
$20,970
(% of AGI for various income ranges: 537.1% for AGIs below $25k, 4150.0% for AGIs $75k-100k)
Earned income credit: $2,275 (reported on 12.9% of returns)
Here:
$2,275
State:
$2,323
(% of AGI for various income ranges: 130.0% for AGIs below $25k)
Percentage of individuals using paid preparers for their 2020 taxes: 83.9%
Here:
84%
State:
92%
(% for various income ranges: 90.0% for AGIs below $25k, 83.3% for AGIs $25k-50k, 80.0% for AGIs $50k-75k, 75.0% for AGIs $75k-100k, 83.3% for AGIs $100k-200k)
Averages for the 2012 tax year for zip code 88339, filed in 2013:
Average Adjusted Gross Income (AGI) in 2012: $59,768 (Individual Income Tax Returns)
Here:
$59,768
State:
$50,343
Salary/wage: $38,856 (reported on 64.0% of returns)
Here:
$38,856
State:
$41,171
(% of AGI for various income ranges: 66.4% for AGIs below $25k, 48.1% for AGIs $25k-50k, 97.1% for AGIs $50k-75k, 31.3% for AGIs $100k-200k)
Taxable interest for individuals: $1,667 (reported on 48.0% of returns)
This zip code:
$1,667
New Mexico:
$1,677
(% of AGI for various income ranges: 0.6% for AGIs below $25k, 2.2% for AGIs $25k-50k, 1.9% for AGIs $75k-100k, 1.4% for AGIs $100k-200k)
Ordinary dividends: $2,760 (reported on 20.0% of returns)
Here:
$2,760
State:
$6,939
Net capital gain/loss in AGI: +$12,880 (reported on 20.0% of returns)
Here:
+$12,880
State:
+$14,311
Profit/loss from business: +$4,683 (reported on 24.0% of returns)
Here:
+$4,683
State:
+$11,059
Taxable individual retirement arrangement distribution: $16,150 (reported on 16.0% of returns)
88339:
$16,150
New Mexico:
$15,706
Total itemized deductions: $21,988 (23% of AGI, reported on 32.0% of returns)
Here:
$21,988
State:
$21,709
Here:
22.7% of AGI
State:
19.8% of AGI
(% of AGI for various income ranges: 29.2% for AGIs below $25k, 22.4% for AGIs $50k-75k, 12.8% for AGIs $100k-200k)
Charity contributions: $6,000 (reported on 20.0% of returns)
Here:
$6,000
State:
$4,195
(% of AGI for various income ranges: 5.6% for AGIs $25k-50k, 2.4% for AGIs $100k-200k)
Taxes paid: $4,575 (reported on 32.0% of returns)
88339:
$4,575
State:
$6,176
(% of AGI for various income ranges: 3.2% for AGIs below $25k, 3.8% for AGIs $50k-75k, 3.4% for AGIs $100k-200k)
Earned income credit: $2,633 (reported on 12.0% of returns)
Here:
$2,633
State:
$2,311
(% of AGI for various income ranges: 6.8% for AGIs below $25k)
Percentage of individuals using paid preparers for their 2012 taxes: 52.0%
Here:
52%
State:
50%
(% for various income ranges: 33.3% for AGIs below $25k, 66.7% for AGIs $25k-50k, 100.0% for AGIs $50k-75k, 75.0% for AGIs $100k-200k)
Averages for the 2004 tax year for zip code 88339, filed in 2005:
Average Adjusted Gross Income (AGI) in 2004: $38,293 (Individual Income Tax Returns)
Here:
$38,293
State:
$39,572
Salary/wage: $29,899 (reported on 64.6% of returns)
Here:
$29,899
State:
$34,237
(% of AGI for various income ranges: 59.6% for AGIs $10k-25k, 49.9% for AGIs $25k-50k, 72.8% for AGIs $50k-75k, 47.9% for AGIs over 100k)
Taxable interest for individuals: $1,577 (reported on 56.8% of returns)
This zip code:
$1,577
New Mexico:
$1,873
(% of AGI for various income ranges: 1.9% for AGIs $10k-25k, 4.9% for AGIs $25k-50k, 1.1% for AGIs $50k-75k, 2.0% for AGIs $75k-100k, 1.0% for AGIs over 100k)
Taxable dividends: $1,931 (reported on 25.3% of returns)
Here:
$1,931
State:
$3,554
Net capital gain/loss: +$604 (reported on 23.1% of returns)
Here:
+$604
State:
+$10,425
Profit/loss from business: +$1,585 (reported on 17.9% of returns)
Here:
+$1,585
State:
+$8,875
Total itemized deductions: $16,069 (20% of AGI, reported on 25.3% of returns)
Here:
$16,069
State:
$18,103
Here:
19.9% of AGI
State:
21.5% of AGI
Charity contributions deductions: $4,833 (6% of AGI, reported on 21.0% of returns)
Here:
$4,833
State:
$3,246
Here:
5.7% of AGI
State:
3.6% of AGI
Total tax: $5,243 (reported on 75.5% of returns)
88339:
$5,243
State:
$6,237
(% of AGI for various income ranges: 3.9% for AGIs $10k-25k, 7.5% for AGIs $25k-50k, 8.8% for AGIs $50k-75k, 10.9% for AGIs $75k-100k, 16.3% for AGIs over 100k)
Earned income credit: $1,636 (reported on 14.4% of returns)
Here:
$1,636
State:
$1,796
Percentage of individuals using paid preparers for their 2004 taxes: 61.1%
Here:
61%
State:
57%
(% for various income ranges: 58.3% for AGIs below $10k, 63.1% for AGIs $10k-25k, 63.8% for AGIs $25k-50k, 63.0% for AGIs $50k-75k, 121.4% for AGIs $75k-100k)
Household received Food Stamps/SNAP in the past 12 months: 12 Household did not receive Food Stamps/SNAP in the past 12 months: 250
Women who did not have a birth in the past 12 months: 36 (11 now married, 24 unmarried)
Housing units in zip code 88339 with a mortgage: 98 Median monthly owner costs for units with a mortgage: $1,192 Median monthly owner costs for units without a mortgage: $544
Residents with income below the poverty level in 2022:
This zip code:
16.1%
Whole state:
17.6%
Residents with income below 50% of the poverty level in 2022:
This zip code:
15.6%
Whole state:
9.7%
Median number of rooms in houses and condos:
Here:
6.3
State:
5.9
Notable locations in this zip code not listed on our city pages
Notable locations in zip code 88339: McCarty Well (A), North Pasture Windmill (B), Pendergrass Well (C), R Vandewart Ranch (D), Salt House (E), Taylor Well (F), Teel Canyon Well (G), Teel Well (H), West Singer Windmill (I), Willow Well (J), Church Camp (K), Funk (L), Mayhill Administration Site (M), Bear Canyon Lake Point of Interest (N), Calentine Well (O), Cauhape Ranch (P), Mayhill Administrative Site (Q), James Canyon Campground (R), Jernigan Ranch (S), Clements Ranch (T). Display/hide their locations on the map
Lakes and reservoirs: Boat Lake (A), Cantwell Lake (B), Allen Lake (C), Hale Lake (D), Hackberry Lake (E), Wilson Lake (F), Gowen Lake (G), Barkley Lake (H). Display/hide their locations on the map
In group quarters: 6 (-1 institutionalized population)
Size of family households: 177 2-persons, 11 3-persons, 26 4-persons
Size of nonfamily households: 53 1-person
103.2% of residents of 88339 zip code speak English at home.
1.2% of residents speak Spanish at home (100% very well).
Foreign born population: 8 (1.2%) (100.0% of them are naturalized citizens)
This zip code:
1.2%
Whole state:
9.3%
89%Sweden
89%United Kingdom, excluding England and Scotland
25%German
20%English
19%Norwegian
10%American
8%European
8%Irish
4%Hungarian
Year of entry for the foreign-born population
02010 or later
02000 to 2009
01990 to 1999
8Before 1990
Facilities with environmental interests located in this zip code:
BARN DOOR (JAMES CANYON RT in MAYHILL, NM)
(Integrated Compliance Information System) - ICIS-06-1996-0047, FORMAL ENFORCEMENT ACTION Business SIC classification: EATING PLACES
CLOUD COUNTRY ESTATES WATER SYS (#1 CLOUD COUNTRY DR in MAYHILL, NM)
(Integrated Compliance Information System) - ICIS-06-1997-0025, FORMAL ENFORCEMENT ACTION Business SIC classification: WATER SUPPLY
Housing units lacking complete plumbing facilities: 3.4% Housing units lacking complete kitchen facilities: 3.0%
55.3%Bottled, tank, or LP gas
26.1%Utility gas
9.5%Wood
4.3%Solar energy
3.6%Electricity
2.0%Other fuel
Population in 1990: 237. Population change in the 1990s: +123 (+51.9%).
Place of birth for U.S.-born residents:
This state: 274
Northeast: 31
Midwest: 44
South: 175
West: 189
53% of the 88339 zip code residents lived in the same house 5 years ago. Out of people who lived in different houses, 44% lived in this county. Out of people who lived in different counties, 50% lived in New Mexico.
99% of the 88339 zip code residents lived in the same house 1 year ago. Out of people who lived in different houses, 20% moved from different county within same state. Out of people who lived in different houses, 110% moved from different state.
Private vs. public school enrollment:
Students in private schools in grades 1 to 8 (elementary and middle school):
Here:
0.0%
New Mexico:
10.2%
Students in private undergraduate colleges:
Here:
0.0%
New Mexico:
12.3%
Companies with federal contracts located in this zip code:
MAYHILL WATER SUPPLY INC (3530 HGWY 82 in MAYHILL, NM; small business) : $107,750 in 2 contractsin 2001
$54,000 with Forest Service (disused code: now 12C2) for Tree Thinning Services. Signed on 2001-09-15. Completion date: 2001-09-15.
$53,750 with Forest Service for Tree Thinning Services. Signed on 2001-09-15. Completion date: 2001-09-15.
Top industries in this zip code by the number of employees in 2005:
Accommodation and Food Services: Limited-Service Restaurants (5-9 employees: 1 establishment)
Other Services (except Public Administration): Religious Organizations (1-4: 3)
Arts, Entertainment, and Recreation: All Other Amusement and Recreation Industries (1-4: 1)
Construction: New Single-Family Housing Construction (except Operative Builders) (1-4: 1)
Accommodation and Food Services: Full-Service Restaurants (1-4: 1)
Construction: Residential Remodelers (1-4: 1)
Accommodation and Food Services: Recreational and Vacation Camps (except Campgrounds) (1-4: 1)
Other Services (except Public Administration): Other Similar Organizations (except Business, Professional, Labor, and Political Organizations) (1-4: 1)
5 people in workers' group living quarters and job corps centers
Fatal accident statistics in 2013:
Fatal accident count: 1
Vehicles involved in fatal accidents: 2
Fatal accidents caused by drunken drivers: 0
Fatalities: 1
Persons involved in fatal accidents: 5
Pedestrians involved in fatal accidents: 0
Fatal accident statistics in 2011:
Fatal accident count: 1
Vehicles involved in fatal accidents: 2
Fatal accidents caused by drunken drivers: 0
Fatalities: 1
Persons involved in fatal accidents: 3
Pedestrians involved in fatal accidents: 0
2006 - 2018 National Fire Incident Reporting System (NFIRS) incidents
Based on the data from the years 2006 - 2018 the average number of fires per year is 14. The highest number of fire incidents - 38 took place in 2011, and the least - 4 in 2006. The data has a growing trend.
When looking into fire subcategories, the most incidents belonged to: Outside Fires (70.4%), and Structure Fires (17.7%).
Fire incident types reported to NFIRS in Zip Code 88339


 Nearest zip codes: 88354, 88343, 88317, 88250, 88344, 88336.


 Based on the data from the years 2006 - 2018 the average number of fires per year is 14. The highest number of fire incidents - 38 took place in 2011, and the least - 4 in 2006. The data has a growing trend.
 When looking into fire subcategories, the most incidents belonged to: Outside Fires (70.4%), and Structure Fires (17.7%).