Estimated zip code population in 2022: 10,034 Zip code population in 2010: 700 Zip code population in 2000: 1,476
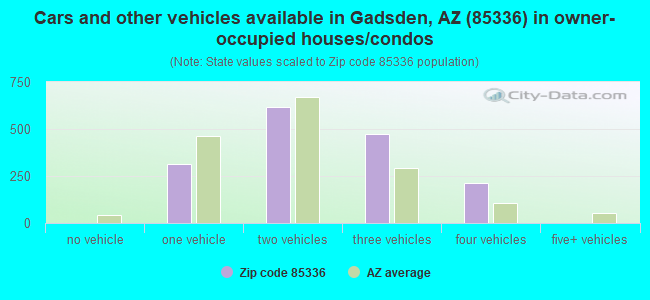
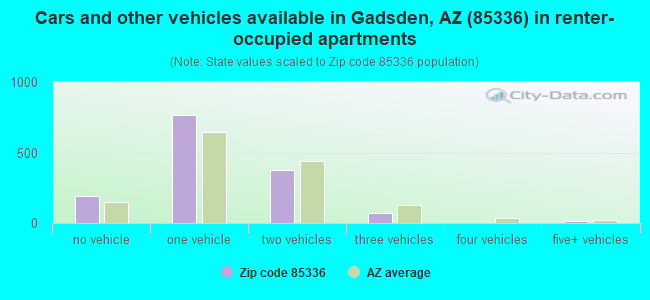
Houses and condos: 3,115 Renter-occupied apartments: 1,428
% of renters here:
47%
State:
33%
March 2022 cost of living index in zip code 85336: 86.2 (less than average, U.S. average is 100)
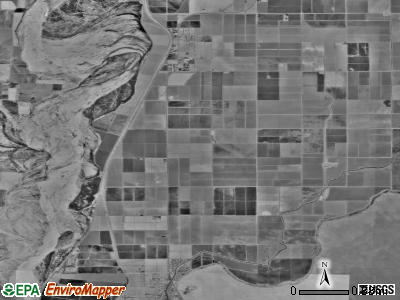
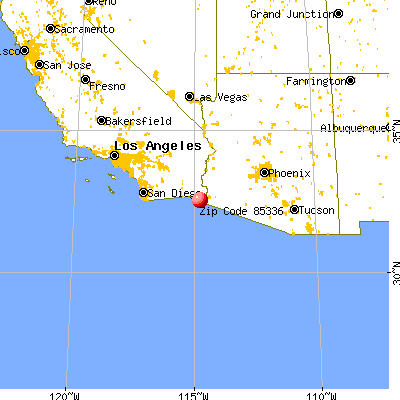
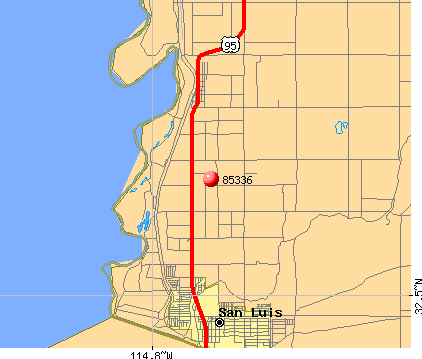
Land area: 3.8 sq. mi. Water area: 0.0 sq. mi.
Population density: 2,614 people per square mile
(average).
OSM Map
General Map
Google Map
MSN Map
OSM Map
General Map
Google Map
MSN Map
OSM Map
General Map
Google Map
MSN Map
OSM Map
General Map
Google Map
MSN Map
Please wait while loading the map...
Real estate property taxes paid for housing units in 2022:
This zip code:
0.6% ($1,312)
Arizona:
0.4% ($1,786)
Median real estate property taxes paid for housing units with mortgages in 2022: $1,375 (0.6%) Median real estate property taxes paid for housing units with no mortgage in 2022: $964 (0.6%)
Business Search- 14 Million verified businesses
Males: 4,577
(45.6%)
Females: 5,457
(54.4%)
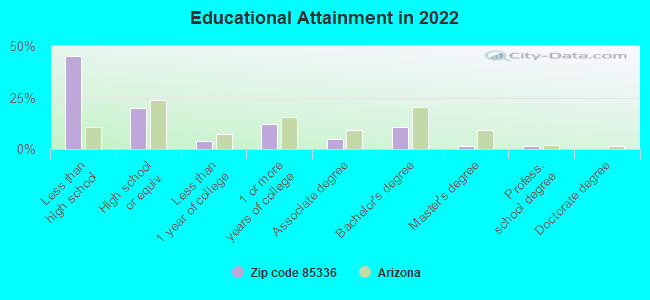
For population 25 years and over in 85336:
High school or higher: 52.5%
Bachelor's degree or higher: 13.3%
Graduate or professional degree: 2.8%
Unemployed: 8.3%
Mean travel time to work (commute): 28.8 minutes
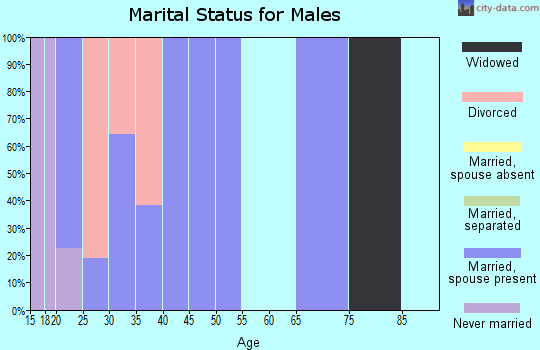
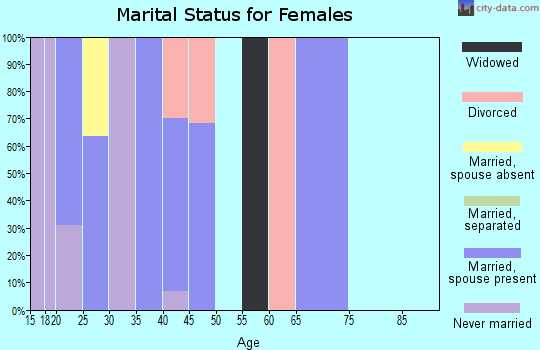
For population 15 years and over in 85336:
Never married: 35.1%
Now married: 51.0%
Separated: 4.1%
Widowed: 4.4%
Divorced: 5.4%
Zip code 85336 compared to state average:
Median household income below state average.
Median house value below state average.
Unemployed percentage above state average.
Black race population percentage significantly below state average.
Hispanic race population percentage significantly above state average.
Median age significantly below state average.
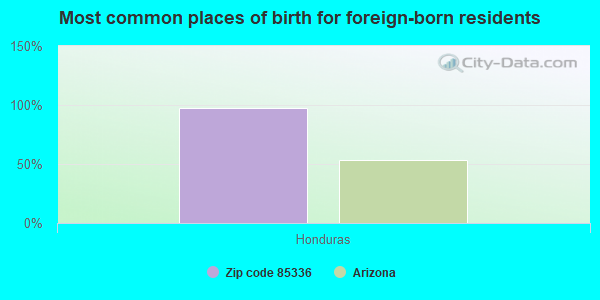
Foreign-born population percentage significantly above state average.
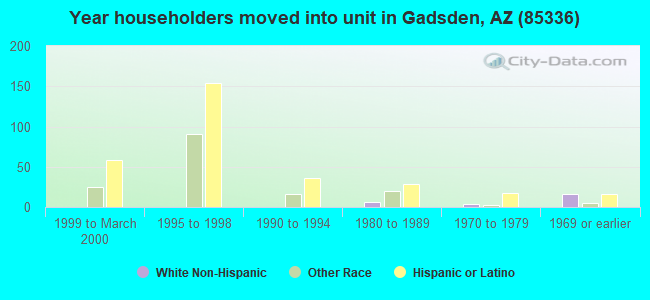
Length of stay since moving in significantly above state average.
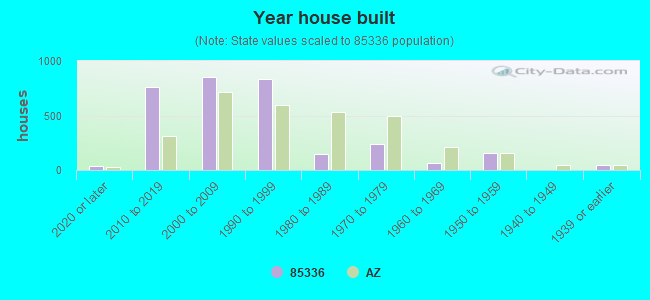
House age below state average.
Percentage of population with a bachelor's degree or higher significantly below state average.
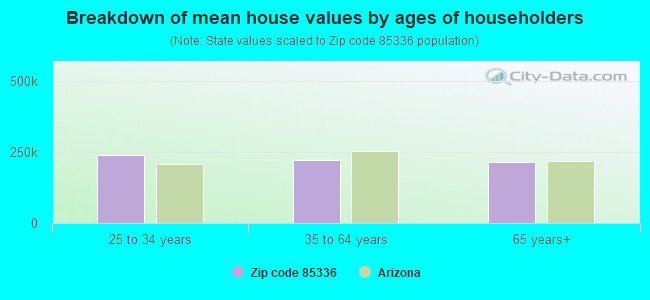
Estimated median house/condo value in 2022: $230,225
85336:
$230,225
Arizona:
$402,800
According to our research of Arizona and other state lists, there was 1 registered sex offender living in 85336 zip code as of July 16, 2024. The ratio of all residents to sex offenders in zip code 85336 is 566 to 1. The ratio of registered sex offenders to all residents in this zip code is near the state average.
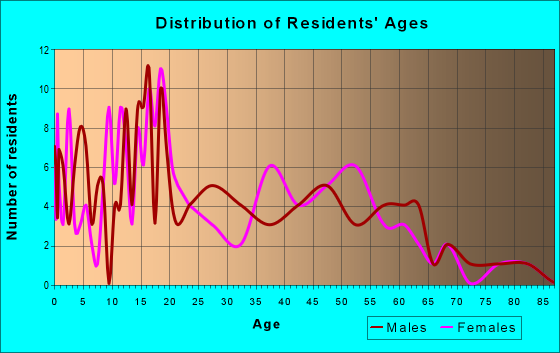
Median resident age:
This zip code:
28.5 years
Arizona median age:
38.8 years
Average household size:
This zip code:
3.3 people
Arizona:
2.5 people
Averages for the 2004 tax year for zip code 85336, filed in 2005:
Average Adjusted Gross Income (AGI) in 2004: $21,600 (Individual Income Tax Returns)
Here:
$21,600
State:
$50,097
Salary/wage: $20,203 (reported on 94.7% of returns)
Here:
$20,203
State:
$42,146
(% of AGI for various income ranges: 79.8% for AGIs below $10k, 90.9% for AGIs $10k-25k, 90.8% for AGIs $25k-50k, 82.2% for AGIs $50k-75k)
Taxable interest for individuals: $103 (reported on 10.4% of returns)
This zip code:
$103
Arizona:
$2,374
Profit/loss from business: +$3,455 (reported on 5.9% of returns)
Here:
+$3,455
State:
+$11,088
Total itemized deductions: $11,368 (23% of AGI, reported on 5.1% of returns)
Here:
$11,368
State:
$19,781
Here:
22.9% of AGI
State:
21.8% of AGI
Charity contributions deductions: $1,071 (2% of AGI, reported on 3.7% of returns)
Here:
$1,071
State:
$3,389
Here:
2.0% of AGI
State:
3.5% of AGI
Total tax: $1,836 (reported on 40.5% of returns)
85336:
$1,836
State:
$8,323
(% of AGI for various income ranges: 1.3% for AGIs below $10k, 1.2% for AGIs $10k-25k, 3.4% for AGIs $25k-50k, 8.6% for AGIs $50k-75k)
Earned income credit: $2,162 (reported on 49.3% of returns)
Here:
$2,162
State:
$1,786
Percentage of individuals using paid preparers for their 2004 taxes: 64.8%
Here:
65%
State:
60%
(% for various income ranges: 61.6% for AGIs below $10k, 65.3% for AGIs $10k-25k, 66.3% for AGIs $25k-50k, 66.7% for AGIs $50k-75k)
Household received Food Stamps/SNAP in the past 12 months: 1,231 Household did not receive Food Stamps/SNAP in the past 12 months: 1,868
Women who had a birth in the past 12 months: 272 (251 now married, 26 unmarried) Women who did not have a birth in the past 12 months: 2,362 (899 now married, 1,465 unmarried)
Housing units in zip code 85336 with a mortgage: 1,153 Median monthly owner costs for units with a mortgage: $1,043 Median monthly owner costs for units without a mortgage: $361
Residents with income below the poverty level in 2022:
This zip code:
27.6%
Whole state:
12.5%
Residents with income below 50% of the poverty level in 2022:
This zip code:
7.0%
Whole state:
6.0%
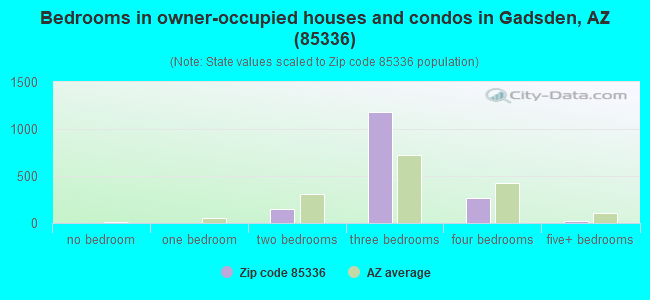
Median number of rooms in houses and condos:
Here:
5.0
State:
6.0
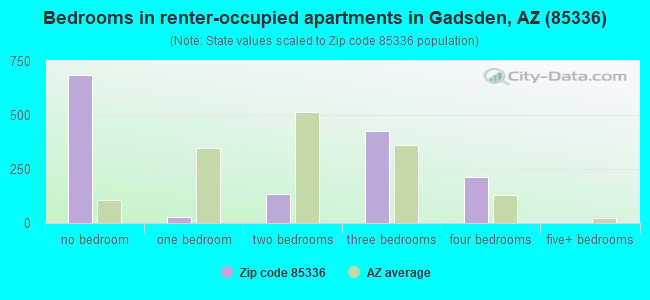
Median number of rooms in apartments:
Here:
3.0
State:
4.1
Notable locations in this zip code not listed on our city pages
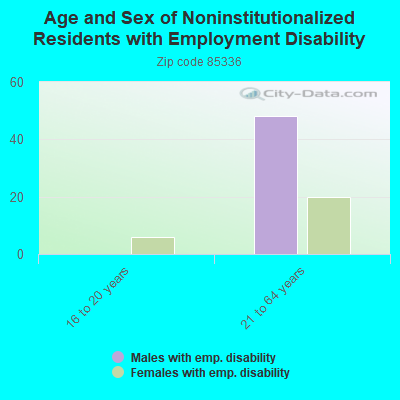
In group quarters: 2 (-1 institutionalized population)
Size of family households: 769 2-persons, 394 3-persons, 835 4-persons, 461 5-persons, 128 6-persons, 38 7-or-more-persons
Size of nonfamily households: 288 1-person, 83 2-persons, 45 6-persons
698 married couples with children.
1,906 single-parent households (235 men, 1,671 women).
1.7% of residents of 85336 zip code speak English at home.
100.6% of residents speak Spanish at home (50% very well, 4% well, 13% not well, 33% not at all).
Foreign born population: 4,886 (48.7%) (46.4% of them are naturalized citizens)
This zip code:
48.7%
Whole state:
13.1%
98%Honduras
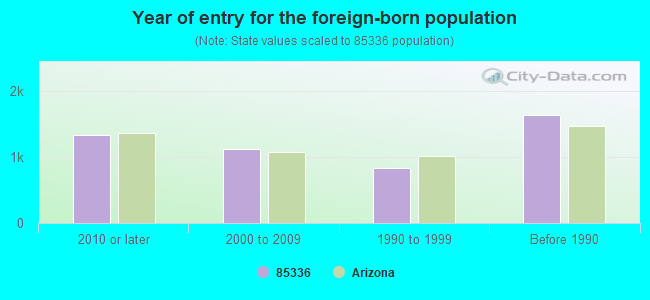
Year of entry for the foreign-born population
1,3322010 or later
1,1292000 to 2009
8331990 to 1999
1,642Before 1990
Facilities with environmental interests located in this zip code:
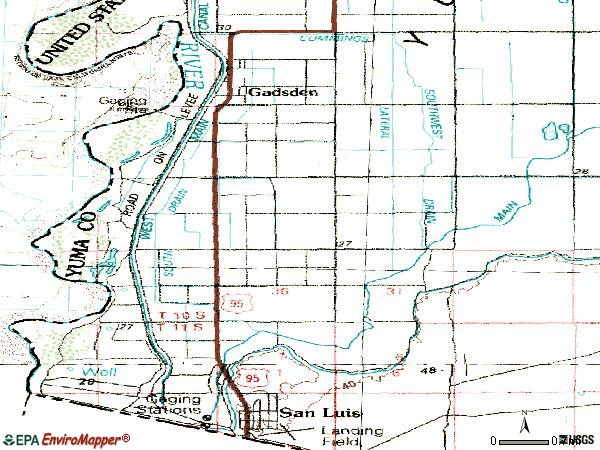
GADSDEN ELEMENTARY SCHOOL (18745 GADSDEN ST in GADSDEN, AZ)
(Geographic Names Information System) (National Center for Education Statistics) - STATE ID-101 Organizations: GADSDEN ELEMENTARY DISTRICT (SCHOOL DISTRICT)
GADSDEN ELEMENTARY SD #32 (COLLEGE ST & GADSDEN AVE in GADSDEN, AZ)
COMPLIANCE ACTIVITY (Tracking inspections of insecticide, fungicide, and rodenticide, and toxic substances) Alternative names: GADSDEN ELEMENTARY SCHOOL DISTRICT #3
Housing units lacking complete plumbing facilities: 1.8% Housing units lacking complete kitchen facilities: 1.7%
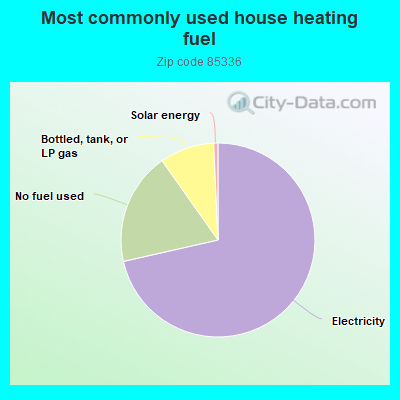
71.6%Electricity
18.8%No fuel used
9.1%Bottled, tank, or LP gas
0.7%Solar energy
Place of birth for U.S.-born residents:
This state: 4,419
South: 77
West: 628
50% of the 85336 zip code residents lived in the same house 5 years ago. Out of people who lived in different houses, 75% lived in this county. Out of people who lived in different counties, 50% lived in Arizona.
89% of the 85336 zip code residents lived in the same house 1 year ago. Out of people who lived in different houses, 75% moved from this county. Out of people who lived in different houses, 19% moved from different state. Out of people who lived in different houses, 5% moved from abroad.
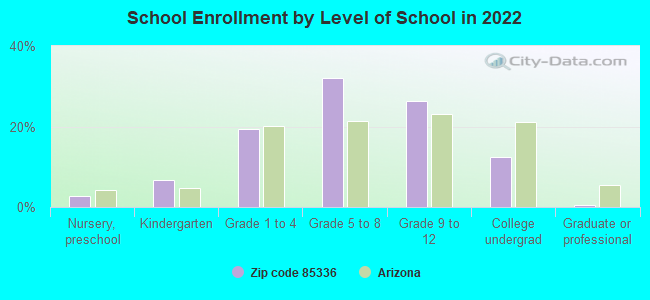
Private vs. public school enrollment:
Students in private schools in grades 1 to 8 (elementary and middle school):
Here:
0.0%
Arizona:
10.4%
Students in private schools in grades 9 to 12 (high school):
Here:
0.0%
Arizona:
8.8%
Students in private undergraduate colleges:
Here:
0.0%
Arizona:
13.1%
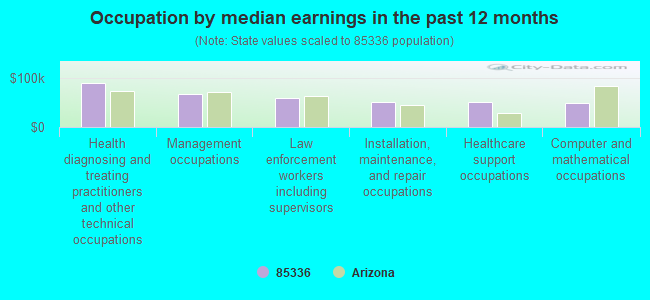
Occupation by median earnings in the past 12 months ($)
89,912Health diagnosing and treating practitioners and other technical occupations
67,048Management occupations
58,265Law enforcement workers including supervisors
51,232Installation, maintenance, and repair occupations
50,436Healthcare support occupations
48,361Computer and mathematical occupations
Top industries in this zip code by the number of employees in 2005:
Administrative and Support and Waste Management and Remediation Services: Employment Placement Agencies (10-19 employees: 1 establishment)
Accommodation and Food Services: Full-Service Restaurants (1-4: 1)
Fatal accident statistics in 2011:
Fatal accident count: 1
Vehicles involved in fatal accidents: 1
Fatal accidents caused by drunken drivers: 0
Fatalities: 1
Persons involved in fatal accidents: 1
Pedestrians involved in fatal accidents: 0
Home Mortgage Disclosure Act Aggregated Statistics For Year 2009 (Based on 2 partial tracts)
A) FHA, FSA/RHS & VA Home Purchase Loans
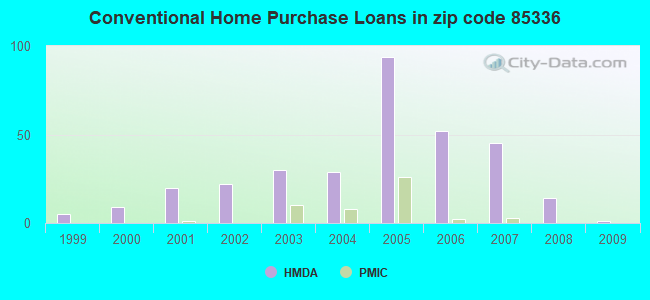
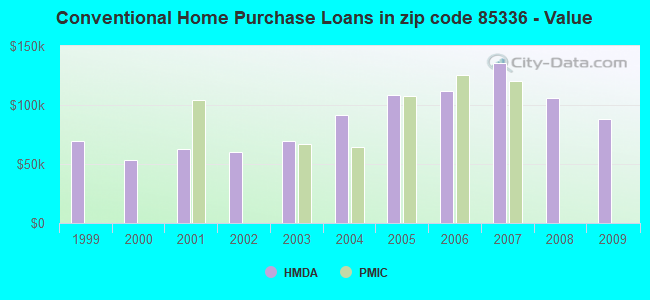
B) Conventional Home Purchase Loans
C) Refinancings
F) Non-occupant Loans on < 5 Family Dwellings (A B C & D)
Number
Average Value
Number
Average Value
Number
Average Value
Number
Average Value
LOANS ORIGINATED
6
$105,107
1
$88,270
13
$82,192
0
$0
APPLICATIONS APPROVED, NOT ACCEPTED
1
$137,050
0
$0
1
$196,280
0
$0
APPLICATIONS DENIED
9
$88,267
1
$47,620
1
$58,070
2
$52,845
APPLICATIONS WITHDRAWN
0
$0
0
$0
3
$144,787
1
$159,110
FILES CLOSED FOR INCOMPLETENESS
0
$0
0
$0
1
$103,360
0
$0
Aggregated Statistics For Year 2008 (Based on 2 partial tracts)
A) FHA, FSA/RHS & VA Home Purchase Loans
B) Conventional Home Purchase Loans
C) Refinancings
D) Home Improvement Loans
F) Non-occupant Loans on < 5 Family Dwellings (A B C & D)
G) Loans On Manufactured Home Dwelling (A B C & D)
Number
Average Value
Number
Average Value
Number
Average Value
Number
Average Value
Number
Average Value
Number
Average Value
LOANS ORIGINATED
13
$135,705
14
$106,268
21
$109,227
2
$57,490
7
$111,163
0
$0
APPLICATIONS APPROVED, NOT ACCEPTED
0
$0
0
$0
0
$0
0
$0
0
$0
0
$0
APPLICATIONS DENIED
1
$137,050
3
$177,307
19
$117,179
2
$102,205
1
$159,110
1
$68,520
APPLICATIONS WITHDRAWN
1
$125,430
1
$125,430
7
$123,606
2
$23,230
0
$0
1
$60,390
FILES CLOSED FOR INCOMPLETENESS
0
$0
0
$0
1
$106,850
0
$0
0
$0
0
$0
Aggregated Statistics For Year 2007 (Based on 2 partial tracts)
A) FHA, FSA/RHS & VA Home Purchase Loans
B) Conventional Home Purchase Loans
C) Refinancings
D) Home Improvement Loans
F) Non-occupant Loans on < 5 Family Dwellings (A B C & D)
G) Loans On Manufactured Home Dwelling (A B C & D)
Number
Average Value
Number
Average Value
Number
Average Value
Number
Average Value
Number
Average Value
Number
Average Value
LOANS ORIGINATED
22
$139,474
45
$135,935
71
$99,455
9
$79,233
6
$126,012
2
$120,205
APPLICATIONS APPROVED, NOT ACCEPTED
0
$0
3
$226,860
16
$142,852
0
$0
1
$82,460
0
$0
APPLICATIONS DENIED
2
$163,755
12
$156,305
57
$150,350
8
$132,835
12
$147,788
0
$0
APPLICATIONS WITHDRAWN
1
$197,440
7
$140,197
22
$134,511
1
$139,370
1
$139,370
0
$0
FILES CLOSED FOR INCOMPLETENESS
0
$0
0
$0
7
$193,124
0
$0
0
$0
0
$0
Aggregated Statistics For Year 2006 (Based on 2 partial tracts)
A) FHA, FSA/RHS & VA Home Purchase Loans
B) Conventional Home Purchase Loans
C) Refinancings
D) Home Improvement Loans
F) Non-occupant Loans on < 5 Family Dwellings (A B C & D)
G) Loans On Manufactured Home Dwelling (A B C & D)
Number
Average Value
Number
Average Value
Number
Average Value
Number
Average Value
Number
Average Value
Number
Average Value
LOANS ORIGINATED
13
$136,866
52
$111,740
74
$107,131
16
$59,958
17
$84,304
0
$0
APPLICATIONS APPROVED, NOT ACCEPTED
0
$0
5
$52,960
9
$104,010
0
$0
3
$65,813
0
$0
APPLICATIONS DENIED
1
$195,120
12
$142,949
42
$122,666
7
$70,016
8
$103,365
1
$63,880
APPLICATIONS WITHDRAWN
0
$0
34
$119,761
29
$105,287
0
$0
1
$125,430
1
$92,910
FILES CLOSED FOR INCOMPLETENESS
0
$0
2
$118,465
12
$188,050
1
$90,590
0
$0
1
$168,400
Aggregated Statistics For Year 2005 (Based on 2 partial tracts)
A) FHA, FSA/RHS & VA Home Purchase Loans
B) Conventional Home Purchase Loans
C) Refinancings
D) Home Improvement Loans
F) Non-occupant Loans on < 5 Family Dwellings (A B C & D)
G) Loans On Manufactured Home Dwelling (A B C & D)
Number
Average Value
Number
Average Value
Number
Average Value
Number
Average Value
Number
Average Value
Number
Average Value
LOANS ORIGINATED
7
$132,400
94
$108,480
62
$101,810
2
$71,425
22
$115,243
0
$0
APPLICATIONS APPROVED, NOT ACCEPTED
1
$109,170
13
$118,195
6
$115,560
0
$0
2
$115,560
0
$0
APPLICATIONS DENIED
0
$0
14
$100,710
46
$103,339
7
$51,433
2
$174,210
0
$0
APPLICATIONS WITHDRAWN
0
$0
17
$128,027
16
$89,791
0
$0
5
$169,100
2
$134,140
FILES CLOSED FOR INCOMPLETENESS
0
$0
0
$0
6
$133,367
0
$0
0
$0
0
$0
Aggregated Statistics For Year 2004 (Based on 2 partial tracts)
A) FHA, FSA/RHS & VA Home Purchase Loans
B) Conventional Home Purchase Loans
C) Refinancings
D) Home Improvement Loans
F) Non-occupant Loans on < 5 Family Dwellings (A B C & D)
G) Loans On Manufactured Home Dwelling (A B C & D)
Number
Average Value
Number
Average Value
Number
Average Value
Number
Average Value
Number
Average Value
Number
Average Value
LOANS ORIGINATED
7
$84,783
29
$91,150
36
$77,459
3
$55,747
9
$97,300
1
$29,040
APPLICATIONS APPROVED, NOT ACCEPTED
0
$0
8
$105,251
10
$73,052
0
$0
1
$101,040
0
$0
APPLICATIONS DENIED
2
$166,660
8
$97,992
35
$71,011
12
$4,452
3
$88,267
2
$73,170
APPLICATIONS WITHDRAWN
0
$0
2
$55,745
9
$84,653
0
$0
1
$120,790
0
$0
FILES CLOSED FOR INCOMPLETENESS
0
$0
0
$0
3
$138,207
0
$0
1
$150,980
0
$0
Aggregated Statistics For Year 2003 (Based on 2 partial tracts)
A) FHA, FSA/RHS & VA Home Purchase Loans
B) Conventional Home Purchase Loans
C) Refinancings
D) Home Improvement Loans
F) Non-occupant Loans on < 5 Family Dwellings (A B C & D)
Number
Average Value
Number
Average Value
Number
Average Value
Number
Average Value
Number
Average Value
LOANS ORIGINATED
63
$79,915
30
$69,684
101
$57,104
1
$11,610
9
$52,521
APPLICATIONS APPROVED, NOT ACCEPTED
0
$0
1
$105,690
6
$74,523
0
$0
1
$58,070
APPLICATIONS DENIED
3
$96,397
7
$73,666
28
$54,835
3
$49,167
2
$73,750
APPLICATIONS WITHDRAWN
10
$80,601
6
$79,362
31
$72,719
0
$0
2
$66,780
FILES CLOSED FOR INCOMPLETENESS
0
$0
1
$62,720
3
$83,233
0
$0
0
$0
Aggregated Statistics For Year 2002 (Based on 2 partial tracts)
A) FHA, FSA/RHS & VA Home Purchase Loans
B) Conventional Home Purchase Loans
C) Refinancings
D) Home Improvement Loans
F) Non-occupant Loans on < 5 Family Dwellings (A B C & D)
Number
Average Value
Number
Average Value
Number
Average Value
Number
Average Value
Number
Average Value
LOANS ORIGINATED
44
$78,078
22
$60,393
22
$58,228
7
$13,937
6
$46,457
APPLICATIONS APPROVED, NOT ACCEPTED
1
$68,520
2
$59,810
3
$72,780
0
$0
0
$0
APPLICATIONS DENIED
5
$74,098
14
$57,157
39
$60,482
16
$18,872
1
$78,980
APPLICATIONS WITHDRAWN
3
$84,397
15
$52,108
19
$60,087
5
$24,158
1
$18,580
FILES CLOSED FOR INCOMPLETENESS
0
$0
1
$243,890
3
$65,427
0
$0
0
$0
Aggregated Statistics For Year 2001 (Based on 2 partial tracts)
A) FHA, FSA/RHS & VA Home Purchase Loans
B) Conventional Home Purchase Loans
C) Refinancings
D) Home Improvement Loans
F) Non-occupant Loans on < 5 Family Dwellings (A B C & D)
Number
Average Value
Number
Average Value
Number
Average Value
Number
Average Value
Number
Average Value
LOANS ORIGINATED
17
$69,138
20
$62,600
28
$53,590
3
$3,870
0
$0
APPLICATIONS APPROVED, NOT ACCEPTED
0
$0
2
$72,005
7
$55,913
1
$1,160
1
$144,010
APPLICATIONS DENIED
1
$55,750
13
$80,941
26
$57,891
13
$15,992
2
$52,845
APPLICATIONS WITHDRAWN
0
$0
3
$44,133
10
$62,019
0
$0
0
$0
FILES CLOSED FOR INCOMPLETENESS
0
$0
2
$52,845
3
$46,070
0
$0
0
$0
Aggregated Statistics For Year 2000 (Based on 2 partial tracts)
A) FHA, FSA/RHS & VA Home Purchase Loans
B) Conventional Home Purchase Loans
C) Refinancings
D) Home Improvement Loans
F) Non-occupant Loans on < 5 Family Dwellings (A B C & D)
Number
Average Value
Number
Average Value
Number
Average Value
Number
Average Value
Number
Average Value
LOANS ORIGINATED
20
$65,271
9
$53,424
12
$60,490
2
$117,880
1
$75,490
APPLICATIONS APPROVED, NOT ACCEPTED
1
$97,560
3
$53,037
2
$102,205
2
$22,065
0
$0
APPLICATIONS DENIED
7
$47,949
12
$63,006
7
$54,586
8
$17,131
2
$98,720
APPLICATIONS WITHDRAWN
0
$0
1
$61,550
2
$48,780
0
$0
0
$0
FILES CLOSED FOR INCOMPLETENESS
0
$0
2
$30,775
1
$89,430
0
$0
0
$0
Aggregated Statistics For Year 1999 (Based on 1 partial tract)
A) FHA, FSA/RHS & VA Home Purchase Loans
B) Conventional Home Purchase Loans
C) Refinancings
D) Home Improvement Loans
F) Non-occupant Loans on < 5 Family Dwellings (A B C & D)


 Nearest zip codes: 85349, 85350, 85364, 92222, 92283, 85367.