Estimated zip code population in 2022: 1,156 Zip code population in 2010: 1,069 Zip code population in 2000: 907
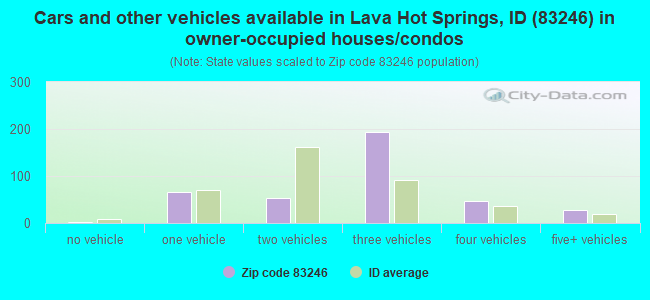
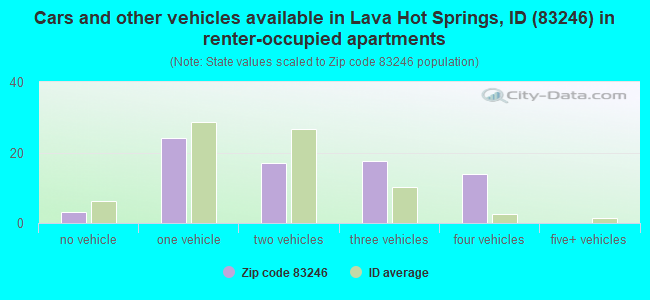
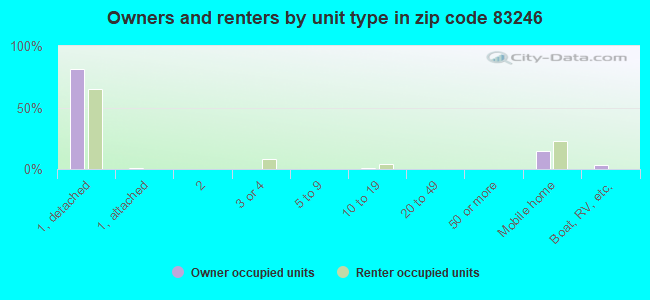
Houses and condos: 748 Renter-occupied apartments: 74
% of renters here:
16%
State:
28%
March 2022 cost of living index in zip code 83246: 87.4 (less than average, U.S. average is 100)
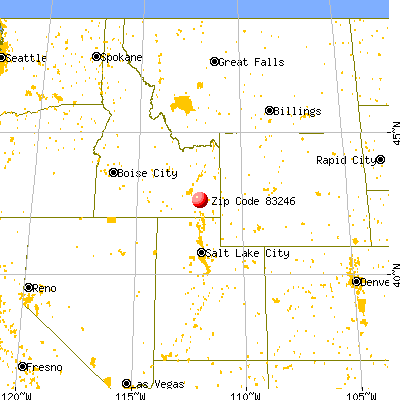
Land area: 129.6 sq. mi. Water area: 0.2 sq. mi.
Population density: 9 people per square mile
(very low).
OSM Map
General Map
Google Map
MSN Map
OSM Map
General Map
Google Map
MSN Map
OSM Map
General Map
Google Map
MSN Map
OSM Map
General Map
Google Map
MSN Map
Please wait while loading the map...
Real estate property taxes paid for housing units in 2022:
This zip code:
0.4% ($1,601)
Idaho:
0.5% ($1,995)
Median real estate property taxes paid for housing units with mortgages in 2022: $1,395 (0.5%) Median real estate property taxes paid for housing units with no mortgage in 2022: $1,997 (0.6%)
Business Search- 14 Million verified businesses
Males: 624
(54.0%)
Females: 532
(46.0%)
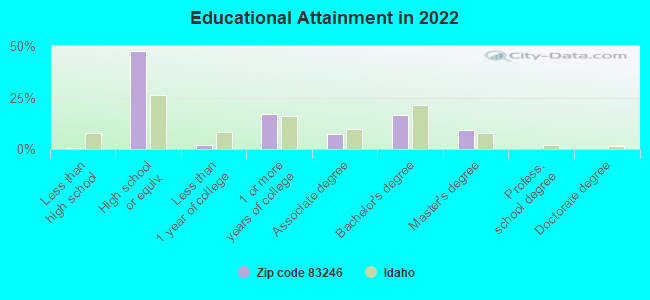
For population 25 years and over in 83246:
High school or higher: 99.3%
Bachelor's degree or higher: 25.8%
Graduate or professional degree: 9.2%
Unemployed: 4.3%
Mean travel time to work (commute): 34.9 minutes
For population 15 years and over in 83246:
Never married: 16.0%
Now married: 71.6%
Separated: 0.0%
Widowed: 3.5%
Divorced: 8.9%
Zip code 83246 compared to state average:
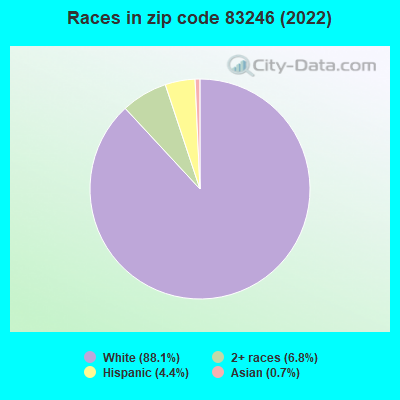
Black race population percentage significantly below state average.
Hispanic race population percentage significantly below state average.
Median age significantly above state average.
Foreign-born population percentage significantly below state average.
Renting percentage below state average.
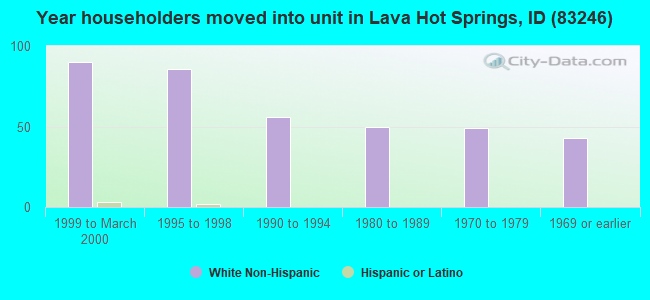
Length of stay since moving in significantly above state average.
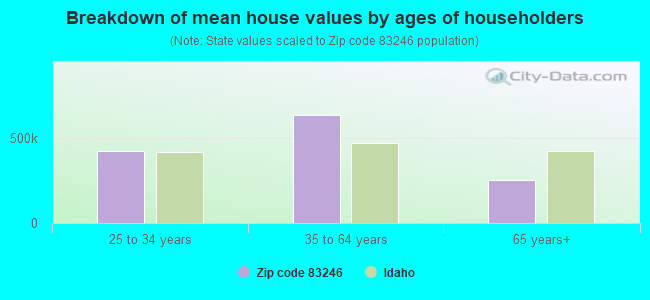
Estimated median house/condo value in 2022: $443,456
83246:
$443,456
Idaho:
$432,500
According to our research of Idaho and other state lists, there was 1 registered sex offender living in 83246 zip code as of July 03, 2024. The ratio of all residents to sex offenders in zip code 83246 is 795 to 1. The ratio of registered sex offenders to all residents in this zip code is lower than the state average.
Median resident age:
This zip code:
54.4 years
Idaho median age:
37.5 years
Average household size:
This zip code:
2.5 people
Idaho:
2.6 people
Averages for the 2020 tax year for zip code 83246, filed in 2021:
Average Adjusted Gross Income (AGI) in 2020: $60,288 (Individual Income Tax Returns)
Here:
$60,288
State:
$73,627
Salary/wage: $50,424 (reported on 75.5% of returns)
Here:
$50,424
State:
$55,245
(% of AGI for various income ranges: 1273.0% for AGIs below $25k, 3103.8% for AGIs $25k-50k, 7305.0% for AGIs $50k-75k, 10063.3% for AGIs $75k-100k, 29866.7% for AGIs $100k-200k)
Taxable interest for individuals: $688 (reported on 32.7% of returns)
This zip code:
$688
Idaho:
$2,230
(% of AGI for various income ranges: 19.0% for AGIs below $25k, 56.2% for AGIs $25k-50k, 32.5% for AGIs $50k-75k, 110.0% for AGIs $100k-200k)
Ordinary dividends: $2,829 (reported on 14.3% of returns)
Here:
$2,829
State:
$7,088
(% of AGI for various income ranges: 75.0% for AGIs $25k-50k, 460.0% for AGIs $100k-200k)
Net capital gain/loss in AGI: +$6,150 (reported on 16.3% of returns)
Here:
+$6,150
State:
+$37,284
(% of AGI for various income ranges: 176.2% for AGIs $25k-50k, 1170.0% for AGIs $100k-200k)
Profit/loss from business: +$3,130 (reported on 20.4% of returns)
Here:
+$3,130
State:
+$12,955
(% of AGI for various income ranges: 140.0% for AGIs below $25k, 193.8% for AGIs $25k-50k, 30.0% for AGIs $50k-75k, 20.0% for AGIs $100k-200k)
Taxable individual retirement arrangement distribution: $20,500 (reported on 8.2% of returns)
83246:
$20,500
Idaho:
$20,110
(% of AGI for various income ranges: 173.0% for AGIs below $25k, 1617.5% for AGIs $50k-75k)
Total itemized deductions: $28,900 (reported on 8.2% of returns)
Here:
$28,900
State:
$38,402
(% of AGI for various income ranges: 3853.3% for AGIs $75k-100k)
Charity contributions: $12,067 (reported on 6.1% of returns)
Here:
$12,067
State:
$18,314
(% of AGI for various income ranges: 905.0% for AGIs $50k-75k)
Taxes paid: $5,800 (reported on 8.2% of returns)
83246:
$5,800
State:
$7,596
(% of AGI for various income ranges: 773.3% for AGIs $100k-200k)
Earned income credit: $2,017 (reported on 12.2% of returns)
Here:
$2,017
State:
$2,195
(% of AGI for various income ranges: 79.0% for AGIs below $25k, 52.5% for AGIs $25k-50k)
Percentage of individuals using paid preparers for their 2020 taxes: 95.9%
Here:
96%
State:
94%
(% for various income ranges: 93.8% for AGIs below $25k, 92.3% for AGIs $25k-50k, 100.0% for AGIs $50k-75k, 100.0% for AGIs $75k-100k, 100.0% for AGIs $100k-200k)
Averages for the 2012 tax year for zip code 83246, filed in 2013:
Average Adjusted Gross Income (AGI) in 2012: $44,254 (Individual Income Tax Returns)
Here:
$44,254
State:
$52,536
Salary/wage: $37,719 (reported on 75.0% of returns)
Here:
$37,719
State:
$41,938
(% of AGI for various income ranges: 67.8% for AGIs below $25k, 59.6% for AGIs $25k-50k, 76.7% for AGIs $50k-75k, 66.1% for AGIs $75k-100k, 55.6% for AGIs $100k-200k)
Taxable interest for individuals: $1,046 (reported on 27.1% of returns)
This zip code:
$1,046
Idaho:
$1,874
(% of AGI for various income ranges: 0.5% for AGIs below $25k, 2.1% for AGIs $25k-50k, 0.1% for AGIs $50k-75k, 0.2% for AGIs $75k-100k, 0.5% for AGIs $100k-200k)
Ordinary dividends: $988 (reported on 16.7% of returns)
Here:
$988
State:
$5,706
Net capital gain/loss in AGI: +$2,017 (reported on 12.5% of returns)
Here:
+$2,017
State:
+$14,571
(% of AGI for various income ranges: 0.5% for AGIs $25k-50k, 3.4% for AGIs $75k-100k)
Profit/loss from business: +$3,718 (reported on 22.9% of returns)
Here:
+$3,718
State:
+$10,113
(% of AGI for various income ranges: 9.1% for AGIs below $25k, 6.0% for AGIs $25k-50k)
Taxable individual retirement arrangement distribution: $11,733 (reported on 6.2% of returns)
83246:
$11,733
Idaho:
$14,642
Total itemized deductions: $18,771 (27% of AGI, reported on 29.2% of returns)
Here:
$18,771
State:
$22,697
Here:
26.7% of AGI
State:
22.0% of AGI
(% of AGI for various income ranges: 13.2% for AGIs below $25k, 12.8% for AGIs $25k-50k, 11.6% for AGIs $50k-75k, 11.9% for AGIs $75k-100k, 12.6% for AGIs $100k-200k)
Charity contributions: $4,109 (reported on 22.9% of returns)
Here:
$4,109
State:
$5,246
(% of AGI for various income ranges: 2.6% for AGIs $25k-50k, 1.1% for AGIs $50k-75k, 2.8% for AGIs $75k-100k, 2.8% for AGIs $100k-200k)
Taxes paid: $4,764 (reported on 29.2% of returns)
83246:
$4,764
State:
$7,139
(% of AGI for various income ranges: 1.5% for AGIs below $25k, 2.0% for AGIs $25k-50k, 3.0% for AGIs $50k-75k, 3.4% for AGIs $75k-100k, 4.2% for AGIs $100k-200k)
Earned income credit: $1,912 (reported on 16.7% of returns)
Here:
$1,912
State:
$2,213
(% of AGI for various income ranges: 6.4% for AGIs below $25k)
Percentage of individuals using paid preparers for their 2012 taxes: 68.8%
Here:
69%
State:
52%
(% for various income ranges: 66.7% for AGIs below $25k, 70.0% for AGIs $25k-50k, 71.4% for AGIs $50k-75k, 80.0% for AGIs $75k-100k, 60.0% for AGIs $100k-200k)
Averages for the 2004 tax year for zip code 83246, filed in 2005:
Average Adjusted Gross Income (AGI) in 2004: $33,249 (Individual Income Tax Returns)
Here:
$33,249
State:
$42,679
Salary/wage: $30,695 (reported on 81.1% of returns)
Here:
$30,695
State:
$35,636
(% of AGI for various income ranges: 133.2% for AGIs below $10k, 67.5% for AGIs $10k-25k, 73.3% for AGIs $25k-50k, 80.7% for AGIs $50k-75k, 89.1% for AGIs $75k-100k, 50.8% for AGIs over 100k)
Taxable interest for individuals: $742 (reported on 46.7% of returns)
This zip code:
$742
Idaho:
$2,024
(% of AGI for various income ranges: 8.1% for AGIs below $10k, 1.4% for AGIs $10k-25k, 1.0% for AGIs $25k-50k, 1.1% for AGIs $50k-75k, 0.4% for AGIs $75k-100k, 0.2% for AGIs over 100k)
Taxable dividends: $1,308 (reported on 16.8% of returns)
Here:
$1,308
State:
$2,917
(% of AGI for various income ranges: 0.4% for AGIs $10k-25k, 1.5% for AGIs $25k-50k, 0.6% for AGIs $50k-75k, 0.5% for AGIs $75k-100k)
Net capital gain/loss: +$8,308 (reported on 19.6% of returns)
Here:
+$8,308
State:
+$13,146
(% of AGI for various income ranges: -6.1% for AGIs below $10k, 1.2% for AGIs $10k-25k, 0.3% for AGIs $25k-50k, 0.7% for AGIs $50k-75k, 1.3% for AGIs $75k-100k, 28.2% for AGIs over 100k)
Profit/loss from business: +$4,278 (reported on 24.7% of returns)
Here:
+$4,278
State:
+$8,765
(% of AGI for various income ranges: 1.4% for AGIs below $10k, 9.6% for AGIs $10k-25k, 6.0% for AGIs $25k-50k, 1.0% for AGIs $50k-75k)
Total itemized deductions: $15,289 (27% of AGI, reported on 32.0% of returns)
Here:
$15,289
State:
$18,385
Here:
27.4% of AGI
State:
23.1% of AGI
(% of AGI for various income ranges: 16.7% for AGIs $10k-25k, 16.4% for AGIs $25k-50k, 15.3% for AGIs $50k-75k, 13.9% for AGIs $75k-100k, 12.4% for AGIs over 100k)
Charity contributions deductions: $3,264 (6% of AGI, reported on 27.7% of returns)
Here:
$3,264
State:
$3,875
Here:
5.8% of AGI
State:
4.6% of AGI
(% of AGI for various income ranges: 1.8% for AGIs $10k-25k, 3.5% for AGIs $25k-50k, 3.2% for AGIs $50k-75k, 1.9% for AGIs $75k-100k, 2.9% for AGIs over 100k)
Total tax: $3,877 (reported on 70.1% of returns)
83246:
$3,877
State:
$6,282
(% of AGI for various income ranges: 3.1% for AGIs below $10k, 4.7% for AGIs $10k-25k, 6.4% for AGIs $25k-50k, 8.0% for AGIs $50k-75k, 9.8% for AGIs $75k-100k, 13.8% for AGIs over 100k)
Earned income credit: $1,608 (reported on 15.9% of returns)
Here:
$1,608
State:
$1,660
Percentage of individuals using paid preparers for their 2004 taxes: 72.3%
Here:
72%
State:
59%
(% for various income ranges: 68.7% for AGIs below $10k, 69.7% for AGIs $10k-25k, 79.0% for AGIs $25k-50k, 73.1% for AGIs $50k-75k, 58.6% for AGIs $75k-100k, 94.1% for AGIs over 100k)
Household received Food Stamps/SNAP in the past 12 months: 30 Household did not receive Food Stamps/SNAP in the past 12 months: 436
Women who had a birth in the past 12 months: 46 (43 now married, 0 unmarried) Women who did not have a birth in the past 12 months: 97 (37 now married, 60 unmarried)
Housing units in zip code 83246 with a mortgage: 182 Houses without a mortgage: 11
Median monthly owner costs for units with a mortgage: $1,543 Median monthly owner costs for units without a mortgage: $598
Residents with income below the poverty level in 2022:
This zip code:
6.1%
Whole state:
10.7%
Residents with income below 50% of the poverty level in 2022:
This zip code:
1.3%
Whole state:
6.1%
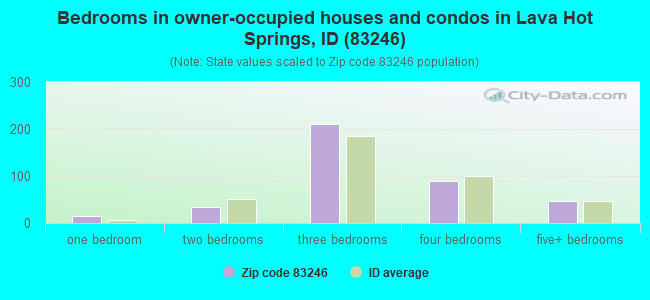
Median number of rooms in houses and condos:
Here:
7.0
State:
6.5
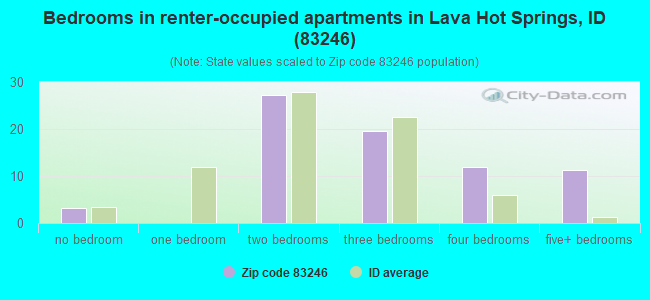
Median number of rooms in apartments:
Here:
5.2
State:
4.4
Notable locations in this zip code not listed on our city pages
Notable locations in zip code 83246: Lower Portneuf Access Area (A), Blaser Station (B), Upper Portneuf Access Area (C), Lava Hot Springs Volunteer Fire District (D). Display/hide their locations on the map
Creeks: Beaverdam Creek (A), Deer Creek (B), Dempsey Creek (C), East Creek (D), Fish Creek (E), West Bob Smith Creek (F), East Bob Smith Creek (G), Whiterock Creek (H). Display/hide their locations on the map
In group quarters: 3 (-1 institutionalized population)
Size of family households: 251 2-persons, 64 3-persons, 14 4-persons, 19 5-persons, 17 7-or-more-persons
Size of nonfamily households: 86 1-person, 9 2-persons
8 married couples with children.
47 single-parent households (4 men, 43 women).
96.9% of residents of 83246 zip code speak English at home.
2.1% of residents speak Spanish at home (100% very well).
1.4% of residents speak Asian or Pacific Island language at home (33% very well, 67% not well).
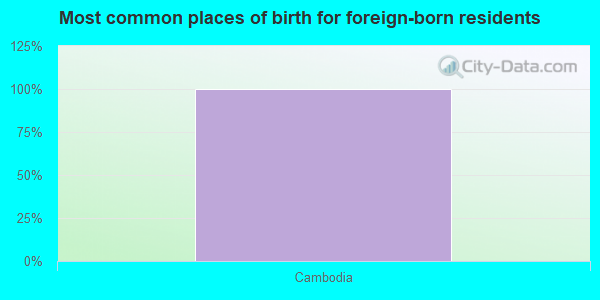
Foreign born population: 8 (0.7%) (0.0% of them are naturalized citizens)
:
0.7%
Whole state:
6.0%
100%Cambodia
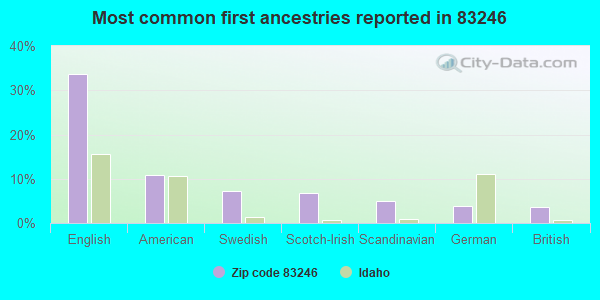
34%English
11%American
7%Swedish
7%Scotch-Irish
5%Scandinavian
4%German
4%British
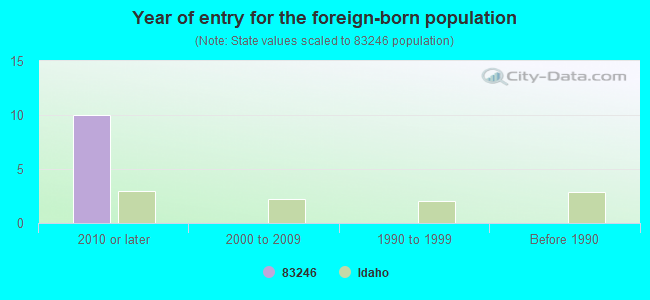
Year of entry for the foreign-born population
102010 or later
02000 to 2009
01990 to 1999
0Before 1990
Facilities with environmental interests located in this zip code:
LAVA ELEMENTARY SCHOOL (213 WEST FIFE in LAVA HOT SPRINGS, ID)
(Geographic Names Information System) (National Center for Education Statistics) - STATE ID-021 103 Organizations: MARSH VALLEY JOINT SCHOOL DISTRICT 21 (SCHOOL DISTRICT)
NORTHWEST PIPELINE CORPORATION (3 MILES WEST OF LAVA HOT SPRINGS in LAVA HOT SPRINGS, ID)
AIR MINOR (AIRS/AFS) (Resource Conservation and Recovery Act (tracking hazardous waste)) Business SIC classification: NATURAL GAS TRANSMISSION Organizations: UNKNOWN (CONTACT/OWNER)
Alternative names: NORTHWEST PIPELINE CORP LAVA HOT SPGS ST
ALLENS POLE TREATING CO (9906 S TOPAZ RD in LAVA HOT SPRINGS, ID)
(Resource Conservation and Recovery Act (tracking hazardous waste)) Organizations: LEONA ALLEN (CONTACT/OWNER)
IDAHO LAVA FOUNDATION (430 EAST MAIN in LAVA HOT SPRINGS, ID)
National Pollutant Discharge Elimination System NON-MAJOR (Tracking pollutant discharge elimination systems) - permit Business SIC classification: NONCLASSIFIABLE ESTABLISHMENTS Alternative names: BOB MELINE, DIRECTOR, IDAHO HOT SPRINGS FOUNDATION
RINGS HOTEL-THERAPEUTIC POOL (RIVERSIDE INN in LAVA HOT SPRINGS, ID)
National Pollutant Discharge Elimination System NON-MAJOR (Tracking pollutant discharge elimination systems) - permit Business SIC classification: HOTELS AND MOTELS Alternative names: RIVERSIDE INN, RIVERSIDE INN-RIVERSIDE HOT SP
MAJESTIC MART #2 (695 MAIN E. HWY 30 in LAVA HOT SPRINGS, ID)
ENFORCEMENT/COMPLIANCE ACTIVITY (Integrated Compliance Information System)
Housing units lacking complete plumbing facilities: 0.4% Housing units lacking complete kitchen facilities: 0.4%
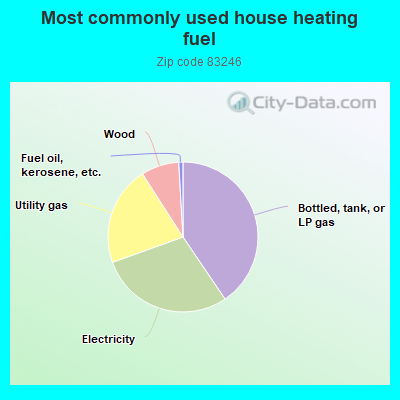
40.7%Bottled, tank, or LP gas
29.1%Electricity
21.5%Utility gas
8.2%Wood
0.9%Fuel oil, kerosene, etc.
Population in 1990: 512. Population change in the 1990s: +395 (+77.1%).
Place of birth for U.S.-born residents:
This state: 603
Midwest: 47
South: 61
West: 435
48% of the 83246 zip code residents lived in the same house 5 years ago. Out of people who lived in different houses, 51% lived in this county. Out of people who lived in different counties, 50% lived in Idaho.
83% of the 83246 zip code residents lived in the same house 1 year ago. Out of people who lived in different houses, 61% moved from this county. Out of people who lived in different houses, 28% moved from different county within same state. Out of people who lived in different houses, 7% moved from different state.
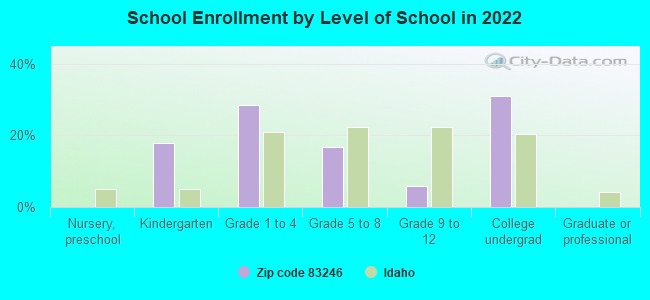
Private vs. public school enrollment:
Students in private schools in grades 1 to 8 (elementary and middle school):
Here:
0.0%
Idaho:
13.5%
Students in private schools in grades 9 to 12 (high school):
Here:
0.0%
Idaho:
8.5%
Students in private undergraduate colleges:
Here:
0.0%
Idaho:
30.0%
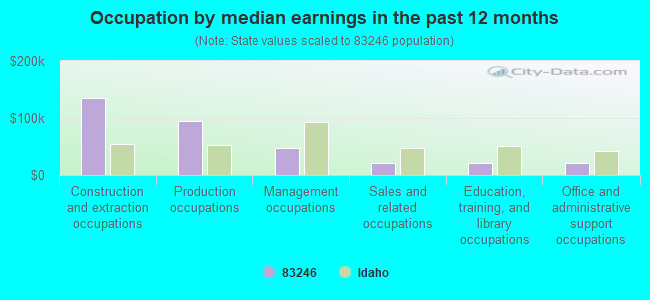
Occupation by median earnings in the past 12 months ($)
135,489Construction and extraction occupations
95,437Production occupations
46,503Management occupations
21,670Sales and related occupations
21,231Education, training, and library occupations
20,264Office and administrative support occupations
Top industries in this zip code by the number of employees in 2005:
Other Services (except Public Administration): Other Similar Organizations (except Business, Professional, Labor, and Political Organizations) (10-19: 1)
Utilities: Electric Power Distribution (10-19: 1)
Arts, Entertainment, and Recreation: Independent Artists, Writers, and Performers (10-19: 1)
Accommodation and Food Services: Full-Service Restaurants (5-9: 1, 1-4: 2)
Construction: New Single-Family Housing Construction (except Operative Builders) (1-4: 4)
Health Care and Social Assistance: Community Food Services (5-9: 1)
People in group quarters in 2000:
4 people in other noninstitutional group quarters
Fatal accident statistics in 2010:
Fatal accident count: 1
Vehicles involved in fatal accidents: 1
Fatal accidents caused by drunken drivers: 1
Fatalities: 1
Persons involved in fatal accidents: 1
Pedestrians involved in fatal accidents: 0
Home Mortgage Disclosure Act Aggregated Statistics For Year 2009 (Based on 2 partial tracts)
A) FHA, FSA/RHS & VA Home Purchase Loans
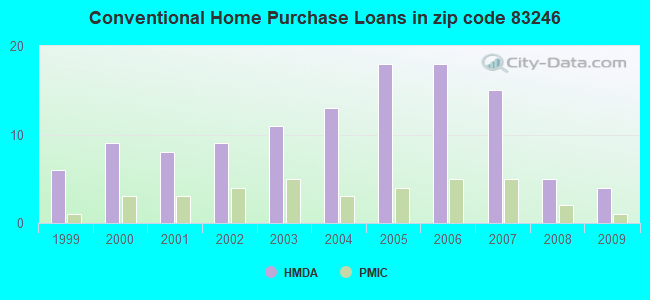
B) Conventional Home Purchase Loans
C) Refinancings
D) Home Improvement Loans
F) Non-occupant Loans on < 5 Family Dwellings (A B C & D)
G) Loans On Manufactured Home Dwelling (A B C & D)
Number
Average Value
Number
Average Value
Number
Average Value
Number
Average Value
Number
Average Value
Number
Average Value
LOANS ORIGINATED
7
$117,094
4
$140,208
29
$134,653
1
$45,910
3
$123,973
2
$81,185
APPLICATIONS APPROVED, NOT ACCEPTED
1
$107,200
0
$0
5
$142,070
0
$0
0
$0
1
$83,190
APPLICATIONS DENIED
2
$127,730
2
$127,095
12
$139,662
1
$20,640
2
$139,735
2
$109,300
APPLICATIONS WITHDRAWN
0
$0
0
$0
5
$169,618
1
$41,700
0
$0
0
$0
FILES CLOSED FOR INCOMPLETENESS
0
$0
0
$0
1
$188,910
0
$0
0
$0
0
$0
Aggregated Statistics For Year 2008 (Based on 2 partial tracts)
A) FHA, FSA/RHS & VA Home Purchase Loans
B) Conventional Home Purchase Loans
C) Refinancings
D) Home Improvement Loans
F) Non-occupant Loans on < 5 Family Dwellings (A B C & D)
G) Loans On Manufactured Home Dwelling (A B C & D)
Number
Average Value
Number
Average Value
Number
Average Value
Number
Average Value
Number
Average Value
Number
Average Value
LOANS ORIGINATED
4
$135,732
5
$168,396
19
$131,171
4
$35,328
4
$110,355
2
$114,880
APPLICATIONS APPROVED, NOT ACCEPTED
0
$0
1
$156,690
4
$126,255
1
$18,530
1
$61,500
0
$0
APPLICATIONS DENIED
1
$187,430
1
$217,970
15
$128,761
3
$95,543
1
$121,520
2
$142,785
APPLICATIONS WITHDRAWN
1
$103,830
1
$139,420
4
$166,690
0
$0
1
$141,100
1
$120,880
FILES CLOSED FOR INCOMPLETENESS
0
$0
1
$30,120
1
$208,700
0
$0
0
$0
0
$0
Aggregated Statistics For Year 2007 (Based on 2 partial tracts)
A) FHA, FSA/RHS & VA Home Purchase Loans
B) Conventional Home Purchase Loans
C) Refinancings
D) Home Improvement Loans
F) Non-occupant Loans on < 5 Family Dwellings (A B C & D)
G) Loans On Manufactured Home Dwelling (A B C & D)
Number
Average Value
Number
Average Value
Number
Average Value
Number
Average Value
Number
Average Value
Number
Average Value
LOANS ORIGINATED
1
$130,780
15
$116,223
18
$125,717
5
$61,832
5
$114,524
4
$120,885
APPLICATIONS APPROVED, NOT ACCEPTED
0
$0
2
$141,945
5
$138,448
1
$40,220
1
$100,670
0
$0
APPLICATIONS DENIED
0
$0
4
$157,898
14
$154,144
2
$84,660
2
$207,755
3
$80,590
APPLICATIONS WITHDRAWN
0
$0
0
$0
8
$141,076
0
$0
1
$61,280
1
$146,160
FILES CLOSED FOR INCOMPLETENESS
0
$0
0
$0
1
$189,120
0
$0
0
$0
0
$0
Aggregated Statistics For Year 2006 (Based on 2 partial tracts)
A) FHA, FSA/RHS & VA Home Purchase Loans
B) Conventional Home Purchase Loans
C) Refinancings
D) Home Improvement Loans
F) Non-occupant Loans on < 5 Family Dwellings (A B C & D)
G) Loans On Manufactured Home Dwelling (A B C & D)
Number
Average Value
Number
Average Value
Number
Average Value
Number
Average Value
Number
Average Value
Number
Average Value
LOANS ORIGINATED
1
$120,040
18
$97,882
18
$103,651
2
$54,230
4
$93,348
3
$77,500
APPLICATIONS APPROVED, NOT ACCEPTED
0
$0
2
$105,090
3
$102,703
0
$0
0
$0
0
$0
APPLICATIONS DENIED
0
$0
4
$89,190
18
$110,167
2
$77,290
1
$155,000
2
$123,095
APPLICATIONS WITHDRAWN
0
$0
1
$102,770
11
$101,184
0
$0
1
$25,480
1
$103,830
FILES CLOSED FOR INCOMPLETENESS
0
$0
0
$0
2
$132,255
0
$0
0
$0
0
$0
Aggregated Statistics For Year 2005 (Based on 2 partial tracts)
A) FHA, FSA/RHS & VA Home Purchase Loans
B) Conventional Home Purchase Loans
C) Refinancings
D) Home Improvement Loans
F) Non-occupant Loans on < 5 Family Dwellings (A B C & D)
G) Loans On Manufactured Home Dwelling (A B C & D)
Number
Average Value
Number
Average Value
Number
Average Value
Number
Average Value
Number
Average Value
Number
Average Value
LOANS ORIGINATED
1
$85,710
18
$97,847
18
$92,173
3
$40,717
5
$94,180
2
$92,770
APPLICATIONS APPROVED, NOT ACCEPTED
0
$0
2
$79,080
7
$86,917
1
$27,800
0
$0
1
$64,860
APPLICATIONS DENIED
1
$74,970
6
$88,873
24
$108,292
5
$54,420
2
$94,245
4
$88,452
APPLICATIONS WITHDRAWN
0
$0
1
$88,870
7
$104,969
1
$122,570
0
$0
0
$0
FILES CLOSED FOR INCOMPLETENESS
0
$0
0
$0
3
$112,670
0
$0
0
$0
1
$80,240
Aggregated Statistics For Year 2004 (Based on 2 partial tracts)
A) FHA, FSA/RHS & VA Home Purchase Loans
B) Conventional Home Purchase Loans
C) Refinancings
D) Home Improvement Loans
F) Non-occupant Loans on < 5 Family Dwellings (A B C & D)
G) Loans On Manufactured Home Dwelling (A B C & D)
Number
Average Value
Number
Average Value
Number
Average Value
Number
Average Value
Number
Average Value
Number
Average Value
LOANS ORIGINATED
1
$57,910
13
$91,125
21
$86,827
3
$50,193
4
$91,138
3
$55,037
APPLICATIONS APPROVED, NOT ACCEPTED
0
$0
3
$90,700
5
$89,842
0
$0
0
$0
0
$0
APPLICATIONS DENIED
1
$79,610
6
$74,237
16
$110,815
2
$55,070
1
$69,920
2
$58,970
APPLICATIONS WITHDRAWN
0
$0
2
$122,465
9
$109,442
0
$0
0
$0
0
$0
FILES CLOSED FOR INCOMPLETENESS
0
$0
1
$84,450
2
$85,295
0
$0
0
$0
0
$0
Aggregated Statistics For Year 2003 (Based on 2 partial tracts)
A) FHA, FSA/RHS & VA Home Purchase Loans
B) Conventional Home Purchase Loans
C) Refinancings
D) Home Improvement Loans
F) Non-occupant Loans on < 5 Family Dwellings (A B C & D)
Number
Average Value
Number
Average Value
Number
Average Value
Number
Average Value
Number
Average Value
LOANS ORIGINATED
1
$95,190
11
$92,798
36
$89,142
3
$16,007
4
$89,820
APPLICATIONS APPROVED, NOT ACCEPTED
0
$0
1
$110,560
6
$84,592
0
$0
0
$0
APPLICATIONS DENIED
1
$52,230
3
$85,853
19
$104,025
2
$13,270
0
$0
APPLICATIONS WITHDRAWN
0
$0
1
$73,290
12
$84,872
0
$0
0
$0
FILES CLOSED FOR INCOMPLETENESS
0
$0
1
$117,510
1
$89,720
0
$0
1
$66,970
Aggregated Statistics For Year 2002 (Based on 2 partial tracts)
A) FHA, FSA/RHS & VA Home Purchase Loans
B) Conventional Home Purchase Loans
C) Refinancings
D) Home Improvement Loans
F) Non-occupant Loans on < 5 Family Dwellings (A B C & D)
Number
Average Value
Number
Average Value
Number
Average Value
Number
Average Value
Number
Average Value
LOANS ORIGINATED
3
$69,640
9
$80,847
31
$89,743
1
$20,850
3
$68,163
APPLICATIONS APPROVED, NOT ACCEPTED
0
$0
2
$67,605
7
$79,306
0
$0
0
$0
APPLICATIONS DENIED
0
$0
2
$82,555
11
$89,984
3
$27,940
1
$72,450
APPLICATIONS WITHDRAWN
0
$0
0
$0
15
$101,313
1
$36,220
1
$65,710
FILES CLOSED FOR INCOMPLETENESS
0
$0
0
$0
1
$81,080
0
$0
0
$0
Aggregated Statistics For Year 2001 (Based on 2 partial tracts)
A) FHA, FSA/RHS & VA Home Purchase Loans
B) Conventional Home Purchase Loans
C) Refinancings
D) Home Improvement Loans
F) Non-occupant Loans on < 5 Family Dwellings (A B C & D)
Number
Average Value
Number
Average Value
Number
Average Value
Number
Average Value
Number
Average Value
LOANS ORIGINATED
3
$68,517
8
$77,001
26
$82,936
4
$15,952
1
$84,870
APPLICATIONS APPROVED, NOT ACCEPTED
0
$0
2
$70,655
2
$94,665
0
$0
0
$0
APPLICATIONS DENIED
0
$0
3
$51,317
10
$74,300
1
$17,690
1
$13,060
APPLICATIONS WITHDRAWN
0
$0
2
$62,760
10
$70,909
1
$24,220
0
$0
FILES CLOSED FOR INCOMPLETENESS
0
$0
0
$0
2
$83,080
0
$0
0
$0
Aggregated Statistics For Year 2000 (Based on 2 partial tracts)
A) FHA, FSA/RHS & VA Home Purchase Loans
B) Conventional Home Purchase Loans
C) Refinancings
D) Home Improvement Loans
F) Non-occupant Loans on < 5 Family Dwellings (A B C & D)
Number
Average Value
Number
Average Value
Number
Average Value
Number
Average Value
Number
Average Value
LOANS ORIGINATED
3
$66,270
9
$78,156
11
$73,997
3
$14,953
2
$65,600
APPLICATIONS APPROVED, NOT ACCEPTED
0
$0
1
$65,710
3
$86,207
0
$0
0
$0
APPLICATIONS DENIED
1
$78,550
6
$72,307
10
$71,035
2
$24,640
0
$0
APPLICATIONS WITHDRAWN
0
$0
2
$85,610
3
$60,373
0
$0
0
$0
FILES CLOSED FOR INCOMPLETENESS
0
$0
1
$64,230
1
$101,930
0
$0
0
$0
Aggregated Statistics For Year 1999 (Based on 1 partial tract)
A) FHA, FSA/RHS & VA Home Purchase Loans
B) Conventional Home Purchase Loans
C) Refinancings
D) Home Improvement Loans
F) Non-occupant Loans on < 5 Family Dwellings (A B C & D)
Detailed PMIC statistics for the following Tracts:0019.00
2002 - 2018 National Fire Incident Reporting System (NFIRS) incidents
According to the data from the years 2002 - 2018 the average number of fire incidents per year is 8. The highest number of reported fires - 18 took place in 2012, and the least - 0 in 2004. The data has a growing trend.
When looking into fire subcategories, the most incidents belonged to: Outside Fires (62.0%), and Structure Fires (17.1%).
Fire incident types reported to NFIRS in Zip Code 83246


 Nearest zip codes: 83217, 83250, 83234, 83245, 83241, 83281.


 According to the data from the years 2002 - 2018 the average number of fire incidents per year is 8. The highest number of reported fires - 18 took place in 2012, and the least - 0 in 2004. The data has a growing trend.
 When looking into fire subcategories, the most incidents belonged to: Outside Fires (62.0%), and Structure Fires (17.1%).