Estimated zip code population in 2022: 2,047 Zip code population in 2010: 1,639 Zip code population in 2000: 1,481
Houses and condos: 1,777 Renter-occupied apartments: 81
% of renters here:
8%
State:
34%
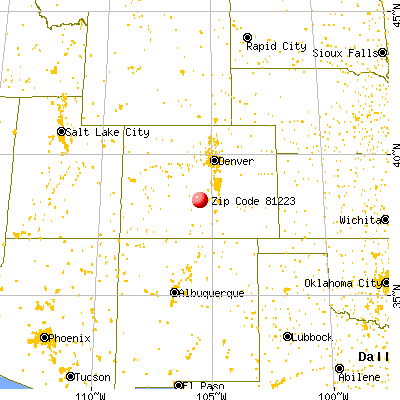
March 2022 cost of living index in zip code 81223: 96.9 (near average, U.S. average is 100)
Land area: 398.8 sq. mi. Water area: 0.0 sq. mi.
Population density: 5 people per square mile
(very low).
OSM Map
General Map
Google Map
MSN Map
OSM Map
General Map
Google Map
MSN Map
OSM Map
General Map
Google Map
MSN Map
OSM Map
General Map
Google Map
MSN Map
Please wait while loading the map...
Real estate property taxes paid for housing units in 2022:
This zip code:
0.2% ($632)
Colorado:
0.5% ($2,422)
Median real estate property taxes paid for housing units with mortgages in 2022: $530 (0.2%) Median real estate property taxes paid for housing units with no mortgage in 2022: $786 (0.3%)
Business Search- 14 Million verified businesses
Males: 1,046
(51.1%)
Females: 1,000
(48.9%)
For population 25 years and over in 81223:
High school or higher: 83.1%
Bachelor's degree or higher: 20.7%
Graduate or professional degree: 4.9%
Unemployed: 2.8%
Mean travel time to work (commute): 41.7 minutes
For population 15 years and over in 81223:
Never married: 18.4%
Now married: 66.7%
Separated: 0.0%
Widowed: 3.6%
Divorced: 11.3%
Zip code 81223 compared to state average:
Median household income below state average.
Median house value below state average.
Black race population percentage below state average.
Hispanic race population percentage significantly below state average.
Median age significantly above state average.
Foreign-born population percentage significantly below state average.
Renting percentage significantly below state average.
Length of stay since moving in significantly above state average.
House age below state average.
Number of college students significantly below state average.
Percentage of population with a bachelor's degree or higher below state average.
Averages for the 2020 tax year for zip code 81223, filed in 2021:
Average Adjusted Gross Income (AGI) in 2020: $60,706 (Individual Income Tax Returns)
Here:
$60,706
State:
$89,260
Salary/wage: $47,290 (reported on 63.0% of returns)
Here:
$47,290
State:
$70,330
(% of AGI for various income ranges: 911.4% for AGIs below $25k, 2984.7% for AGIs $25k-50k, 5511.0% for AGIs $50k-75k, 7656.0% for AGIs $75k-100k, 11940.0% for AGIs $100k-200k)
Taxable interest for individuals: $1,166 (reported on 35.0% of returns)
This zip code:
$1,166
Colorado:
$2,176
(% of AGI for various income ranges: 35.0% for AGIs below $25k, 18.8% for AGIs $25k-50k, 73.0% for AGIs $50k-75k, 78.0% for AGIs $75k-100k, 148.3% for AGIs $100k-200k)
Ordinary dividends: $5,805 (reported on 20.0% of returns)
Here:
$5,805
State:
$8,820
(% of AGI for various income ranges: 33.6% for AGIs below $25k, 47.1% for AGIs $25k-50k, 65.0% for AGIs $50k-75k, 94.0% for AGIs $75k-100k, 533.3% for AGIs $100k-200k)
Net capital gain/loss in AGI: +$14,067 (reported on 21.0% of returns)
Here:
+$14,067
State:
+$37,276
(% of AGI for various income ranges: 1.4% for AGIs below $25k, 67.6% for AGIs $25k-50k, 235.0% for AGIs $50k-75k, 298.0% for AGIs $75k-100k, 1965.0% for AGIs $100k-200k)
Profit/loss from business: +$15,765 (reported on 23.0% of returns)
Here:
+$15,765
State:
+$15,295
(% of AGI for various income ranges: 236.8% for AGIs below $25k, 401.8% for AGIs $25k-50k, 1191.0% for AGIs $50k-75k, 2051.7% for AGIs $100k-200k)
Taxable individual retirement arrangement distribution: $28,986 (reported on 14.0% of returns)
81223:
$28,986
Colorado:
$23,785
(% of AGI for various income ranges: 86.4% for AGIs below $25k, 270.0% for AGIs $25k-50k, 812.0% for AGIs $50k-75k, 4328.3% for AGIs $100k-200k)
Total itemized deductions: $28,617 (reported on 6.0% of returns)
Here:
$28,617
State:
$35,141
(% of AGI for various income ranges: 300.6% for AGIs $25k-50k, 2010.0% for AGIs $100k-200k)
Charity contributions: $10,850 (reported on 4.0% of returns)
Here:
$10,850
State:
$12,103
(% of AGI for various income ranges: 723.3% for AGIs $100k-200k)
Taxes paid: $7,160 (reported on 5.0% of returns)
81223:
$7,160
State:
$7,710
(% of AGI for various income ranges: 47.6% for AGIs $25k-50k, 461.7% for AGIs $100k-200k)
Earned income credit: $1,564 (reported on 14.0% of returns)
Here:
$1,564
State:
$2,053
(% of AGI for various income ranges: 57.3% for AGIs below $25k, 54.7% for AGIs $25k-50k)
Percentage of individuals using paid preparers for their 2020 taxes: 88.0%
Here:
88%
State:
93%
(% for various income ranges: 85.7% for AGIs below $25k, 91.7% for AGIs $25k-50k, 87.5% for AGIs $50k-75k, 88.9% for AGIs $75k-100k, 83.3% for AGIs $100k-200k, 100.0% for AGIs over 200k)
Averages for the 2012 tax year for zip code 81223, filed in 2013:
Average Adjusted Gross Income (AGI) in 2012: $51,199 (Individual Income Tax Returns)
Here:
$51,199
State:
$69,103
Salary/wage: $40,967 (reported on 66.7% of returns)
Here:
$40,967
State:
$54,794
(% of AGI for various income ranges: 52.3% for AGIs below $25k, 58.7% for AGIs $25k-50k, 52.9% for AGIs $50k-75k, 56.1% for AGIs $75k-100k, 102.3% for AGIs $100k-200k)
Taxable interest for individuals: $1,296 (reported on 40.6% of returns)
This zip code:
$1,296
Colorado:
$1,971
(% of AGI for various income ranges: 1.0% for AGIs below $25k, 0.8% for AGIs $25k-50k, 2.0% for AGIs $50k-75k, 0.2% for AGIs $75k-100k, 1.9% for AGIs $100k-200k)
Ordinary dividends: $2,779 (reported on 20.3% of returns)
Here:
$2,779
State:
$7,140
(% of AGI for various income ranges: 2.1% for AGIs below $25k, 0.5% for AGIs $25k-50k, 0.7% for AGIs $50k-75k, 3.3% for AGIs $100k-200k)
Net capital gain/loss in AGI: +$12,225 (reported on 17.4% of returns)
Here:
+$12,225
State:
+$23,009
(% of AGI for various income ranges: 2.1% for AGIs $50k-75k, 18.7% for AGIs $100k-200k)
Profit/loss from business: +$8,369 (reported on 23.2% of returns)
Here:
+$8,369
State:
+$13,514
(% of AGI for various income ranges: 11.2% for AGIs below $25k, 10.3% for AGIs $25k-50k, 5.4% for AGIs $50k-75k)
Taxable individual retirement arrangement distribution: $22,073 (reported on 15.9% of returns)
81223:
$22,073
Colorado:
$17,927
(% of AGI for various income ranges: 9.5% for AGIs below $25k, 3.6% for AGIs $25k-50k, 7.0% for AGIs $50k-75k, 19.4% for AGIs $100k-200k)
Total itemized deductions: $20,810 (22% of AGI, reported on 29.0% of returns)
Here:
$20,810
State:
$24,621
Here:
21.8% of AGI
State:
18.5% of AGI
(% of AGI for various income ranges: 7.5% for AGIs below $25k, 14.3% for AGIs $25k-50k, 13.6% for AGIs $50k-75k, 10.4% for AGIs $75k-100k, 23.0% for AGIs $100k-200k)
Charity contributions: $4,525 (reported on 23.2% of returns)
Here:
$4,525
State:
$4,449
(% of AGI for various income ranges: 2.7% for AGIs $25k-50k, 2.5% for AGIs $50k-75k, 5.5% for AGIs $100k-200k)
Taxes paid: $4,935 (reported on 29.0% of returns)
81223:
$4,935
State:
$7,641
(% of AGI for various income ranges: 0.8% for AGIs below $25k, 2.1% for AGIs $25k-50k, 2.3% for AGIs $50k-75k, 2.0% for AGIs $75k-100k, 8.1% for AGIs $100k-200k)
Earned income credit: $2,031 (reported on 18.8% of returns)
Here:
$2,031
State:
$2,095
(% of AGI for various income ranges: 5.3% for AGIs below $25k, 1.2% for AGIs $25k-50k)
Percentage of individuals using paid preparers for their 2012 taxes: 46.4%
Here:
46%
State:
49%
(% for various income ranges: 41.4% for AGIs below $25k, 47.1% for AGIs $25k-50k, 45.5% for AGIs $50k-75k, 60.0% for AGIs $75k-100k, 80.0% for AGIs $100k-200k)
Averages for the 2004 tax year for zip code 81223, filed in 2005:
Average Adjusted Gross Income (AGI) in 2004: $40,826 (Individual Income Tax Returns)
Here:
$40,826
State:
$55,014
Salary/wage: $30,708 (reported on 72.0% of returns)
Here:
$30,708
State:
$46,010
(% of AGI for various income ranges: 67.4% for AGIs below $10k, 60.0% for AGIs $10k-25k, 68.2% for AGIs $25k-50k, 61.9% for AGIs $50k-75k, 56.7% for AGIs $75k-100k, 33.1% for AGIs over 100k)
Taxable interest for individuals: $1,511 (reported on 48.7% of returns)
This zip code:
$1,511
Colorado:
$2,127
(% of AGI for various income ranges: 7.8% for AGIs below $10k, 2.1% for AGIs $10k-25k, 1.9% for AGIs $25k-50k, 1.3% for AGIs $50k-75k, 1.3% for AGIs $75k-100k, 1.7% for AGIs over 100k)
Taxable dividends: $2,154 (reported on 23.2% of returns)
Here:
$2,154
State:
$3,782
(% of AGI for various income ranges: 6.4% for AGIs below $10k, 1.3% for AGIs $10k-25k, 0.7% for AGIs $25k-50k, 0.7% for AGIs $50k-75k, 1.9% for AGIs over 100k)
Net capital gain/loss: +$11,176 (reported on 19.5% of returns)
Here:
+$11,176
State:
+$17,882
(% of AGI for various income ranges: -2.2% for AGIs below $10k, 1.0% for AGIs $10k-25k, 0.2% for AGIs $25k-50k, 2.3% for AGIs $50k-75k, 15.5% for AGIs over 100k)
Profit/loss from business: +$6,532 (reported on 25.5% of returns)
Here:
+$6,532
State:
+$11,247
(% of AGI for various income ranges: 10.9% for AGIs below $10k, 14.1% for AGIs $10k-25k, 4.5% for AGIs $25k-50k, 4.1% for AGIs $50k-75k, 2.5% for AGIs $75k-100k)
IRA payment deduction: $3,286 (reported on 4.2% of returns)
81223:
$3,286
Colorado:
$2,947
Total itemized deductions: $17,815 (24% of AGI, reported on 34.7% of returns)
Here:
$17,815
State:
$20,560
Here:
23.9% of AGI
State:
21.4% of AGI
(% of AGI for various income ranges: 22.8% for AGIs below $10k, 12.4% for AGIs $10k-25k, 15.3% for AGIs $25k-50k, 17.3% for AGIs $50k-75k, 19.0% for AGIs $75k-100k, 12.7% for AGIs over 100k)
Charity contributions deductions: $2,893 (4% of AGI, reported on 29.4% of returns)
Here:
$2,893
State:
$3,518
Here:
3.7% of AGI
State:
3.4% of AGI
(% of AGI for various income ranges: 0.6% for AGIs below $10k, 1.2% for AGIs $10k-25k, 1.7% for AGIs $25k-50k, 2.0% for AGIs $50k-75k, 1.6% for AGIs $75k-100k, 3.0% for AGIs over 100k)
Total tax: $5,187 (reported on 75.1% of returns)
81223:
$5,187
State:
$9,173
(% of AGI for various income ranges: 5.0% for AGIs below $10k, 5.0% for AGIs $10k-25k, 6.7% for AGIs $25k-50k, 8.9% for AGIs $50k-75k, 10.3% for AGIs $75k-100k, 14.1% for AGIs over 100k)
Earned income credit: $1,568 (reported on 16.5% of returns)
Here:
$1,568
State:
$1,595
Percentage of individuals using paid preparers for their 2004 taxes: 56.6%
Here:
57%
State:
55%
(% for various income ranges: 43.7% for AGIs below $10k, 56.9% for AGIs $10k-25k, 61.0% for AGIs $25k-50k, 55.8% for AGIs $50k-75k, 75.9% for AGIs $75k-100k, 77.4% for AGIs over 100k)
Household received Food Stamps/SNAP in the past 12 months: 104 Household did not receive Food Stamps/SNAP in the past 12 months: 950
Women who had a birth in the past 12 months: 24 (25 now married, 0 unmarried) Women who did not have a birth in the past 12 months: 206 (82 now married, 124 unmarried)
Housing units in zip code 81223 with a mortgage: 392 (3 second mortgage, 3 both second mortgage and home equity loan) Median monthly owner costs for units with a mortgage: $1,383 Median monthly owner costs for units without a mortgage: $411
Residents with income below the poverty level in 2022:
This zip code:
20.4%
Whole state:
9.4%
Residents with income below 50% of the poverty level in 2022:
This zip code:
17.5%
Whole state:
4.6%
Median number of rooms in houses and condos:
Here:
5.3
State:
6.8
Median number of rooms in apartments:
Here:
6.0
State:
4.0
Notable locations in this zip code not listed on our city pages
Notable locations in zip code 81223: Adamic Cow Camp (A), Deer Mountain Volunteer Fire Department Station 2 - Cotopaxi Fire Rescue (B), Deer Mountain Volunteer Fire Department Station 1 Deer Mountain Volunteer Fire Department (C), Fremont County Sheriff's Office Substation (D). Display/hide their locations on the map
Creeks: Bills Creek (A), Miller Creek (B), Carrol Creek (C), Monument Creek (D), Quagmire Creek (E), West Waugh Creek (F), Wolf Creek (G), Bernard Creek (H), Oak Creek (I). Display/hide their locations on the map
Size of family households: 574 2-persons, 128 3-persons, 37 4-persons, 13 5-persons
Size of nonfamily households: 219 1-person, 89 2-persons
72 married couples with children.
54 single-parent households (54 men).
98.0% of residents of 81223 zip code speak English at home.
2.0% of residents speak Spanish at home (95% very well, 5% not well).
2.1% of residents speak other Indo-European language at home (100% very well).
0.1% of residents speak Asian or Pacific Island language at home (100% very well).
Foreign born population: 59 (2.9%) (100.0% of them are naturalized citizens)
This zip code:
2.9%
Whole state:
9.5%
50%Honduras
29%Bolivia
16%France
5%Taiwan
19%German
14%English
12%Polish
8%Dutch
7%American
7%Norwegian
3%European
Year of entry for the foreign-born population
332010 or later
02000 to 2009
01990 to 1999
90Before 1990
Facilities with environmental interests located in this zip code:
HIGH VALLEY MHP (493 SHANNON ROAD in TEXAS CREEK, CO)
ENFORCEMENT/COMPLIANCE ACTIVITY (Integrated Compliance Information System) - ICIS-08-2002-0071, FORMAL ENFORCEMENT ACTION (Integrated Compliance Information System) - ICIS-08-2002-0071, FORMAL ENFORCEMENT ACTION
GLEN VISTA PROPERTY OWNER'S ASSOCIATION, (SEC 32 T19S R72W in CANON CITY, 10.7 MI SW OF, CO)
AIR MINOR (AIRS/AFS) Business SIC classification: CONSTRUCTION SAND AND GRAVEL
Housing units lacking complete plumbing facilities: 4.3% Housing units lacking complete kitchen facilities: 4.6%
54.4%Bottled, tank, or LP gas
27.8%Wood
5.3%Electricity
5.1%Utility gas
4.9%Fuel oil, kerosene, etc.
2.2%No fuel used
0.6%Other fuel
Place of birth for U.S.-born residents:
This state: 550
Northeast: 207
Midwest: 634
South: 288
West: 244
38% of the 81223 zip code residents lived in the same house 5 years ago. Out of people who lived in different houses, 25% lived in this county. Out of people who lived in different counties, 50% lived in Colorado.
97% of the 81223 zip code residents lived in the same house 1 year ago. Out of people who lived in different houses, 42% moved from this county. Out of people who lived in different houses, 22% moved from different county within same state. Out of people who lived in different houses, 52% moved from different state.
Private vs. public school enrollment:
Students in private schools in grades 1 to 8 (elementary and middle school): 34
Here:
53.8%
Colorado:
11.4%
Students in private schools in grades 9 to 12 (high school):
Here:
0.0%
Colorado:
8.5%
Students in private undergraduate colleges:
Here:
0.0%
Colorado:
14.0%
Occupation by median earnings in the past 12 months ($)
111,874Installation, maintenance, and repair occupations
65,746Business and financial operations occupations
63,195Construction and extraction occupations
53,132Management occupations
45,079Education, training, and library occupations
16,964Sales and related occupations
Companies with federal contracts located in this zip code:
MICHAEL OSWALD (606 BIG BOW DR in COTOPAXI, CO; small business) : $78,215 in 5 contractsin 2003
Contracts for Land Treatment Practices Services (plowing/clearing, etc.), Tree Thinning Services by Bureau of Land Management Signed by year:2000: $0; 2001: $0; 2002: $0; 2003: $78,215; 2004: $0; 2005: $0; 2006: $0.
Biggest contracts:
$35,855 with Bureau of Land Management for Land Treatment Practices Services (plowing/clearing, etc.). Signed on 2003-09-15. Completion date: 2003-11-15.
$23,075, same as above.Signed on 2003-07-15. Completion date: 2003-11-15.
$16,150 with Bureau of Land Management for Tree Thinning Services. Signed on 2003-02-15. Completion date: 2003-04-15.
$3,135, same as above.Signed on 2003-04-15. Completion date: 2003-04-15.
Top industries in this zip code by the number of employees in 2005:
Accommodation and Food Services: RV (Recreational Vehicle) Parks and Campgrounds (20-49 employees: 1 establishment, 1-4 employees: 1 establishment)
Professional, Scientific, and Technical Services: Research and Development in the Social Sciences and Humanities (20-49: 1)
Construction: Poured Concrete Foundation and Structure Contractors (10-19: 1, 1-4: 1)
Construction: Site Preparation Contractors (5-9: 1)
Construction: Highway, Street, and Bridge Construction (5-9: 1)
Arts, Entertainment, and Recreation: All Other Amusement and Recreation Industries (1-4: 2)
Construction: Plumbing, Heating, and Air-Conditioning Contractors (1-4: 2)
Construction: New Single-Family Housing Construction (except Operative Builders) (1-4: 2)
Accommodation and Food Services: Full-Service Restaurants (1-4: 1)
Health Care and Social Assistance: Other Individual and Family Services (1-4: 1)
Fatal accident statistics in 2014:
Fatal accident count: 1
Vehicles involved in fatal accidents: 1
Fatal accidents caused by drunken drivers: 1
Fatalities: 1
Persons involved in fatal accidents: 1
Pedestrians involved in fatal accidents: 0
Fatal accident statistics in 2011:
Fatal accident count: 3
Vehicles involved in fatal accidents: 3
Fatal accidents caused by drunken drivers: 1
Fatalities: 3
Persons involved in fatal accidents: 5
Pedestrians involved in fatal accidents: 0
2006 - 2018 National Fire Incident Reporting System (NFIRS) incidents
According to the data from the years 2006 - 2018 the average number of fires per year is 12. The highest number of reported fire incidents - 31 took place in 2016, and the least - 3 in 2007. The data has a declining trend.
When looking into fire subcategories, the most incidents belonged to: Outside Fires (62.7%), and Structure Fires (29.3%).
Fire incident types reported to NFIRS in Zip Code 81223


 Nearest zip codes: 81232, 81222, 81233, 81212, 81252, 81143.


 According to the data from the years 2006 - 2018 the average number of fires per year is 12. The highest number of reported fire incidents - 31 took place in 2016, and the least - 3 in 2007. The data has a declining trend.
 When looking into fire subcategories, the most incidents belonged to: Outside Fires (62.7%), and Structure Fires (29.3%).