Estimated zip code population in 2022: 979 Zip code population in 2010: 851 Zip code population in 2000: 808
Houses and condos: 1,992 Renter-occupied apartments: 6
% of renters here:
1%
State:
34%
March 2022 cost of living index in zip code 80545: 91.7 (less than average, U.S. average is 100)
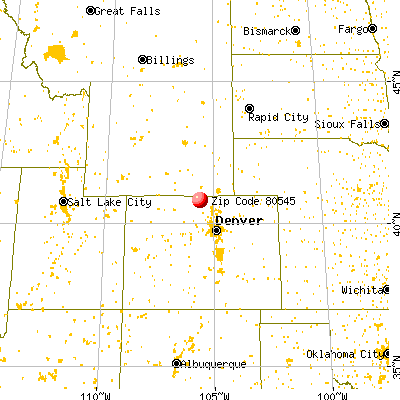
Land area: 282.9 sq. mi. Water area: 1.0 sq. mi.
Population density: 3 people per square mile
(very low).
OSM Map
General Map
Google Map
MSN Map
OSM Map
General Map
Google Map
MSN Map
OSM Map
General Map
Google Map
MSN Map
OSM Map
General Map
Google Map
MSN Map
Please wait while loading the map...
Real estate property taxes paid for housing units in 2022:
This zip code:
0.5% ($1,980)
Colorado:
0.5% ($2,422)
Median real estate property taxes paid for housing units with mortgages in 2022: $1,997 (0.5%) Median real estate property taxes paid for housing units with no mortgage in 2022: $1,953 (0.5%)
Averages for the 2020 tax year for zip code 80545, filed in 2021:
Average Adjusted Gross Income (AGI) in 2020: $70,313 (Individual Income Tax Returns)
Here:
$70,313
State:
$89,260
Salary/wage: $57,829 (reported on 66.0% of returns)
Here:
$57,829
State:
$70,330
(% of AGI for various income ranges: 851.0% for AGIs below $25k, 2743.3% for AGIs $25k-50k, 3364.0% for AGIs $50k-75k, 9500.0% for AGIs $75k-100k, 13510.0% for AGIs $100k-200k)
Taxable interest for individuals: $781 (reported on 44.7% of returns)
This zip code:
$781
Colorado:
$2,176
(% of AGI for various income ranges: 35.0% for AGIs below $25k, 36.7% for AGIs $25k-50k, 92.0% for AGIs $50k-75k, 53.3% for AGIs $75k-100k, 42.5% for AGIs $100k-200k)
Ordinary dividends: $4,213 (reported on 31.9% of returns)
Here:
$4,213
State:
$8,820
(% of AGI for various income ranges: 78.0% for AGIs below $25k, 58.3% for AGIs $25k-50k, 108.0% for AGIs $50k-75k, 416.7% for AGIs $75k-100k, 367.5% for AGIs $100k-200k)
Net capital gain/loss in AGI: +$12,221 (reported on 29.8% of returns)
Here:
+$12,221
State:
+$37,276
(% of AGI for various income ranges: 201.0% for AGIs below $25k, 112.0% for AGIs $50k-75k, 450.0% for AGIs $75k-100k, 1097.5% for AGIs $100k-200k)
Profit/loss from business: +$7,856 (reported on 19.1% of returns)
Here:
+$7,856
State:
+$15,295
(% of AGI for various income ranges: 138.0% for AGIs below $25k, 280.0% for AGIs $25k-50k, 1336.7% for AGIs $75k-100k)
Taxable individual retirement arrangement distribution: $19,338 (reported on 17.0% of returns)
80545:
$19,338
Colorado:
$23,785
(% of AGI for various income ranges: 352.0% for AGIs below $25k, 1168.0% for AGIs $50k-75k, 1527.5% for AGIs $100k-200k)
Total itemized deductions: $33,460 (reported on 10.6% of returns)
Here:
$33,460
State:
$35,141
(% of AGI for various income ranges: 4182.5% for AGIs $100k-200k)
Charity contributions: $13,433 (reported on 6.4% of returns)
Here:
$13,433
State:
$12,103
(% of AGI for various income ranges: 1007.5% for AGIs $100k-200k)
Taxes paid: $6,820 (reported on 10.6% of returns)
80545:
$6,820
State:
$7,710
(% of AGI for various income ranges: 852.5% for AGIs $100k-200k)
Earned income credit: $1,300 (reported on 12.8% of returns)
Here:
$1,300
State:
$2,053
(% of AGI for various income ranges: 78.0% for AGIs below $25k)
Percentage of individuals using paid preparers for their 2020 taxes: 91.5%
Here:
91%
State:
93%
(% for various income ranges: 81.2% for AGIs below $25k, 88.9% for AGIs $25k-50k, 100.0% for AGIs $50k-75k, 100.0% for AGIs $75k-100k, 100.0% for AGIs $100k-200k, 100.0% for AGIs over 200k)
Averages for the 2012 tax year for zip code 80545, filed in 2013:
Average Adjusted Gross Income (AGI) in 2012: $48,462 (Individual Income Tax Returns)
Here:
$48,462
State:
$69,103
Salary/wage: $30,191 (reported on 67.6% of returns)
Here:
$30,191
State:
$54,794
(% of AGI for various income ranges: 65.1% for AGIs below $25k, 41.2% for AGIs $25k-50k, 70.1% for AGIs $50k-75k, 36.2% for AGIs $100k-200k)
Taxable interest for individuals: $547 (reported on 44.1% of returns)
This zip code:
$547
Colorado:
$1,971
(% of AGI for various income ranges: 0.7% for AGIs below $25k, 0.6% for AGIs $25k-50k, 0.5% for AGIs $50k-75k, 0.5% for AGIs $100k-200k)
Ordinary dividends: $3,150 (reported on 29.4% of returns)
Here:
$3,150
State:
$7,140
(% of AGI for various income ranges: 4.6% for AGIs below $25k, 1.5% for AGIs $50k-75k, 2.5% for AGIs $100k-200k)
Net capital gain/loss in AGI: +$6,857 (reported on 20.6% of returns)
Here:
+$6,857
State:
+$23,009
(% of AGI for various income ranges: 1.3% for AGIs $25k-50k, 25.8% for AGIs $75k-100k)
Profit/loss from business: +$5,614 (reported on 20.6% of returns)
Here:
+$5,614
State:
+$13,514
Taxable individual retirement arrangement distribution: $16,467 (reported on 17.6% of returns)
80545:
$16,467
Colorado:
$17,927
Total itemized deductions: $21,575 (25% of AGI, reported on 35.3% of returns)
Here:
$21,575
State:
$24,621
Here:
25.4% of AGI
State:
18.5% of AGI
(% of AGI for various income ranges: 22.9% for AGIs below $25k, 16.1% for AGIs $25k-50k, 29.5% for AGIs $50k-75k, 12.4% for AGIs $100k-200k)
Charity contributions: $1,600 (reported on 29.4% of returns)
Here:
$1,600
State:
$4,449
(% of AGI for various income ranges: 1.9% for AGIs $25k-50k, 2.2% for AGIs $50k-75k, 0.7% for AGIs $100k-200k)
Taxes paid: $5,509 (reported on 32.4% of returns)
80545:
$5,509
State:
$7,641
(% of AGI for various income ranges: 1.9% for AGIs below $25k, 2.5% for AGIs $25k-50k, 6.0% for AGIs $50k-75k, 4.7% for AGIs $100k-200k)
Earned income credit: $1,160 (reported on 14.7% of returns)
Here:
$1,160
State:
$2,095
(% of AGI for various income ranges: 2.8% for AGIs below $25k)
Percentage of individuals using paid preparers for their 2012 taxes: 47.1%
Here:
47%
State:
49%
(% for various income ranges: 31.2% for AGIs below $25k, 50.0% for AGIs $25k-50k, 100.0% for AGIs $50k-75k, 75.0% for AGIs $100k-200k)
Averages for the 2004 tax year for zip code 80545, filed in 2005:
Average Adjusted Gross Income (AGI) in 2004: $44,753 (Individual Income Tax Returns)
Here:
$44,753
State:
$55,014
Salary/wage: $27,942 (reported on 63.5% of returns)
Here:
$27,942
State:
$46,010
(% of AGI for various income ranges: 72.8% for AGIs below $10k, 51.8% for AGIs $10k-25k, 47.3% for AGIs $25k-50k, 40.0% for AGIs $50k-75k, 50.6% for AGIs $75k-100k, 28.1% for AGIs over 100k)
Taxable interest for individuals: $1,556 (reported on 56.2% of returns)
This zip code:
$1,556
Colorado:
$2,127
(% of AGI for various income ranges: 5.8% for AGIs below $10k, 2.6% for AGIs $10k-25k, 1.5% for AGIs $25k-50k, 1.1% for AGIs $50k-75k, 0.8% for AGIs $75k-100k, 2.4% for AGIs over 100k)
Taxable dividends: $2,905 (reported on 30.4% of returns)
Here:
$2,905
State:
$3,782
(% of AGI for various income ranges: 3.5% for AGIs below $10k, 1.5% for AGIs $10k-25k, 4.0% for AGIs $25k-50k, 0.2% for AGIs $50k-75k, 1.1% for AGIs $75k-100k, 1.9% for AGIs over 100k)
Net capital gain/loss: +$17,500 (reported on 26.8% of returns)
Here:
+$17,500
State:
+$17,882
(% of AGI for various income ranges: 0.5% for AGIs $10k-25k, 1.4% for AGIs $25k-50k, 8.9% for AGIs $50k-75k, 21.3% for AGIs over 100k)
Profit/loss from business: +$3,962 (reported on 27.6% of returns)
Here:
+$3,962
State:
+$11,247
(% of AGI for various income ranges: 6.7% for AGIs below $10k, 10.5% for AGIs $10k-25k, 0.3% for AGIs $25k-50k, -2.5% for AGIs $50k-75k, 3.3% for AGIs over 100k)
Total itemized deductions: $18,167 (24% of AGI, reported on 40.9% of returns)
Here:
$18,167
State:
$20,560
Here:
23.7% of AGI
State:
21.4% of AGI
(% of AGI for various income ranges: 36.2% for AGIs below $10k, 17.1% for AGIs $10k-25k, 22.3% for AGIs $25k-50k, 15.0% for AGIs $50k-75k, 19.6% for AGIs $75k-100k, 12.5% for AGIs over 100k)
Charity contributions deductions: $2,206 (3% of AGI, reported on 35.7% of returns)
Here:
$2,206
State:
$3,518
Here:
2.8% of AGI
State:
3.4% of AGI
(% of AGI for various income ranges: 2.0% for AGIs below $10k, 1.9% for AGIs $10k-25k, 2.3% for AGIs $25k-50k, 1.3% for AGIs $50k-75k, 1.7% for AGIs $75k-100k, 1.6% for AGIs over 100k)
Total tax: $6,374 (reported on 80.1% of returns)
80545:
$6,374
State:
$9,173
(% of AGI for various income ranges: 5.8% for AGIs below $10k, 5.1% for AGIs $10k-25k, 6.8% for AGIs $25k-50k, 9.7% for AGIs $50k-75k, 10.7% for AGIs $75k-100k, 16.1% for AGIs over 100k)
Earned income credit: $868 (reported on 13.9% of returns)
Here:
$868
State:
$1,595
Percentage of individuals using paid preparers for their 2004 taxes: 54.1%
Here:
54%
State:
55%
(% for various income ranges: 48.8% for AGIs below $10k, 50.0% for AGIs $10k-25k, 50.5% for AGIs $25k-50k, 64.9% for AGIs $50k-75k, 58.3% for AGIs $75k-100k, 75.8% for AGIs over 100k)
Household received Food Stamps/SNAP in the past 12 months: 33 Household did not receive Food Stamps/SNAP in the past 12 months: 506
Women who did not have a birth in the past 12 months: 112 (73 now married, 38 unmarried)
Housing units in zip code 80545 with a mortgage: 358 (18 second mortgage, 19 both second mortgage and home equity loan) Median monthly owner costs for units with a mortgage: $1,615 Median monthly owner costs for units without a mortgage: $535
Residents with income below the poverty level in 2022:
This zip code:
5.0%
Whole state:
9.4%
Residents with income below 50% of the poverty level in 2022:
This zip code:
1.4%
Whole state:
4.6%
Median number of rooms in houses and condos:
Here:
5.3
State:
6.8
Notable locations in this zip code not listed on our city pages
Notable locations in zip code 80545: North Fork Poudre Campground (A), North Lone Pine Trailhead (B), Poudre Valley REA (C), Bellaire Lake Campground (D), Red Feather Forest Service Facility (E), West Lake Campground (F), Dowdy Lake Campground (G), Creedmore Lakes Campground (H), Lost Lake Campground (I), George Creek Guard Station (J), Red Feather Ranch (K), Maxwell Ranch (L), Deadman Picnic Area (M), Eaton Ditch Camp (N), Black Mountain Ranch (O), Painted Post Ranch (P), Ben Delatour Scout Camp (Q), Poudre Canyon Fire Protection District Station 4 Manhattan Creek (R), Crystal Lakes Volunteer Fire Department (S), Red Feather Lakes Volunteer Fire Department (T). Display/hide their locations on the map
Cemeteries: Robinson Ranch Cemetery (1), Black Mountain Ranch Cemetery (2), Jewett Family Cemetery (3), Edward Halliday Grave (4), Levi Yockey Grave (5), Worster Cemetery (6), Great Stupa Cemetery (7). Display/hide their locations on the map
Lakes and reservoirs: Pocahontas Lake (A), Lake Erie (B), Creedmore Lakes (C), Lost Lake (D), Windy Gap Lake (E), Lake Nokomis (F), Apache Lake (G), Shagwa Lake (H). Display/hide their locations on the map
Creeks: Cow Creek (A), Cornelius Creek (B), Panhandle Creek (C), Trout Creek (D), Beaver Creek (E), Columbine Creek (F), Swamp Creek (G), Beartrap Creek (H), Killpecker Creek (I). Display/hide their locations on the map
In group quarters: 39 (-1 institutionalized population)
Size of family households: 233 2-persons, 67 3-persons, 8 4-persons, 20 5-persons
Size of nonfamily households: 206 1-person, 6 2-persons
52 married couples with children.
9 single-parent households (9 women).
99.8% of residents of 80545 zip code speak English at home.
1.9% of residents speak Spanish at home (100% very well).
Foreign born population: 0 (0.0%)
:
0.0%
Whole state:
9.5%
34%German
29%English
13%American
7%Swedish
5%Irish
3%Norwegian
3%European
Facilities with environmental interests located in this zip code:
BEN DELATOUR BOY SCOUT RANCH (2331 WEST COUNTY ROAD 68C in RED FEATHER LAKES, CO)
National Pollutant Discharge Elimination System NON-MAJOR (Tracking pollutant discharge elimination systems) - permit Business SIC classification: SEWERAGE SYSTEMS Organizations: LONGS PEAK COUNCIL, INC. (CONTACT/OWNER)
Alternative names: LONGS PEAK COUNCIL, INC.
CRYSTAL LAKES WATER & SEWER ASSOCIATION (2 MI NW RED FEATHER LAKES in RED FEATHER LAKES, CO)
AIR MINOR (AIRS/AFS) CRITERIA AND HAZARDOUS AIR POLLUTANT INVENTORY (Inventory of air pollution sources) Business SIC classification: CONSTRUCTION SAND AND GRAVEL
FOX ACRES COMM. SVCS. CORP. (222 BLACK BEAR TRAIL in RED FEATHER LAKES, CO)
National Pollutant Discharge Elimination System NON-MAJOR (Tracking pollutant discharge elimination systems) - permit Business SIC classification: SEWERAGE SYSTEMS
CAMPBELL DEVELOPMENT INC (1415 FOX ACRES DR. WEST in RED FEATHER LAKES, CO)
Conditionally Exempt Small Quantity Generators, less than 100 kg/month of hazardous waste (Resource Conservation and Recovery Act (tracking hazardous waste)) - notification
CRYSTAL LAKES WATER & SEWER ASSOCIATION (300 TAMI ROAD in RED FEATHER LAKES, CO)
ENFORCEMENT/COMPLIANCE ACTIVITY (Integrated Compliance Information System)
Housing units lacking complete plumbing facilities: 12.9% Housing units lacking complete kitchen facilities: 9.9%
61.5%Bottled, tank, or LP gas
19.1%Wood
15.0%Electricity
3.9%Utility gas
1.2%Other fuel
Population in 1990: 440. Population change in the 1990s: +368 (+83.6%).
Place of birth for U.S.-born residents:
This state: 298
Northeast: 136
Midwest: 303
South: 99
West: 141
50% of the 80545 zip code residents lived in the same house 5 years ago. Out of people who lived in different houses, 32% lived in this county. Out of people who lived in different counties, 50% lived in Colorado.
77% of the 80545 zip code residents lived in the same house 1 year ago. Out of people who lived in different houses, 36% moved from this county. Out of people who lived in different houses, 43% moved from different county within same state. Out of people who lived in different houses, 18% moved from different state.
Private vs. public school enrollment:
Students in private schools in grades 1 to 8 (elementary and middle school):
Here:
0.0%
Colorado:
11.4%
Students in private schools in grades 9 to 12 (high school):
Here:
0.0%
Colorado:
8.5%
Students in private undergraduate colleges:
Here:
0.0%
Colorado:
14.0%
Occupation by median earnings in the past 12 months ($)
245,608Management occupations
50,742Transportation occupations
41,302Sales and related occupations
21,328Education, training, and library occupations
Companies with federal contracts located in this zip code:
INSIDE OUTSIDE INTERPRETATION, (205 SHUSWAP COURT in RED FEATHER LA, CO; small business)
$82,500 with U.S. Army Corps of Engineers - civil program financing only for Other Environmental Services, Studies, and Analytical Support. Taking place in TX. Signed on 1999-10-08. Completion date: 2000-10-08.
Top industries in this zip code by the number of employees in 2005:
Health Care and Social Assistance: Other Individual and Family Services (50-99: 1)
Administrative and Support and Waste Management and Remediation Services: Office Administrative Services (20-49: 1)
Accommodation and Food Services: Hotels (except Casino Hotels) and Motels (10-19: 1, 1-4: 1)
Other Services (except Public Administration): Other Similar Organizations (except Business, Professional, Labor, and Political Organizations) (5-9: 2, 1-4: 1)
Accommodation and Food Services: Full-Service Restaurants (5-9: 1, 1-4: 2)
Construction: Plumbing, Heating, and Air-Conditioning Contractors (5-9: 1)
Construction: Residential Remodelers (1-4: 1)
Construction: New Housing Operative Builders (1-4: 1)
People in group quarters in 2010:
39 people in other noninstitutional facilities
People in group quarters in 2000:
45 people in other nonhousehold living situations
Fatal accident statistics in 2014:
Fatal accident count: 1
Vehicles involved in fatal accidents: 1
Fatal accidents caused by drunken drivers: 1
Fatalities: 1
Persons involved in fatal accidents: 2
Pedestrians involved in fatal accidents: 0
Home Mortgage Disclosure Act Aggregated Statistics For Year 2009 (Based on 6 partial tracts)
A) FHA, FSA/RHS & VA Home Purchase Loans
B) Conventional Home Purchase Loans
C) Refinancings
D) Home Improvement Loans
F) Non-occupant Loans on < 5 Family Dwellings (A B C & D)
G) Loans On Manufactured Home Dwelling (A B C & D)
Number
Average Value
Number
Average Value
Number
Average Value
Number
Average Value
Number
Average Value
Number
Average Value
LOANS ORIGINATED
3
$247,760
17
$166,201
69
$210,383
2
$157,175
35
$180,213
2
$117,920
APPLICATIONS APPROVED, NOT ACCEPTED
1
$116,610
2
$167,645
6
$285,712
0
$0
3
$227,890
1
$95,090
APPLICATIONS DENIED
1
$116,610
3
$159,457
22
$230,525
2
$117,485
7
$193,174
0
$0
APPLICATIONS WITHDRAWN
1
$205,600
3
$315,810
13
$218,033
1
$133,190
5
$171,048
1
$83,460
FILES CLOSED FOR INCOMPLETENESS
0
$0
0
$0
3
$229,440
1
$61,070
0
$0
0
$0
Aggregated Statistics For Year 2008 (Based on 6 partial tracts)
A) FHA, FSA/RHS & VA Home Purchase Loans
B) Conventional Home Purchase Loans
C) Refinancings
D) Home Improvement Loans
F) Non-occupant Loans on < 5 Family Dwellings (A B C & D)
G) Loans On Manufactured Home Dwelling (A B C & D)
Number
Average Value
Number
Average Value
Number
Average Value
Number
Average Value
Number
Average Value
Number
Average Value
LOANS ORIGINATED
2
$220,570
28
$210,103
39
$195,186
2
$100,470
27
$172,757
2
$119,230
APPLICATIONS APPROVED, NOT ACCEPTED
0
$0
2
$201,960
3
$264,627
0
$0
2
$160,810
0
$0
APPLICATIONS DENIED
1
$79,680
4
$232,130
20
$209,376
3
$105,753
6
$162,993
0
$0
APPLICATIONS WITHDRAWN
0
$0
3
$120,973
10
$219,292
1
$33,440
3
$198,033
0
$0
FILES CLOSED FOR INCOMPLETENESS
0
$0
0
$0
2
$255,320
1
$50,890
1
$85,500
0
$0
Aggregated Statistics For Year 2007 (Based on 6 partial tracts)
A) FHA, FSA/RHS & VA Home Purchase Loans
B) Conventional Home Purchase Loans
C) Refinancings
D) Home Improvement Loans
F) Non-occupant Loans on < 5 Family Dwellings (A B C & D)
G) Loans On Manufactured Home Dwelling (A B C & D)
Number
Average Value
Number
Average Value
Number
Average Value
Number
Average Value
Number
Average Value
Number
Average Value
LOANS ORIGINATED
1
$275,970
37
$187,794
45
$202,584
5
$78,516
33
$182,332
3
$134,157
APPLICATIONS APPROVED, NOT ACCEPTED
0
$0
3
$176,223
11
$236,632
2
$69,065
2
$132,605
0
$0
APPLICATIONS DENIED
1
$119,810
6
$147,435
27
$213,598
3
$75,220
7
$164,469
1
$178,550
APPLICATIONS WITHDRAWN
0
$0
3
$240,297
10
$180,441
1
$172,440
4
$139,512
0
$0
FILES CLOSED FOR INCOMPLETENESS
0
$0
1
$317,260
3
$294,580
0
$0
0
$0
0
$0
Aggregated Statistics For Year 2006 (Based on 6 partial tracts)
A) FHA, FSA/RHS & VA Home Purchase Loans
B) Conventional Home Purchase Loans
C) Refinancings
D) Home Improvement Loans
F) Non-occupant Loans on < 5 Family Dwellings (A B C & D)
G) Loans On Manufactured Home Dwelling (A B C & D)
Number
Average Value
Number
Average Value
Number
Average Value
Number
Average Value
Number
Average Value
Number
Average Value
LOANS ORIGINATED
1
$83,170
53
$184,965
53
$180,532
6
$56,608
39
$173,436
1
$77,930
APPLICATIONS APPROVED, NOT ACCEPTED
0
$0
4
$361,392
8
$246,708
1
$56,710
3
$308,343
0
$0
APPLICATIONS DENIED
1
$92,470
11
$252,441
33
$238,430
2
$156,450
8
$167,210
3
$166,143
APPLICATIONS WITHDRAWN
0
$0
7
$287,809
16
$186,003
1
$44,490
3
$156,450
0
$0
FILES CLOSED FOR INCOMPLETENESS
0
$0
1
$259,390
3
$293,803
0
$0
0
$0
0
$0
Aggregated Statistics For Year 2005 (Based on 6 partial tracts)
A) FHA, FSA/RHS & VA Home Purchase Loans
B) Conventional Home Purchase Loans
C) Refinancings
D) Home Improvement Loans
F) Non-occupant Loans on < 5 Family Dwellings (A B C & D)
G) Loans On Manufactured Home Dwelling (A B C & D)
Number
Average Value
Number
Average Value
Number
Average Value
Number
Average Value
Number
Average Value
Number
Average Value
LOANS ORIGINATED
1
$97,420
49
$178,866
70
$196,319
7
$92,141
35
$163,023
2
$125,625
APPLICATIONS APPROVED, NOT ACCEPTED
0
$0
5
$188,380
8
$243,509
1
$44,780
5
$181,402
1
$51,180
APPLICATIONS DENIED
1
$138,130
10
$219,380
39
$212,038
6
$111,667
6
$165,805
2
$223,915
APPLICATIONS WITHDRAWN
0
$0
7
$172,444
17
$215,825
1
$148,020
5
$171,804
1
$47,110
FILES CLOSED FOR INCOMPLETENESS
0
$0
1
$290,800
7
$252,789
0
$0
1
$177,100
0
$0
Aggregated Statistics For Year 2004 (Based on 6 partial tracts)
A) FHA, FSA/RHS & VA Home Purchase Loans
B) Conventional Home Purchase Loans
C) Refinancings
D) Home Improvement Loans
F) Non-occupant Loans on < 5 Family Dwellings (A B C & D)
G) Loans On Manufactured Home Dwelling (A B C & D)
Number
Average Value
Number
Average Value
Number
Average Value
Number
Average Value
Number
Average Value
Number
Average Value
LOANS ORIGINATED
1
$109,050
45
$177,427
81
$189,914
7
$69,419
35
$155,046
3
$145,207
APPLICATIONS APPROVED, NOT ACCEPTED
0
$0
8
$198,252
10
$210,801
1
$104,110
3
$304,760
1
$118,940
APPLICATIONS DENIED
0
$0
13
$190,385
46
$201,025
3
$75,997
8
$202,869
3
$80,650
APPLICATIONS WITHDRAWN
0
$0
5
$164,476
26
$210,886
0
$0
5
$138,538
1
$88,110
FILES CLOSED FOR INCOMPLETENESS
0
$0
1
$100,040
6
$266,857
0
$0
0
$0
0
$0
Aggregated Statistics For Year 2003 (Based on 6 partial tracts)
A) FHA, FSA/RHS & VA Home Purchase Loans
B) Conventional Home Purchase Loans
C) Refinancings
D) Home Improvement Loans
F) Non-occupant Loans on < 5 Family Dwellings (A B C & D)
Number
Average Value
Number
Average Value
Number
Average Value
Number
Average Value
Number
Average Value
LOANS ORIGINATED
1
$225,370
36
$178,010
170
$183,799
4
$41,148
48
$162,521
APPLICATIONS APPROVED, NOT ACCEPTED
0
$0
7
$151,714
18
$166,936
1
$56,420
3
$127,660
APPLICATIONS DENIED
0
$0
10
$163,662
46
$191,820
3
$22,293
7
$129,489
APPLICATIONS WITHDRAWN
0
$0
4
$195,055
32
$175,125
1
$122,140
4
$120,028
FILES CLOSED FOR INCOMPLETENESS
0
$0
1
$188,440
6
$161,685
0
$0
1
$119,230
Aggregated Statistics For Year 2002 (Based on 6 partial tracts)
A) FHA, FSA/RHS & VA Home Purchase Loans
B) Conventional Home Purchase Loans
C) Refinancings
D) Home Improvement Loans
F) Non-occupant Loans on < 5 Family Dwellings (A B C & D)
Number
Average Value
Number
Average Value
Number
Average Value
Number
Average Value
Number
Average Value
LOANS ORIGINATED
1
$245,140
44
$170,369
159
$179,680
7
$46,570
38
$151,828
APPLICATIONS APPROVED, NOT ACCEPTED
1
$85,790
6
$139,827
27
$184,701
1
$66,300
2
$170,990
APPLICATIONS DENIED
0
$0
7
$118,064
39
$176,165
2
$11,630
3
$170,990
APPLICATIONS WITHDRAWN
0
$0
3
$196,193
25
$170,130
1
$19,480
2
$83,460
FILES CLOSED FOR INCOMPLETENESS
0
$0
1
$418,750
11
$197,506
0
$0
0
$0
Aggregated Statistics For Year 2001 (Based on 6 partial tracts)
A) FHA, FSA/RHS & VA Home Purchase Loans
B) Conventional Home Purchase Loans
C) Refinancings
D) Home Improvement Loans
F) Non-occupant Loans on < 5 Family Dwellings (A B C & D)
Number
Average Value
Number
Average Value
Number
Average Value
Number
Average Value
Number
Average Value
LOANS ORIGINATED
3
$125,820
44
$150,185
129
$170,792
9
$36,059
29
$146,252
APPLICATIONS APPROVED, NOT ACCEPTED
0
$0
5
$227,870
15
$163,953
2
$46,820
2
$183,930
APPLICATIONS DENIED
1
$76,770
7
$115,364
34
$176,396
4
$32,205
3
$96,253
APPLICATIONS WITHDRAWN
0
$0
6
$105,608
19
$169,368
2
$37,220
2
$126,060
FILES CLOSED FOR INCOMPLETENESS
0
$0
2
$97,275
8
$178,806
1
$15,700
1
$29,370
Aggregated Statistics For Year 2000 (Based on 6 partial tracts)
A) FHA, FSA/RHS & VA Home Purchase Loans
B) Conventional Home Purchase Loans
C) Refinancings
D) Home Improvement Loans
F) Non-occupant Loans on < 5 Family Dwellings (A B C & D)
Number
Average Value
Number
Average Value
Number
Average Value
Number
Average Value
Number
Average Value
LOANS ORIGINATED
2
$144,820
48
$151,925
42
$144,915
13
$26,910
20
$127,821
APPLICATIONS APPROVED, NOT ACCEPTED
0
$0
5
$154,880
12
$124,729
1
$29,660
3
$105,753
APPLICATIONS DENIED
0
$0
12
$111,643
25
$149,483
7
$30,741
3
$82,780
APPLICATIONS WITHDRAWN
0
$0
4
$133,332
12
$141,983
1
$15,990
1
$104,400
FILES CLOSED FOR INCOMPLETENESS
0
$0
1
$191,350
5
$137,722
1
$36,350
1
$103,520
Aggregated Statistics For Year 1999 (Based on 3 partial tracts)
A) FHA, FSA/RHS & VA Home Purchase Loans
B) Conventional Home Purchase Loans
C) Refinancings
D) Home Improvement Loans
F) Non-occupant Loans on < 5 Family Dwellings (A B C & D)
Detailed PMIC statistics for the following Tracts:0024.00
2004 - 2018 National Fire Incident Reporting System (NFIRS) incidents
Based on the data from the years 2004 - 2018 the average number of fire incidents per year is 9. The highest number of fire incidents - 21 took place in 2012, and the least - 0 in 2008. The data has a growing trend.
When looking into fire subcategories, the most reports belonged to: Mobile Property/Vehicle Fires (60.9%), and Structure Fires (24.2%).
Fire incident types reported to NFIRS in Zip Code 80545


 Nearest zip codes: 82084, 80512, 80536, 82063, 82070, 82052.


 Based on the data from the years 2004 - 2018 the average number of fire incidents per year is 9. The highest number of fire incidents - 21 took place in 2012, and the least - 0 in 2008. The data has a growing trend.
 When looking into fire subcategories, the most reports belonged to: Mobile Property/Vehicle Fires (60.9%), and Structure Fires (24.2%).