Estimated zip code population in 2022: 518 Zip code population in 2010: 706 Zip code population in 2000: 491
Houses and condos: 512 Renter-occupied apartments: 34
% of renters here:
17%
State:
34%
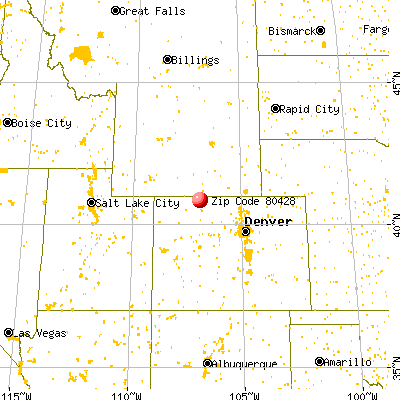
March 2022 cost of living index in zip code 80428: 90.9 (less than average, U.S. average is 100)
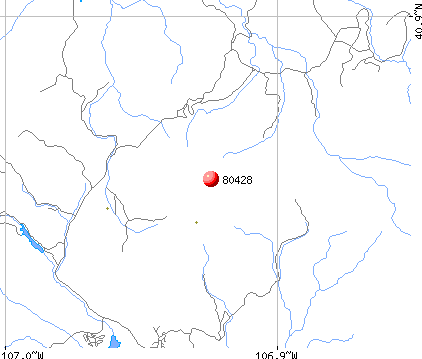
Land area: 308.3 sq. mi. Water area: 2.0 sq. mi.
Population density: 2 people per square mile
(very low).
OSM Map
General Map
Google Map
MSN Map
OSM Map
General Map
Google Map
MSN Map
OSM Map
General Map
Google Map
MSN Map
OSM Map
General Map
Google Map
MSN Map
Please wait while loading the map...
Real estate property taxes paid for housing units in 2022:
This zip code:
0.2% ($1,927)
Colorado:
0.5% ($2,422)
Median real estate property taxes paid for housing units with mortgages in 2022: $1,761 (0.2%) Median real estate property taxes paid for housing units with no mortgage in 2022: $3,755 (0.4%)
Business Search- 14 Million verified businesses
Males: 325
(62.9%)
Females: 192
(37.1%)
For population 25 years and over in 80428:
High school or higher: 92.5%
Bachelor's degree or higher: 30.1%
Graduate or professional degree: 13.4%
Mean travel time to work (commute): 37.9 minutes
For population 15 years and over in 80428:
Never married: 16.9%
Now married: 59.6%
Separated: 0.0%
Widowed: 2.0%
Divorced: 21.5%
Zip code 80428 compared to state average:
Median household income significantly below state average.
Unemployed percentage significantly below state average.
Black race population percentage significantly below state average.
Median age below state average.
Foreign-born population percentage significantly below state average.
Renting percentage below state average.
Length of stay since moving in significantly below state average.
Number of rooms per house below state average.
House age below state average.
Number of college students significantly below state average.
Percentage of population with a bachelor's degree or higher below state average.
Estimated median house/condo value in 2022: $772,084
80428:
$772,084
Colorado:
$531,100
Median resident age:
This zip code:
31.8 years
Colorado median age:
37.7 years
Average household size:
This zip code:
2.5 people
Colorado:
2.4 people
Averages for the 2020 tax year for zip code 80428, filed in 2021:
Average Adjusted Gross Income (AGI) in 2020: $87,762 (Individual Income Tax Returns)
Here:
$87,762
State:
$89,260
Salary/wage: $68,342 (reported on 79.5% of returns)
Here:
$68,342
State:
$70,330
(% of AGI for various income ranges: 1551.4% for AGIs below $25k, 3422.0% for AGIs $25k-50k, 7360.0% for AGIs $50k-75k, 10923.3% for AGIs $75k-100k, 13624.0% for AGIs $100k-200k)
Taxable interest for individuals: $1,605 (reported on 48.7% of returns)
This zip code:
$1,605
Colorado:
$2,176
(% of AGI for various income ranges: 15.7% for AGIs below $25k, 18.0% for AGIs $25k-50k, 106.7% for AGIs $50k-75k, 33.3% for AGIs $75k-100k, 126.0% for AGIs $100k-200k)
Ordinary dividends: $9,943 (reported on 35.9% of returns)
Here:
$9,943
State:
$8,820
(% of AGI for various income ranges: 220.0% for AGIs below $25k, 353.3% for AGIs $50k-75k, 384.0% for AGIs $100k-200k)
Net capital gain/loss in AGI: +$22,460 (reported on 38.5% of returns)
Here:
+$22,460
State:
+$37,276
(% of AGI for various income ranges: 25.7% for AGIs below $25k, 140.0% for AGIs $25k-50k, 366.7% for AGIs $50k-75k, 796.0% for AGIs $100k-200k)
Profit/loss from business: +$14,267 (reported on 23.1% of returns)
Here:
+$14,267
State:
+$15,295
(% of AGI for various income ranges: 698.6% for AGIs below $25k, 2350.0% for AGIs $50k-75k, 180.0% for AGIs $100k-200k)
Taxable individual retirement arrangement distribution: $21,217 (reported on 15.4% of returns)
80428:
$21,217
Colorado:
$23,785
(% of AGI for various income ranges: 852.0% for AGIs $25k-50k, 1694.0% for AGIs $100k-200k)
Total itemized deductions: $34,375 (reported on 10.3% of returns)
Here:
$34,375
State:
$35,141
(% of AGI for various income ranges: 2750.0% for AGIs $100k-200k)
Charity contributions: $8,100 (reported on 7.7% of returns)
Here:
$8,100
State:
$12,103
(% of AGI for various income ranges: 486.0% for AGIs $100k-200k)
Taxes paid: $8,225 (reported on 10.3% of returns)
80428:
$8,225
State:
$7,710
(% of AGI for various income ranges: 658.0% for AGIs $100k-200k)
Earned income credit: $1,933 (reported on 7.7% of returns)
Here:
$1,933
State:
$2,053
(% of AGI for various income ranges: 82.9% for AGIs below $25k)
Percentage of individuals using paid preparers for their 2020 taxes: 94.9%
Here:
95%
State:
93%
(% for various income ranges: 90.9% for AGIs below $25k, 100.0% for AGIs $25k-50k, 100.0% for AGIs $50k-75k, 100.0% for AGIs $75k-100k, 100.0% for AGIs $100k-200k, 75.0% for AGIs over 200k)
Averages for the 2012 tax year for zip code 80428, filed in 2013:
Average Adjusted Gross Income (AGI) in 2012: $67,025 (Individual Income Tax Returns)
Here:
$67,025
State:
$69,103
Salary/wage: $46,219 (reported on 75.0% of returns)
Here:
$46,219
State:
$54,794
(% of AGI for various income ranges: 64.4% for AGIs below $25k, 66.6% for AGIs $25k-50k, 62.8% for AGIs $50k-75k, 63.0% for AGIs $75k-100k, 40.6% for AGIs $100k-200k)
Taxable interest for individuals: $1,146 (reported on 46.4% of returns)
This zip code:
$1,146
Colorado:
$1,971
(% of AGI for various income ranges: 1.2% for AGIs below $25k, 0.4% for AGIs $25k-50k, 0.4% for AGIs $50k-75k, 0.4% for AGIs $75k-100k, 1.1% for AGIs $100k-200k)
Ordinary dividends: $6,760 (reported on 35.7% of returns)
Here:
$6,760
State:
$7,140
(% of AGI for various income ranges: 5.6% for AGIs below $25k, 7.7% for AGIs $50k-75k, 4.1% for AGIs $100k-200k)
Net capital gain/loss in AGI: +$18,444 (reported on 32.1% of returns)
Here:
+$18,444
State:
+$23,009
(% of AGI for various income ranges: 0.2% for AGIs below $25k, 16.9% for AGIs $100k-200k)
Profit/loss from business: +$15,586 (reported on 25.0% of returns)
Here:
+$15,586
State:
+$13,514
(% of AGI for various income ranges: 14.5% for AGIs below $25k, 18.1% for AGIs $25k-50k, 20.0% for AGIs $50k-75k)
Taxable individual retirement arrangement distribution: $22,400 (reported on 14.3% of returns)
80428:
$22,400
Colorado:
$17,927
Total itemized deductions: $28,915 (28% of AGI, reported on 46.4% of returns)
Here:
$28,915
State:
$24,621
Here:
28.2% of AGI
State:
18.5% of AGI
(% of AGI for various income ranges: 22.1% for AGIs $25k-50k, 18.6% for AGIs $50k-75k, 21.4% for AGIs $75k-100k, 21.7% for AGIs $100k-200k)
Charity contributions: $5,256 (reported on 32.1% of returns)
Here:
$5,256
State:
$4,449
Taxes paid: $6,723 (reported on 46.4% of returns)
80428:
$6,723
State:
$7,641
(% of AGI for various income ranges: 3.7% for AGIs $25k-50k, 3.4% for AGIs $50k-75k, 4.9% for AGIs $75k-100k, 5.6% for AGIs $100k-200k)
Earned income credit: $1,367 (reported on 10.7% of returns)
Here:
$1,367
State:
$2,095
(% of AGI for various income ranges: 3.9% for AGIs below $25k)
Percentage of individuals using paid preparers for their 2012 taxes: 60.7%
Here:
61%
State:
49%
(% for various income ranges: 50.0% for AGIs below $25k, 66.7% for AGIs $25k-50k, 100.0% for AGIs $50k-75k, 66.7% for AGIs $100k-200k)
Averages for the 2004 tax year for zip code 80428, filed in 2005:
Average Adjusted Gross Income (AGI) in 2004: $54,072 (Individual Income Tax Returns)
Here:
$54,072
State:
$55,014
Salary/wage: $41,132 (reported on 82.3% of returns)
Here:
$41,132
State:
$46,010
(% of AGI for various income ranges: 123.8% for AGIs below $10k, 74.8% for AGIs $10k-25k, 79.0% for AGIs $25k-50k, 73.6% for AGIs $50k-75k, 59.1% for AGIs $75k-100k, 49.7% for AGIs over 100k)
Taxable interest for individuals: $1,141 (reported on 51.3% of returns)
This zip code:
$1,141
Colorado:
$2,127
(% of AGI for various income ranges: 9.5% for AGIs below $10k, 2.9% for AGIs $10k-25k, 0.2% for AGIs $25k-50k, 0.9% for AGIs $50k-75k, 1.5% for AGIs $75k-100k, 0.8% for AGIs over 100k)
Taxable dividends: $3,265 (reported on 36.8% of returns)
Here:
$3,265
State:
$3,782
(% of AGI for various income ranges: 53.2% for AGIs below $10k, 3.1% for AGIs $10k-25k, 1.3% for AGIs $25k-50k, 0.7% for AGIs $50k-75k, 0.9% for AGIs $75k-100k, 2.6% for AGIs over 100k)
Net capital gain/loss: +$16,329 (reported on 28.5% of returns)
Here:
+$16,329
State:
+$17,882
(% of AGI for various income ranges: 3.3% for AGIs $10k-25k, -0.3% for AGIs $25k-50k, 0.8% for AGIs $50k-75k, 0.2% for AGIs $75k-100k, 19.9% for AGIs over 100k)
Profit/loss from business: +$7,269 (reported on 24.2% of returns)
Here:
+$7,269
State:
+$11,247
(% of AGI for various income ranges: 41.3% for AGIs below $10k, 15.1% for AGIs $10k-25k, 9.1% for AGIs $25k-50k, 1.8% for AGIs $50k-75k, 1.0% for AGIs $75k-100k)
IRA payment deduction: $3,385 (reported on 4.7% of returns)
80428:
$3,385
Colorado:
$2,947
Total itemized deductions: $22,112 (24% of AGI, reported on 38.6% of returns)
Here:
$22,112
State:
$20,560
Here:
23.8% of AGI
State:
21.4% of AGI
(% of AGI for various income ranges: 17.9% for AGIs $10k-25k, 13.0% for AGIs $25k-50k, 17.8% for AGIs $50k-75k, 19.1% for AGIs $75k-100k, 14.5% for AGIs over 100k)
Charity contributions deductions: $2,342 (2% of AGI, reported on 28.5% of returns)
Here:
$2,342
State:
$3,518
Here:
2.2% of AGI
State:
3.4% of AGI
(% of AGI for various income ranges: 0.4% for AGIs $25k-50k, 0.7% for AGIs $50k-75k, 1.8% for AGIs $75k-100k, 1.8% for AGIs over 100k)
Total tax: $7,804 (reported on 84.8% of returns)
80428:
$7,804
State:
$9,173
(% of AGI for various income ranges: 8.7% for AGIs below $10k, 6.9% for AGIs $10k-25k, 8.6% for AGIs $25k-50k, 8.9% for AGIs $50k-75k, 10.0% for AGIs $75k-100k, 17.0% for AGIs over 100k)
Earned income credit: $933 (reported on 5.4% of returns)
Here:
$933
State:
$1,595
Percentage of individuals using paid preparers for their 2004 taxes: 60.3%
Here:
60%
State:
55%
(% for various income ranges: 51.9% for AGIs below $10k, 63.8% for AGIs $10k-25k, 55.7% for AGIs $25k-50k, 55.3% for AGIs $50k-75k, 72.4% for AGIs $75k-100k, 75.0% for AGIs over 100k)
Household received Food Stamps/SNAP in the past 12 months: 34 Household did not receive Food Stamps/SNAP in the past 12 months: 162
Women who had a birth in the past 12 months: 22 (23 now married, 0 unmarried) Women who did not have a birth in the past 12 months: 87 (46 now married, 40 unmarried)
Housing units in zip code 80428 with a mortgage: 124 (8 second mortgage, 8 both second mortgage and home equity loan) Houses without a mortgage: 14
Median monthly owner costs for units with a mortgage: $1,696 Median monthly owner costs for units without a mortgage: $1,083
Residents with income below the poverty level in 2022:
This zip code:
37.7%
Whole state:
9.4%
Residents with income below 50% of the poverty level in 2022:
This zip code:
30.8%
Whole state:
4.6%
Median number of rooms in houses and condos:
Here:
4.8
State:
6.8
Notable locations in this zip code not listed on our city pages
Notable locations in zip code 80428: Three Forks Ranch (A), Summit Creek Guard Station (B), Hahns Peak (C), Jolley Ranch (D), Middle Fork Campground (E), Seedhouse Campground (F), Poverty Bar Campground (G), Gold Pan Campground (H), Placer Cove Picnic Area (I), Sunrise Vista Campground (J), Dutch Hill Campground (K), Hahns Peak Lookout (L), Bootjack Ranch (M), Hahns Peak Lake Campground (N), Hinman Campground (O), Coulton Creek Campground (P), Steamboat Lake State Park Headquarters (Q), North Routt Fire Protection District Station 1 (R), North Routt Fire Protection District Station 2 (S). Display/hide their locations on the map
Lakes and reservoirs: Willow Creek Lake (A), Hinman Lake (B), Farwell Lake (C), Steamboat Lake (D), McCargar Reservoir (E), Hahns Peak Lake (F), Pearl Lake (G). Display/hide their locations on the map
Streams, rivers, and creeks: Spring Creek (A), King Solomon Creek (B), Roaring Fork (C), North Fork Little Snake River (D), Middle Fork Little Snake River (E), Dudley Creek (F), Box Creek (G), Smith Creek (H), South Fork Little Snake River (I). Display/hide their locations on the map
In group quarters: 24 (-1 institutionalized population)
Size of family households: 42 2-persons, 22 3-persons, 23 4-persons, 10 6-persons
Size of nonfamily households: 71 1-person, 27 2-persons
94 married couples with children.
60 single-parent households (60 women).
99.3% of residents of 80428 zip code speak English at home.
Foreign born population: 0 (0.0%)
:
0.0%
Whole state:
9.5%
14%German
14%Irish
12%English
10%Swedish
7%Polish
Housing units lacking complete plumbing facilities: 4.7% Housing units lacking complete kitchen facilities: 8.1%
36.7%Bottled, tank, or LP gas
34.5%Wood
25.9%Electricity
3.8%Utility gas
Population in 1990: 455. Population change in the 1990s: +36 (+7.9%).
Place of birth for U.S.-born residents:
This state: 292
Northeast: 8
Midwest: 101
South: 85
West: 29
35% of the 80428 zip code residents lived in the same house 5 years ago. Out of people who lived in different houses, 26% lived in this county. Out of people who lived in different counties, 50% lived in Colorado.
75% of the 80428 zip code residents lived in the same house 1 year ago. Out of people who lived in different houses, 45% moved from this county. Out of people who lived in different houses, 49% moved from different state.
Private vs. public school enrollment:
Students in private schools in grades 1 to 8 (elementary and middle school):
Here:
0.0%
Colorado:
11.4%
Students in private schools in grades 9 to 12 (high school): 6
Here:
42.2%
Colorado:
8.5%
Occupation by median earnings in the past 12 months ($)
138,768Management occupations
107,864Construction and extraction occupations
Top industries in this zip code by the number of employees in 2005:
Construction: New Single-Family Housing Construction (except Operative Builders) (20-49 employees: 1 establishment, 5-9 employees: 1 establishment, 1-4 employees: 7 establishments)
Accommodation and Food Services: Hotels (except Casino Hotels) and Motels (20-49: 1, 1-4: 1)
Accommodation and Food Services: Recreational and Vacation Camps (except Campgrounds) (20-49: 1)
Accommodation and Food Services: Full-Service Restaurants (10-19: 1, 5-9: 1)
Arts, Entertainment, and Recreation: All Other Amusement and Recreation Industries (10-19: 1)
Other Services (except Public Administration): Other Similar Organizations (except Business, Professional, Labor, and Political Organizations) (5-9: 1)
Professional, Scientific, and Technical Services: Administrative Management and General Management Consulting Services (1-4: 2)
Health Care and Social Assistance: Child Day Care Services (1-4: 1)
Fatal accident statistics in 2010:
Fatal accident count: 1
Vehicles involved in fatal accidents: 1
Fatal accidents caused by drunken drivers: 0
Fatalities: 1
Persons involved in fatal accidents: 1
Pedestrians involved in fatal accidents: 1
2004 - 2018 National Fire Incident Reporting System (NFIRS) incidents
Based on the data from the years 2004 - 2018 the average number of fire incidents per year is 8. The highest number of reported fires - 19 took place in 2015, and the least - 0 in 2011. The data has a rising trend.
When looking into fire subcategories, the most incidents belonged to: Outside Fires (63.6%), and Structure Fires (28.1%).
Fire incident types reported to NFIRS in Zip Code 80428


 Nearest zip codes: 80487, 81653, 80477, 82332, 80488, 82325.


 Based on the data from the years 2004 - 2018 the average number of fire incidents per year is 8. The highest number of reported fires - 19 took place in 2015, and the least - 0 in 2011. The data has a rising trend.
 When looking into fire subcategories, the most incidents belonged to: Outside Fires (63.6%), and Structure Fires (28.1%).