Estimated zip code population in 2022: 2,719 Zip code population in 2010: 3,528 Zip code population in 2000: 3,643
Houses and condos: 1,537 Renter-occupied apartments: 252
% of renters here:
21%
State:
38%
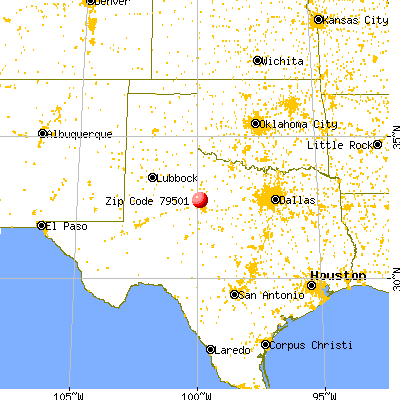
March 2022 cost of living index in zip code 79501: 78.4 (low, U.S. average is 100)
Land area: 199.1 sq. mi. Water area: 1.1 sq. mi.
Population density: 14 people per square mile
(very low).
OSM Map
General Map
Google Map
MSN Map
OSM Map
General Map
Google Map
MSN Map
OSM Map
General Map
Google Map
MSN Map
OSM Map
General Map
Google Map
MSN Map
Please wait while loading the map...
Real estate property taxes paid for housing units in 2022:
This zip code:
1.4% ($1,356)
Texas:
1.5% ($4,050)
Median real estate property taxes paid for housing units with mortgages in 2022: $1,364 (1.5%) Median real estate property taxes paid for housing units with no mortgage in 2022: $1,384 (1.3%)
Averages for the 2020 tax year for zip code 79501, filed in 2021:
Average Adjusted Gross Income (AGI) in 2020: $52,744 (Individual Income Tax Returns)
Here:
$52,744
State:
$77,054
Salary/wage: $46,788 (reported on 85.0% of returns)
Here:
$46,788
State:
$62,766
(% of AGI for various income ranges: 1251.8% for AGIs below $25k, 3489.5% for AGIs $25k-50k, 6151.1% for AGIs $50k-75k, 10415.0% for AGIs $75k-100k, 15877.0% for AGIs $100k-200k)
Taxable interest for individuals: $659 (reported on 18.4% of returns)
This zip code:
$659
Texas:
$2,665
(% of AGI for various income ranges: 9.0% for AGIs below $25k, 9.5% for AGIs $25k-50k, 20.6% for AGIs $50k-75k, 6.2% for AGIs $75k-100k, 19.0% for AGIs $100k-200k)
Ordinary dividends: $3,633 (reported on 8.2% of returns)
Here:
$3,633
State:
$10,044
(% of AGI for various income ranges: 13.2% for AGIs $25k-50k, 68.3% for AGIs $50k-75k, 263.0% for AGIs $100k-200k)
Net capital gain/loss in AGI: +$10,629 (reported on 9.5% of returns)
Here:
+$10,629
State:
+$39,590
(% of AGI for various income ranges: 28.9% for AGIs $25k-50k, 61.7% for AGIs $50k-75k, 217.5% for AGIs $75k-100k, 1093.0% for AGIs $100k-200k)
Profit/loss from business: +$10,215 (reported on 18.4% of returns)
Here:
+$10,215
State:
+$10,888
(% of AGI for various income ranges: 149.0% for AGIs below $25k, 55.8% for AGIs $25k-50k, 115.6% for AGIs $50k-75k, 360.0% for AGIs $75k-100k, 1469.0% for AGIs $100k-200k)
Taxable individual retirement arrangement distribution: $13,638 (reported on 5.4% of returns)
79501:
$13,638
Texas:
$24,740
(% of AGI for various income ranges: 27.4% for AGIs below $25k, 79.2% for AGIs $25k-50k, 853.8% for AGIs $75k-100k)
Total itemized deductions: $42,850 (reported on 2.7% of returns)
Here:
$42,850
State:
$40,428
(% of AGI for various income ranges: 169.2% for AGIs $25k-50k, 1071.0% for AGIs $100k-200k)
Charity contributions: $16,350 (reported on 2.7% of returns)
Here:
$16,350
State:
$18,201
(% of AGI for various income ranges: 654.0% for AGIs $100k-200k)
Taxes paid: $4,800 (reported on 2.7% of returns)
79501:
$4,800
State:
$7,821
(% of AGI for various income ranges: 192.0% for AGIs $100k-200k)
Earned income credit: $2,530 (reported on 22.4% of returns)
Here:
$2,530
State:
$2,584
(% of AGI for various income ranges: 117.4% for AGIs below $25k, 99.2% for AGIs $25k-50k)
Percentage of individuals using paid preparers for their 2020 taxes: 94.6%
Here:
95%
State:
92%
(% for various income ranges: 94.1% for AGIs below $25k, 95.3% for AGIs $25k-50k, 100.0% for AGIs $50k-75k, 91.7% for AGIs $75k-100k, 93.8% for AGIs $100k-200k, 66.7% for AGIs over 200k)
Averages for the 2012 tax year for zip code 79501, filed in 2013:
Average Adjusted Gross Income (AGI) in 2012: $45,276 (Individual Income Tax Returns)
Here:
$45,276
State:
$65,384
Salary/wage: $37,123 (reported on 84.7% of returns)
Here:
$37,123
State:
$52,524
(% of AGI for various income ranges: 81.7% for AGIs below $25k, 82.7% for AGIs $25k-50k, 76.7% for AGIs $50k-75k, 80.8% for AGIs $75k-100k, 47.5% for AGIs $100k-200k)
Taxable interest for individuals: $879 (reported on 20.1% of returns)
This zip code:
$879
Texas:
$2,372
(% of AGI for various income ranges: 0.5% for AGIs below $25k, 0.3% for AGIs $25k-50k, 0.5% for AGIs $50k-75k, 0.1% for AGIs $75k-100k, 0.4% for AGIs $100k-200k)
Ordinary dividends: $1,492 (reported on 8.3% of returns)
Here:
$1,492
State:
$9,721
(% of AGI for various income ranges: 0.2% for AGIs below $25k, 0.3% for AGIs $25k-50k, 0.3% for AGIs $50k-75k, 0.4% for AGIs $100k-200k)
Net capital gain/loss in AGI: +$11,950 (reported on 6.9% of returns)
Here:
+$11,950
State:
+$35,319
(% of AGI for various income ranges: 0.3% for AGIs below $25k, 0.2% for AGIs $25k-50k, 0.2% for AGIs $50k-75k, 5.1% for AGIs $100k-200k)
Profit/loss from business: +$7,963 (reported on 18.8% of returns)
Here:
+$7,963
State:
+$13,732
(% of AGI for various income ranges: 6.8% for AGIs below $25k, 2.3% for AGIs $25k-50k, 2.5% for AGIs $50k-75k, 3.5% for AGIs $75k-100k, 3.0% for AGIs $100k-200k)
Taxable individual retirement arrangement distribution: $13,922 (reported on 6.2% of returns)
79501:
$13,922
Texas:
$19,511
(% of AGI for various income ranges: 2.5% for AGIs below $25k, 0.7% for AGIs $25k-50k, 2.0% for AGIs $50k-75k, 7.6% for AGIs $75k-100k)
Total itemized deductions: $20,658 (19% of AGI, reported on 13.2% of returns)
Here:
$20,658
State:
$24,724
Here:
19.2% of AGI
State:
15.9% of AGI
(% of AGI for various income ranges: 3.8% for AGIs below $25k, 5.7% for AGIs $25k-50k, 6.3% for AGIs $50k-75k, 8.7% for AGIs $75k-100k, 5.7% for AGIs $100k-200k)
Charity contributions: $7,038 (reported on 9.0% of returns)
Here:
$7,038
State:
$6,808
(% of AGI for various income ranges: 1.1% for AGIs $25k-50k, 0.8% for AGIs $50k-75k, 2.7% for AGIs $75k-100k, 1.9% for AGIs $100k-200k)
Taxes paid: $3,342 (reported on 13.2% of returns)
79501:
$3,342
State:
$6,921
(% of AGI for various income ranges: 0.5% for AGIs below $25k, 0.7% for AGIs $25k-50k, 1.0% for AGIs $50k-75k, 1.1% for AGIs $75k-100k, 1.3% for AGIs $100k-200k)
Earned income credit: $2,440 (reported on 27.8% of returns)
Here:
$2,440
State:
$2,570
(% of AGI for various income ranges: 9.4% for AGIs below $25k, 1.5% for AGIs $25k-50k)
Percentage of individuals using paid preparers for their 2012 taxes: 60.4%
Here:
60%
State:
51%
(% for various income ranges: 56.2% for AGIs below $25k, 56.4% for AGIs $25k-50k, 73.7% for AGIs $50k-75k, 63.6% for AGIs $75k-100k, 72.7% for AGIs $100k-200k)
Averages for the 2004 tax year for zip code 79501, filed in 2005:
Average Adjusted Gross Income (AGI) in 2004: $30,603 (Individual Income Tax Returns)
Here:
$30,603
State:
$47,881
Salary/wage: $27,465 (reported on 84.5% of returns)
Here:
$27,465
State:
$41,947
(% of AGI for various income ranges: 148.8% for AGIs below $10k, 83.3% for AGIs $10k-25k, 81.3% for AGIs $25k-50k, 78.2% for AGIs $50k-75k, 72.9% for AGIs $75k-100k, 43.6% for AGIs over 100k)
Taxable interest for individuals: $1,504 (reported on 29.0% of returns)
This zip code:
$1,504
Texas:
$2,255
(% of AGI for various income ranges: 7.0% for AGIs below $10k, 1.9% for AGIs $10k-25k, 0.7% for AGIs $25k-50k, 1.7% for AGIs $50k-75k, 0.6% for AGIs $75k-100k, 1.7% for AGIs over 100k)
Taxable dividends: $1,491 (reported on 11.9% of returns)
Here:
$1,491
State:
$4,261
(% of AGI for various income ranges: 1.2% for AGIs below $10k, 0.2% for AGIs $10k-25k, 0.2% for AGIs $25k-50k, 1.0% for AGIs $50k-75k, 1.5% for AGIs $75k-100k, 0.3% for AGIs over 100k)
Net capital gain/loss: +$2,490 (reported on 10.3% of returns)
Here:
+$2,490
State:
+$16,110
(% of AGI for various income ranges: 8.5% for AGIs below $10k, -0.1% for AGIs $10k-25k, 0.4% for AGIs $25k-50k, 0.1% for AGIs $50k-75k, 3.1% for AGIs $75k-100k, 1.1% for AGIs over 100k)
Profit/loss from business: +$7,004 (reported on 18.0% of returns)
Here:
+$7,004
State:
+$11,013
(% of AGI for various income ranges: 5.5% for AGIs below $10k, 6.1% for AGIs $10k-25k, 4.1% for AGIs $25k-50k, 0.8% for AGIs $50k-75k, 11.3% for AGIs $75k-100k)
IRA payment deduction: $2,091 (reported on 1.6% of returns)
79501:
$2,091
Texas:
$3,120
Total itemized deductions: $16,512 (26% of AGI, reported on 11.4% of returns)
Here:
$16,512
State:
$19,631
Here:
26.0% of AGI
State:
18.9% of AGI
(% of AGI for various income ranges: 3.6% for AGIs $10k-25k, 6.1% for AGIs $25k-50k, 9.1% for AGIs $50k-75k, 7.1% for AGIs $75k-100k, 5.4% for AGIs over 100k)
Charity contributions deductions: $4,873 (7% of AGI, reported on 9.0% of returns)
Here:
$4,873
State:
$4,753
Here:
7.4% of AGI
State:
4.2% of AGI
(% of AGI for various income ranges: 0.5% for AGIs $10k-25k, 0.8% for AGIs $25k-50k, 1.6% for AGIs $50k-75k, 2.8% for AGIs $75k-100k, 2.6% for AGIs over 100k)
Total tax: $3,853 (reported on 63.6% of returns)
79501:
$3,853
State:
$9,058
(% of AGI for various income ranges: 4.2% for AGIs below $10k, 3.5% for AGIs $10k-25k, 6.0% for AGIs $25k-50k, 8.8% for AGIs $50k-75k, 10.8% for AGIs $75k-100k, 15.0% for AGIs over 100k)
Earned income credit: $1,910 (reported on 29.9% of returns)
Here:
$1,910
State:
$2,024
Percentage of individuals using paid preparers for their 2004 taxes: 68.1%
Here:
68%
State:
57%
(% for various income ranges: 67.9% for AGIs below $10k, 71.6% for AGIs $10k-25k, 65.7% for AGIs $25k-50k, 64.9% for AGIs $50k-75k, 53.1% for AGIs $75k-100k, 87.5% for AGIs over 100k)
Household received Food Stamps/SNAP in the past 12 months: 132 Household did not receive Food Stamps/SNAP in the past 12 months: 1,086
Women who had a birth in the past 12 months: 17 (10 now married, 6 unmarried) Women who did not have a birth in the past 12 months: 577 (324 now married, 251 unmarried)
Housing units in zip code 79501 with a mortgage: 394 (1 second mortgage, 2 both second mortgage and home equity loan) Median monthly owner costs for units with a mortgage: $1,040 Median monthly owner costs for units without a mortgage: $497
Residents with income below the poverty level in 2022:
This zip code:
12.2%
Whole state:
14.0%
Residents with income below 50% of the poverty level in 2022:
This zip code:
7.4%
Whole state:
7.4%
Median number of rooms in houses and condos:
Here:
5.4
State:
6.3
Median number of rooms in apartments:
Here:
5.3
State:
4.0
Notable locations in this zip code not listed on our city pages
Churches in zip code 79501 include: Pleasant Grove Church (A), Prairie View Church (B), Swans Chapel (C), Bethel Church (D), Church of Christ (E), Bethsadia Baptist Church (F), Iglesia DeCristo (G). Display/hide their locations on the map
In group quarters: 195 (-1 institutionalized population)
Size of family households: 301 2-persons, 227 3-persons, 93 4-persons, 69 5-persons, 33 6-persons, 28 7-or-more-persons
Size of nonfamily households: 431 1-person, 39 2-persons
428 married couples with children.
105 single-parent households (27 men, 78 women).
80.3% of residents of 79501 zip code speak English at home.
19.5% of residents speak Spanish at home (70% very well, 22% well, 5% not well, 3% not at all).
0.5% of residents speak other Indo-European language at home (100% very well).
0.4% of residents speak Asian or Pacific Island language at home (100% well).
Foreign born population: 150 (5.5%) (46.1% of them are naturalized citizens)
This zip code:
5.5%
Whole state:
17.2%
53%Honduras
17%Guatemala
7%Sweden
7%Thailand
3%Costa Rica
3%El Salvador
3%Uruguay
17%American
17%English
7%German
4%Irish
2%Scottish
1%British
1%Czech
Year of entry for the foreign-born population
342010 or later
382000 to 2009
491990 to 1999
54Before 1990
Facilities with environmental interests located in this zip code:
ANSON EL (922 AVE M in ANSON, TX)
(National Center for Education Statistics) - STATE ID-127901101 Organizations: ANSON ISD (SCHOOL DISTRICT)
ANSON H S (1509 S COMMERCIAL in ANSON, TX)
(National Center for Education Statistics) - STATE ID-127901001 Organizations: ANSON ISD (SCHOOL DISTRICT)
ANSON MIDDLE (1120 AVE M in ANSON, TX)
(National Center for Education Statistics) - STATE ID-127901041 Organizations: ANSON ISD (SCHOOL DISTRICT)
ANSON'S NEW HORIZONS INC (2428 CR 435 in ANSON, TX)
(Integrated Compliance Information System) - ICIS-06-1996-0017, FORMAL ENFORCEMENT ACTION Business SIC classification: CROP PLANTING, CULTIVATING, AND PROTECTING
ANSON'S NEW HORISONS INC (428 CR435 in ANSON, TX)
COMPLIANCE ACTIVITY (Tracking inspections of insecticide, fungicide, and rodenticide, and toxic substances)
Housing units lacking complete plumbing facilities: 8.6% Housing units lacking complete kitchen facilities: 11.1%
51.9%Electricity
36.6%Utility gas
8.5%Bottled, tank, or LP gas
1.5%Other fuel
1.2%Wood
Population in 1990: 3,724.
Place of birth for U.S.-born residents:
This state: 1,927
Northeast: 56
Midwest: 256
South: 154
West: 129
63% of the 79501 zip code residents lived in the same house 5 years ago. Out of people who lived in different houses, 55% lived in this county. Out of people who lived in different counties, 50% lived in Texas.
88% of the 79501 zip code residents lived in the same house 1 year ago. Out of people who lived in different houses, 51% moved from this county. Out of people who lived in different houses, 45% moved from different county within same state. Out of people who lived in different houses, 2% moved from different state.
Private vs. public school enrollment:
Students in private schools in grades 1 to 8 (elementary and middle school): 17
Here:
7.9%
Texas:
8.8%
Students in private schools in grades 9 to 12 (high school):
Here:
0.0%
Texas:
8.0%
Students in private undergraduate colleges: 60
Here:
86.4%
Texas:
16.2%
Occupation by median earnings in the past 12 months ($)
81,435Law enforcement workers including supervisors
68,849Production occupations
68,199Health diagnosing and treating practitioners and other technical occupations
55,245Community and social service occupations
54,289Installation, maintenance, and repair occupations
53,080Construction and extraction occupations
Top industries in this zip code by the number of employees in 2005:
Health Care and Social Assistance: General Medical and Surgical Hospitals (100-249 employees: 1 establishment)
Health Care and Social Assistance: Nursing Care Facilities (50-99: 1, 20-49: 1)
Health Care and Social Assistance: Child Day Care Services (10-19: 1, 5-9: 1)
Accommodation and Food Services: Limited-Service Restaurants (10-19: 1, 1-4: 1)
Finance and Insurance: Commercial Banking (10-19: 1)
People in group quarters in 2010:
39 people in nursing facilities/skilled-nursing facilities
17 people in local jails and other municipal confinement facilities
People in group quarters in 2000:
86 people in nursing homes
32 people in local jails and other confinement facilities (including police lockups)
Fatal accident statistics in 2014:
Fatal accident count: 2
Vehicles involved in fatal accidents: 2
Fatal accidents caused by drunken drivers: 1
Fatalities: 2
Persons involved in fatal accidents: 4
Pedestrians involved in fatal accidents: 0
Fatal accident statistics in 2013:
Fatal accident count: 2
Vehicles involved in fatal accidents: 2
Fatal accidents caused by drunken drivers: 0
Fatalities: 3
Persons involved in fatal accidents: 5
Pedestrians involved in fatal accidents: 1
2002 - 2011 National Fire Incident Reporting System (NFIRS) incidents
Based on the data from the years 2002 - 2011 the average number of fire incidents per year is 46. The highest number of fires - 88 took place in 2005, and the least - 2 in 2011. The data has a declining trend.
When looking into fire subcategories, the most incidents belonged to: Outside Fires (74.0%), and Structure Fires (13.1%).
Fire incident types reported to NFIRS in Zip Code 79501


 Nearest zip codes: 79525, 79553, 79503, 79520, 79601, 79548.


 Based on the data from the years 2002 - 2011 the average number of fire incidents per year is 46. The highest number of fires - 88 took place in 2005, and the least - 2 in 2011. The data has a declining trend.
 When looking into fire subcategories, the most incidents belonged to: Outside Fires (74.0%), and Structure Fires (13.1%).