Estimated zip code population in 2022: 7,375 Zip code population in 2010: 7,462 Zip code population in 2000: 6,515
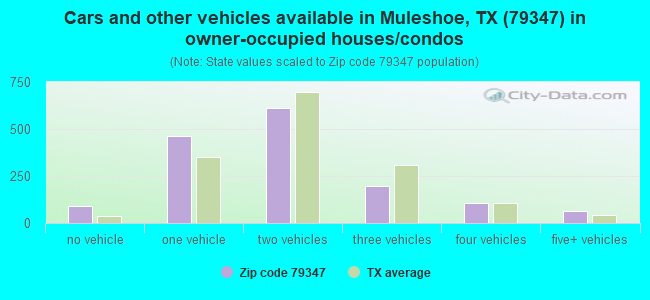
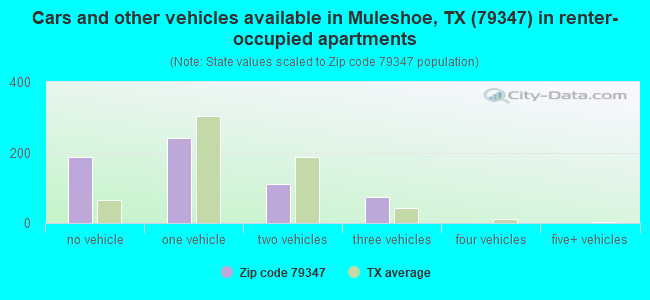
Houses and condos: 2,658 Renter-occupied apartments: 609
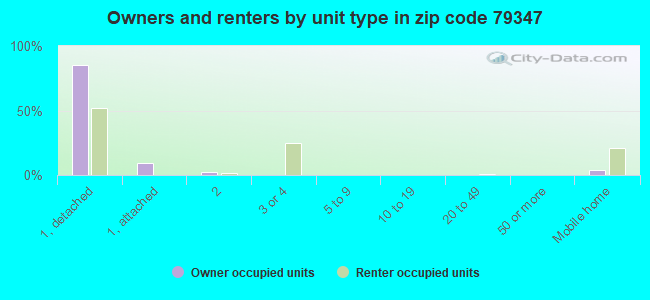
% of renters here:
29%
State:
38%
March 2022 cost of living index in zip code 79347: 74.9 (low, U.S. average is 100)
Land area: 706.6 sq. mi. Water area: 1.1 sq. mi.
Population density: 10 people per square mile
(very low).
OSM Map
General Map
Google Map
MSN Map
OSM Map
General Map
Google Map
MSN Map
OSM Map
General Map
Google Map
MSN Map
OSM Map
General Map
Google Map
MSN Map
Please wait while loading the map...
Real estate property taxes paid for housing units in 2022:
This zip code:
1.4% ($1,902)
Texas:
1.5% ($4,050)
Median real estate property taxes paid for housing units with mortgages in 2022: $2,095 (1.5%) Median real estate property taxes paid for housing units with no mortgage in 2022: $1,504 (1.3%)
Business Search- 14 Million verified businesses
Males: 3,495
(47.4%)
Females: 3,879
(52.6%)
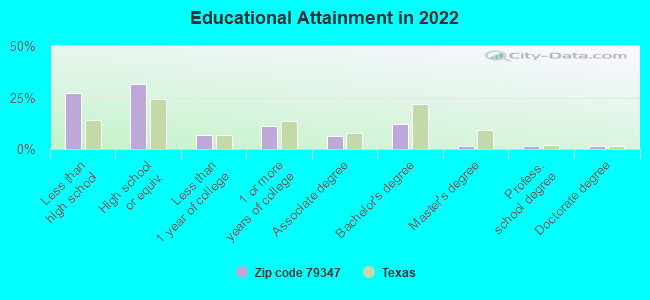
For population 25 years and over in 79347:
High school or higher: 70.9%
Bachelor's degree or higher: 16.5%
Graduate or professional degree: 4.7%
Unemployed: 1.7%
Mean travel time to work (commute): 19.1 minutes
For population 15 years and over in 79347:
Never married: 46.0%
Now married: 43.0%
Separated: 0.2%
Widowed: 4.8%
Divorced: 5.9%
Zip code 79347 compared to state average:
Median house value below state average.
Unemployed percentage below state average.
Black race population percentage significantly below state average.
Median age below state average.
Foreign-born population percentage above state average.
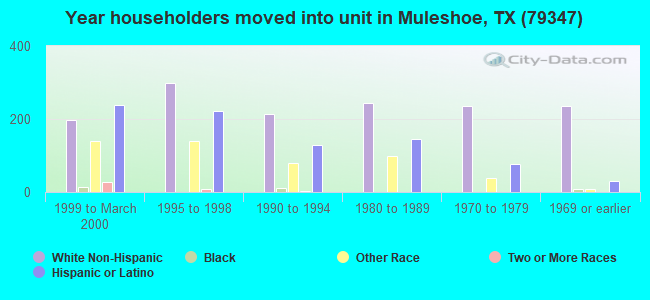
Length of stay since moving in significantly above state average.
Number of college students significantly below state average.
Percentage of population with a bachelor's degree or higher below state average.
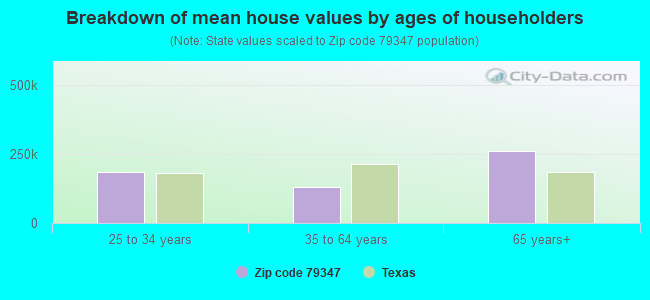
Estimated median house/condo value in 2022: $131,799
79347:
$131,799
Texas:
$275,400
According to our research of Texas and other state lists, there were 12 registered sex offenders living in 79347 zip code as of June 30, 2024. The ratio of all residents to sex offenders in zip code 79347 is 622 to 1. The ratio of registered sex offenders to all residents in this zip code is lower than the state average.
Median resident age:
This zip code:
30.5 years
Texas median age:
35.6 years
Average household size:
This zip code:
3.4 people
Texas:
2.6 people
Averages for the 2020 tax year for zip code 79347, filed in 2021:
Average Adjusted Gross Income (AGI) in 2020: $53,260 (Individual Income Tax Returns)
Here:
$53,260
State:
$77,054
Salary/wage: $41,498 (reported on 84.8% of returns)
Here:
$41,498
State:
$62,766
(% of AGI for various income ranges: 1450.3% for AGIs below $25k, 4325.3% for AGIs $25k-50k, 7547.8% for AGIs $50k-75k, 9231.5% for AGIs $75k-100k, 18327.3% for AGIs $100k-200k)
Taxable interest for individuals: $1,753 (reported on 15.9% of returns)
This zip code:
$1,753
Texas:
$2,665
(% of AGI for various income ranges: 6.9% for AGIs below $25k, 19.0% for AGIs $25k-50k, 19.3% for AGIs $50k-75k, 24.6% for AGIs $75k-100k, 130.9% for AGIs $100k-200k)
Ordinary dividends: $10,878 (reported on 8.5% of returns)
Here:
$10,878
State:
$10,044
(% of AGI for various income ranges: 12.3% for AGIs below $25k, 19.2% for AGIs $25k-50k, 37.8% for AGIs $50k-75k, 69.2% for AGIs $75k-100k, 275.5% for AGIs $100k-200k)
Net capital gain/loss in AGI: +$25,442 (reported on 8.9% of returns)
Here:
+$25,442
State:
+$39,590
(% of AGI for various income ranges: 7.9% for AGIs below $25k, 16.1% for AGIs $25k-50k, 49.6% for AGIs $50k-75k, 118.5% for AGIs $75k-100k, 1200.0% for AGIs $100k-200k)
Profit/loss from business: +$10,974 (reported on 17.0% of returns)
Here:
+$10,974
State:
+$10,888
(% of AGI for various income ranges: 214.8% for AGIs below $25k, 263.2% for AGIs $25k-50k, 79.3% for AGIs $50k-75k, 428.5% for AGIs $75k-100k, 1011.8% for AGIs $100k-200k)
Taxable individual retirement arrangement distribution: $12,650 (reported on 4.4% of returns)
79347:
$12,650
Texas:
$24,740
(% of AGI for various income ranges: 11.6% for AGIs below $25k, 52.0% for AGIs $25k-50k, 146.3% for AGIs $50k-75k, 662.7% for AGIs $100k-200k)
Total itemized deductions: $39,529 (reported on 2.6% of returns)
Here:
$39,529
State:
$40,428
(% of AGI for various income ranges: 104.0% for AGIs below $25k, 429.2% for AGIs $75k-100k)
Charity contributions: $20,167 (reported on 2.2% of returns)
Here:
$20,167
State:
$18,201
(% of AGI for various income ranges: 146.3% for AGIs $50k-75k)
Taxes paid: $4,529 (reported on 2.6% of returns)
79347:
$4,529
State:
$7,821
(% of AGI for various income ranges: 19.8% for AGIs $25k-50k, 181.8% for AGIs $100k-200k)
Earned income credit: $2,903 (reported on 25.6% of returns)
Here:
$2,903
State:
$2,584
(% of AGI for various income ranges: 172.1% for AGIs below $25k, 120.7% for AGIs $25k-50k)
Percentage of individuals using paid preparers for their 2020 taxes: 89.6%
Here:
90%
State:
92%
(% for various income ranges: 90.2% for AGIs below $25k, 87.7% for AGIs $25k-50k, 90.0% for AGIs $50k-75k, 89.5% for AGIs $75k-100k, 95.5% for AGIs $100k-200k, 83.3% for AGIs over 200k)
Averages for the 2012 tax year for zip code 79347, filed in 2013:
Average Adjusted Gross Income (AGI) in 2012: $43,137 (Individual Income Tax Returns)
Here:
$43,137
State:
$65,384
Salary/wage: $32,163 (reported on 86.5% of returns)
Here:
$32,163
State:
$52,524
(% of AGI for various income ranges: 83.9% for AGIs below $25k, 88.0% for AGIs $25k-50k, 77.0% for AGIs $50k-75k, 68.6% for AGIs $75k-100k, 58.1% for AGIs $100k-200k, 15.3% for AGIs over 200k)
Taxable interest for individuals: $1,363 (reported on 18.8% of returns)
This zip code:
$1,363
Texas:
$2,372
(% of AGI for various income ranges: 0.7% for AGIs below $25k, 0.3% for AGIs $25k-50k, 0.4% for AGIs $50k-75k, 0.8% for AGIs $75k-100k, 1.0% for AGIs $100k-200k, 0.7% for AGIs over 200k)
Ordinary dividends: $14,358 (reported on 9.0% of returns)
Here:
$14,358
State:
$9,721
(% of AGI for various income ranges: 0.8% for AGIs below $25k, 0.3% for AGIs $25k-50k, 0.6% for AGIs $50k-75k, 1.9% for AGIs $75k-100k, 3.0% for AGIs $100k-200k, 10.0% for AGIs over 200k)
Net capital gain/loss in AGI: +$19,945 (reported on 7.6% of returns)
Here:
+$19,945
State:
+$35,319
(% of AGI for various income ranges: 0.3% for AGIs $50k-75k, 2.7% for AGIs $75k-100k, 3.6% for AGIs $100k-200k, 12.9% for AGIs over 200k)
Profit/loss from business: +$13,866 (reported on 15.3% of returns)
Here:
+$13,866
State:
+$13,732
(% of AGI for various income ranges: 9.7% for AGIs below $25k, 3.6% for AGIs $25k-50k, 3.2% for AGIs $50k-75k, 2.8% for AGIs $75k-100k, 6.2% for AGIs $100k-200k, 5.0% for AGIs over 200k)
Taxable individual retirement arrangement distribution: $9,467 (reported on 5.2% of returns)
79347:
$9,467
Texas:
$19,511
(% of AGI for various income ranges: 1.4% for AGIs below $25k, 0.8% for AGIs $25k-50k, 2.4% for AGIs $50k-75k, 2.9% for AGIs $100k-200k)
Total itemized deductions: $22,107 (16% of AGI, reported on 10.4% of returns)
Here:
$22,107
State:
$24,724
Here:
16.3% of AGI
State:
15.9% of AGI
(% of AGI for various income ranges: 3.6% for AGIs below $25k, 3.3% for AGIs $25k-50k, 4.7% for AGIs $50k-75k, 5.7% for AGIs $75k-100k, 8.9% for AGIs $100k-200k, 7.1% for AGIs over 200k)
Charity contributions: $7,592 (reported on 8.3% of returns)
Here:
$7,592
State:
$6,808
(% of AGI for various income ranges: 0.4% for AGIs below $25k, 0.7% for AGIs $25k-50k, 1.2% for AGIs $50k-75k, 1.6% for AGIs $75k-100k, 3.1% for AGIs $100k-200k, 2.2% for AGIs over 200k)
Taxes paid: $4,407 (reported on 10.4% of returns)
79347:
$4,407
State:
$6,921
(% of AGI for various income ranges: 0.7% for AGIs below $25k, 0.5% for AGIs $25k-50k, 1.0% for AGIs $50k-75k, 1.3% for AGIs $75k-100k, 2.2% for AGIs $100k-200k, 1.2% for AGIs over 200k)
Earned income credit: $2,733 (reported on 28.8% of returns)
Here:
$2,733
State:
$2,570
(% of AGI for various income ranges: 9.9% for AGIs below $25k, 1.8% for AGIs $25k-50k)
Percentage of individuals using paid preparers for their 2012 taxes: 64.9%
Here:
65%
State:
51%
(% for various income ranges: 59.4% for AGIs below $25k, 70.8% for AGIs $25k-50k, 63.3% for AGIs $50k-75k, 62.5% for AGIs $75k-100k, 76.9% for AGIs $100k-200k, 80.0% for AGIs over 200k)
Averages for the 2004 tax year for zip code 79347, filed in 2005:
Average Adjusted Gross Income (AGI) in 2004: $32,336 (Individual Income Tax Returns)
Here:
$32,336
State:
$47,881
Salary/wage: $26,482 (reported on 83.6% of returns)
Here:
$26,482
State:
$41,947
(% of AGI for various income ranges: 201.9% for AGIs below $10k, 82.6% for AGIs $10k-25k, 81.1% for AGIs $25k-50k, 71.2% for AGIs $50k-75k, 76.4% for AGIs $75k-100k, 33.7% for AGIs over 100k)
Taxable interest for individuals: $2,018 (reported on 28.7% of returns)
This zip code:
$2,018
Texas:
$2,255
(% of AGI for various income ranges: 13.5% for AGIs below $10k, 2.0% for AGIs $10k-25k, 1.6% for AGIs $25k-50k, 1.6% for AGIs $50k-75k, 1.2% for AGIs $75k-100k, 1.5% for AGIs over 100k)
Taxable dividends: $6,184 (reported on 13.1% of returns)
Here:
$6,184
State:
$4,261
(% of AGI for various income ranges: 3.3% for AGIs below $10k, 0.7% for AGIs $10k-25k, 1.0% for AGIs $25k-50k, 0.5% for AGIs $50k-75k, 1.4% for AGIs $75k-100k, 6.9% for AGIs over 100k)
Net capital gain/loss: +$7,756 (reported on 11.0% of returns)
Here:
+$7,756
State:
+$16,110
(% of AGI for various income ranges: 8.3% for AGIs below $10k, 0.7% for AGIs $10k-25k, 0.8% for AGIs $25k-50k, 0.2% for AGIs $50k-75k, 0.9% for AGIs $75k-100k, 7.5% for AGIs over 100k)
Profit/loss from business: +$8,774 (reported on 17.5% of returns)
Here:
+$8,774
State:
+$11,013
(% of AGI for various income ranges: 7.6% for AGIs below $10k, 6.0% for AGIs $10k-25k, 3.9% for AGIs $25k-50k, 4.3% for AGIs $50k-75k, 0.2% for AGIs $75k-100k, 6.7% for AGIs over 100k)
Profit/loss from farming: +$498 (reported on 11.1% of returns)
Here:
+$498
State:
-$9,403
(% of AGI for various income ranges: -45.2% for AGIs below $10k, -1.4% for AGIs $10k-25k, 1.6% for AGIs $25k-50k, 0.7% for AGIs $50k-75k, 3.8% for AGIs $75k-100k, 1.0% for AGIs over 100k)
IRA payment deduction: $3,456 (reported on 2.6% of returns)
79347:
$3,456
Texas:
$3,120
(% of AGI for various income ranges: 0.3% for AGIs $10k-25k, 0.3% for AGIs $25k-50k, 0.5% for AGIs $50k-75k, 0.2% for AGIs over 100k)
Self-employed pension: $16,000 (reported on 0.5% of returns)
Here:
$16,000
Texas:
$16,401
Total itemized deductions: $17,370 (21% of AGI, reported on 9.3% of returns)
Here:
$17,370
State:
$19,631
Here:
20.6% of AGI
State:
18.9% of AGI
(% of AGI for various income ranges: 11.6% for AGIs below $10k, 4.4% for AGIs $10k-25k, 3.7% for AGIs $25k-50k, 5.3% for AGIs $50k-75k, 6.8% for AGIs $75k-100k, 5.2% for AGIs over 100k)
Charity contributions deductions: $7,067 (7% of AGI, reported on 7.9% of returns)
Here:
$7,067
State:
$4,753
Here:
7.3% of AGI
State:
4.2% of AGI
(% of AGI for various income ranges: 0.7% for AGIs $10k-25k, 1.0% for AGIs $25k-50k, 1.5% for AGIs $50k-75k, 2.3% for AGIs $75k-100k, 3.1% for AGIs over 100k)
Total tax: $5,732 (reported on 60.4% of returns)
79347:
$5,732
State:
$9,058
(% of AGI for various income ranges: 6.9% for AGIs below $10k, 3.2% for AGIs $10k-25k, 5.3% for AGIs $25k-50k, 9.1% for AGIs $50k-75k, 11.8% for AGIs $75k-100k, 21.6% for AGIs over 100k)
Earned income credit: $2,072 (reported on 31.8% of returns)
Here:
$2,072
State:
$2,024
Percentage of individuals using paid preparers for their 2004 taxes: 72.1%
Here:
72%
State:
57%
(% for various income ranges: 66.6% for AGIs below $10k, 75.8% for AGIs $10k-25k, 72.4% for AGIs $25k-50k, 70.6% for AGIs $50k-75k, 67.3% for AGIs $75k-100k, 84.8% for AGIs over 100k)
Household received Food Stamps/SNAP in the past 12 months: 179 Household did not receive Food Stamps/SNAP in the past 12 months: 1,954
Women who had a birth in the past 12 months: 92 (6 now married, 82 unmarried) Women who did not have a birth in the past 12 months: 1,890 (652 now married, 1,243 unmarried)
Housing units in zip code 79347 with a mortgage: 585 Houses without a mortgage: 1
Median monthly owner costs for units with a mortgage: $867 Median monthly owner costs for units without a mortgage: $488
Residents with income below the poverty level in 2022:
This zip code:
12.3%
Whole state:
14.0%
Residents with income below 50% of the poverty level in 2022:
This zip code:
4.3%
Whole state:
7.4%
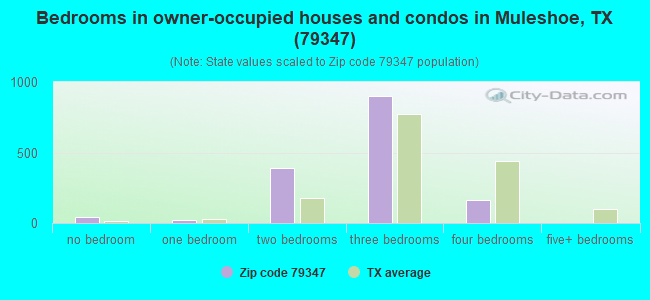
Median number of rooms in houses and condos:
Here:
5.8
State:
6.3
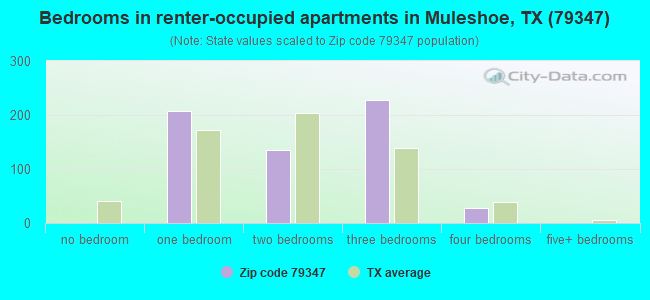
Median number of rooms in apartments:
Here:
3.9
State:
4.0
Notable locations in this zip code not listed on our city pages
Notable locations in zip code 79347: Circle Back (A), Golden Ranch (B), Mill (C), Pleasant Valley Community House (D), West Camp (E), Birdwell Ranch (F), Muleshoe Volunteer Fire Department (G), Bailey County Emergency Medical Services (H). Display/hide their locations on the map
Churches in zip code 79347 include: Primera Iglesia Bautista Hispana Church (A), First Baptist Church (B), The Church of God of the First Born (C), Church of Christ (D), Trinity Baptist Church (E), Richland Hills Baptist Church (F), Longview Church (G), Y-L Church (H). Display/hide their locations on the map
Lakes and reservoirs: Lower Pauls Lake (A), Baileyboro Lake (B), Willow Lake (C), Coyote Lake (D), Upper Pauls Lake (E), Upper White Lake (F), Lower White Lake (G), Enochs Pond (H). Display/hide their locations on the map
Parks in zip code 79347 include: Muleshoe City Park (1), Muleshoe National Wildlife Refuge (2), City Park (3), Babe Ruth Park (4). Display/hide their locations on the map
In group quarters: 184 (-1 institutionalized population)
Size of family households: 670 2-persons, 245 3-persons, 310 4-persons, 103 5-persons, 36 6-persons, 82 7-or-more-persons
Size of nonfamily households: 539 1-person, 155 2-persons
744 married couples with children.
1,089 single-parent households (180 men, 909 women).
40.7% of residents of 79347 zip code speak English at home.
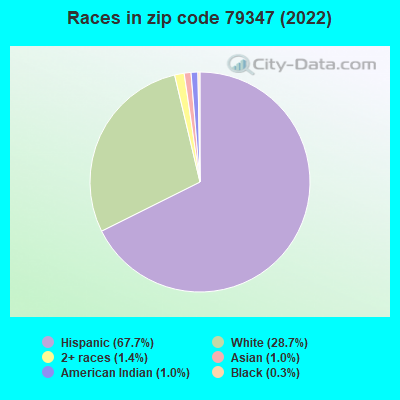
55.9% of residents speak Spanish at home (54% very well, 14% well, 21% not well, 10% not at all).
1.3% of residents speak other Indo-European language at home (86% very well, 6% well, 9% not well).
1.2% of residents speak Asian or Pacific Island language at home (100% very well).
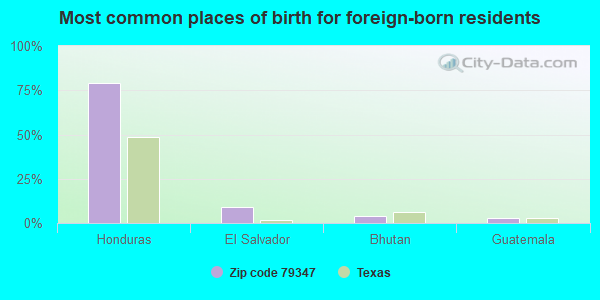
Foreign born population: 2,063 (28.0%) (19.3% of them are naturalized citizens)
This zip code:
28.0%
Whole state:
17.2%
79%Honduras
9%El Salvador
4%Bhutan
3%Guatemala
5%English
4%German
3%American
2%South African
1%Irish
1%Scotch-Irish
1%Canadian
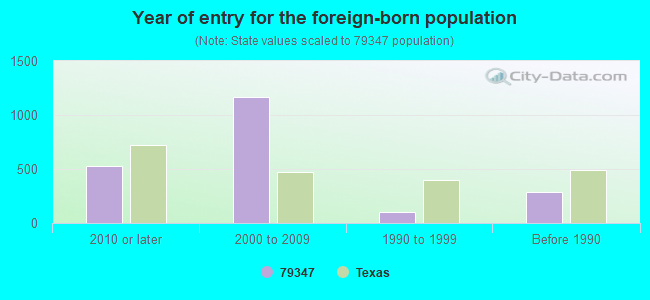
Year of entry for the foreign-born population
5292010 or later
1,1672000 to 2009
1051990 to 1999
287Before 1990
Facilities with environmental interests located in this zip code:
BAILEY COUNTY ELECTRIC COOP (305 E AVE B in MULESHOE, TX)
(Integrated Compliance Information System) - ICIS-06-1987-0336, FORMAL ENFORCEMENT ACTION COMPLIANCE ACTIVITY (Tracking inspections of insecticide, fungicide, and rodenticide, and toxic substances) Business SIC classification: ELECTRICAL WORK; ELECTRIC SERVICES
AG AVIATION, INC. (2.5 MI N. HWY 214 in MULESHOE, TX)
(Integrated Compliance Information System) - ICIS-06-2003-0303, FORMAL ENFORCEMENT ACTION
4 MI W INT OF FM 1760 & USHWY (84, S SIDE OF FM 1760 in MULESHOE, TX)
National Pollutant Discharge Elimination System NON-MAJOR (Tracking pollutant discharge elimination systems) - permit Business SIC classification: DAIRY FARMS Organizations: MR. LAWRENCE A HANCOCK (CONTACT/OWNER)
Alternative names: J. M. HOWLE, JR., ALLENE HOWLE
Housing units lacking complete plumbing facilities: 7.3% Housing units lacking complete kitchen facilities: 4.4%
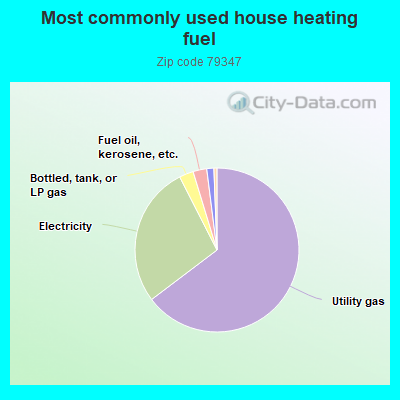
64.7%Utility gas
27.8%Electricity
2.8%Bottled, tank, or LP gas
2.7%Fuel oil, kerosene, etc.
1.4%Wood
0.6%Other fuel
Population in 1990: 6,664.
Place of birth for U.S.-born residents:
This state: 4,103
Northeast: 7
Midwest: 135
South: 161
West: 865
58% of the 79347 zip code residents lived in the same house 5 years ago. Out of people who lived in different houses, 62% lived in this county. Out of people who lived in different counties, 50% lived in Texas.
94% of the 79347 zip code residents lived in the same house 1 year ago. Out of people who lived in different houses, 43% moved from this county. Out of people who lived in different houses, 37% moved from different county within same state. Out of people who lived in different houses, 24% moved from different state.
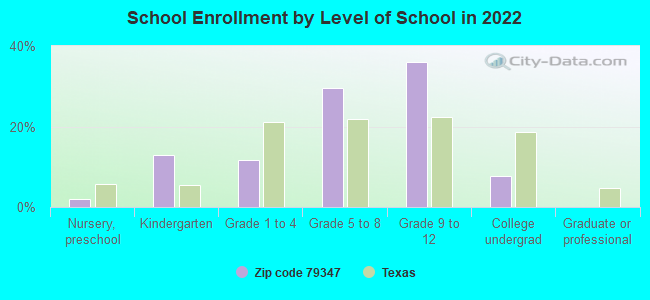
Private vs. public school enrollment:
Students in private schools in grades 1 to 8 (elementary and middle school):
Here:
0.0%
Texas:
8.8%
Students in private schools in grades 9 to 12 (high school): 2
Here:
0.4%
Texas:
8.0%
Students in private undergraduate colleges:
Here:
0.0%
Texas:
16.2%
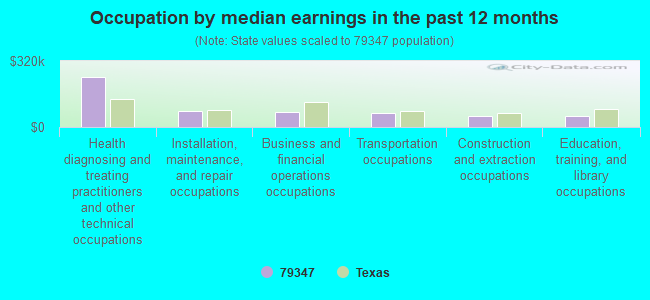
Occupation by median earnings in the past 12 months ($)
243,769Health diagnosing and treating practitioners and other technical occupations
78,941Installation, maintenance, and repair occupations
73,260Business and financial operations occupations
67,247Transportation occupations
54,094Construction and extraction occupations
53,659Education, training, and library occupations
Top industries in this zip code by the number of employees in 2005:
Health Care and Social Assistance: General Medical and Surgical Hospitals (100-249 employees: 1 establishment)
Utilities: Fossil Fuel Electric Power Generation (100-249: 1)
Wholesale Trade: Farm and Garden Machinery and Equipment Merchant Wholesalers (10-19: 2, 5-9: 2, 1-4: 2)
Accommodation and Food Services: Food Service Contractors (20-49: 1, 5-9: 1)
Utilities: Electric Power Distribution (20-49: 1, 5-9: 1)
People in group quarters in 2010:
56 people in local jails and other municipal confinement facilities
50 people in nursing facilities/skilled-nursing facilities
People in group quarters in 2000:
44 people in nursing homes
16 people in local jails and other confinement facilities (including police lockups)
Fatal accident statistics in 2013:
Fatal accident count: 1
Vehicles involved in fatal accidents: 2
Fatal accidents caused by drunken drivers: 0
Fatalities: 1
Persons involved in fatal accidents: 5
Pedestrians involved in fatal accidents: 0
Fatal accident statistics in 2012:
Fatal accident count: 1
Vehicles involved in fatal accidents: 2
Fatal accidents caused by drunken drivers: 0
Fatalities: 1
Persons involved in fatal accidents: 2
Pedestrians involved in fatal accidents: 0
2002 - 2018 National Fire Incident Reporting System (NFIRS) incidents
Based on the data from the years 2002 - 2018 the average number of fire incidents per year is 54. The highest number of reported fires - 103 took place in 2018, and the least - 0 in 2005. The data has an increasing trend.
When looking into fire subcategories, the most reports belonged to: Outside Fires (73.2%), and Structure Fires (14.4%).
Fire incident types reported to NFIRS in Zip Code 79347


+$498
-$9,403
(% of AGI for various income ranges: -45.2% for AGIs below $10k, -1.4% for AGIs $10k-25k, 1.6% for AGIs $25k-50k, 0.7% for AGIs $50k-75k, 3.8% for AGIs $75k-100k, 1.0% for AGIs over 100k) Nearest zip codes: 79371, 79324, 79325, 79053, 79031, 79344.
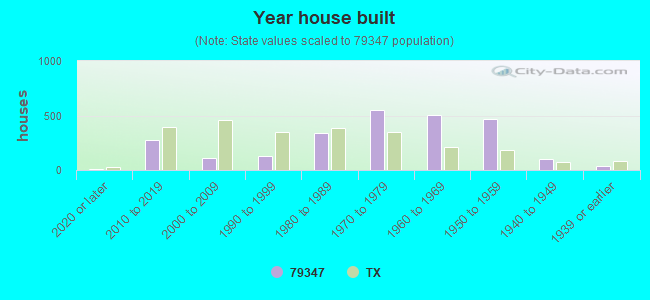


 Based on the data from the years 2002 - 2018 the average number of fire incidents per year is 54. The highest number of reported fires - 103 took place in 2018, and the least - 0 in 2005. The data has an increasing trend.
 When looking into fire subcategories, the most reports belonged to: Outside Fires (73.2%), and Structure Fires (14.4%).