Estimated zip code population in 2022: 3,356 Zip code population in 2010: 3,197 Zip code population in 2000: 3,317
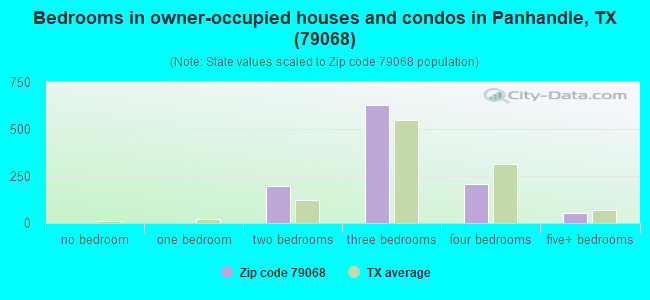
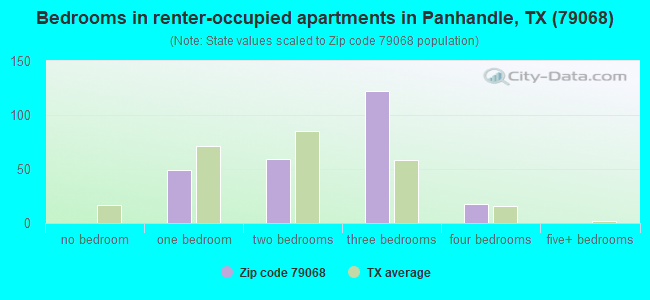
Houses and condos: 1,527 Renter-occupied apartments: 253
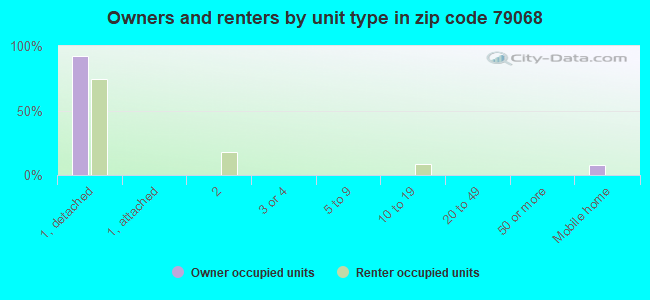
% of renters here:
19%
State:
38%
March 2022 cost of living index in zip code 79068: 78.7 (low, U.S. average is 100)
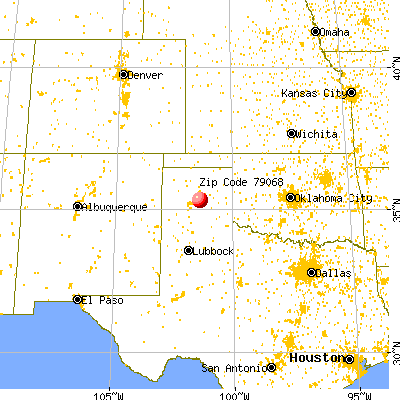
Land area: 393.8 sq. mi. Water area: 2.1 sq. mi.
Population density: 9 people per square mile
(very low).
OSM Map
General Map
Google Map
MSN Map
OSM Map
General Map
Google Map
MSN Map
OSM Map
General Map
Google Map
MSN Map
OSM Map
General Map
Google Map
MSN Map
Please wait while loading the map...
Real estate property taxes paid for housing units in 2022:
This zip code:
1.3% ($2,215)
Texas:
1.5% ($4,050)
Median real estate property taxes paid for housing units with mortgages in 2022: $2,744 (1.3%) Median real estate property taxes paid for housing units with no mortgage in 2022: $1,669 (1.2%)
Business Search- 14 Million verified businesses
Males: 1,741
(51.9%)
Females: 1,614
(48.1%)
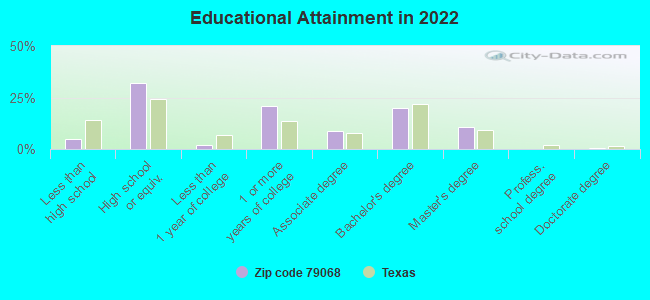
For population 25 years and over in 79068:
High school or higher: 94.7%
Bachelor's degree or higher: 31.1%
Graduate or professional degree: 11.2%
Unemployed: 1.7%
Mean travel time to work (commute): 21.8 minutes
For population 15 years and over in 79068:
Never married: 28.0%
Now married: 53.2%
Separated: 0.3%
Widowed: 4.8%
Divorced: 13.7%
Zip code 79068 compared to state average:
Median house value below state average.
Unemployed percentage below state average.
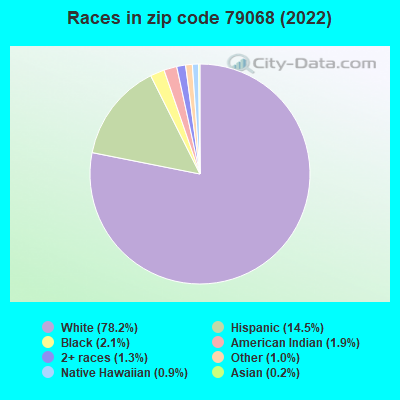
Black race population percentage significantly below state average.
Hispanic race population percentage below state average.
Median age above state average.
Foreign-born population percentage significantly below state average.
Renting percentage below state average.
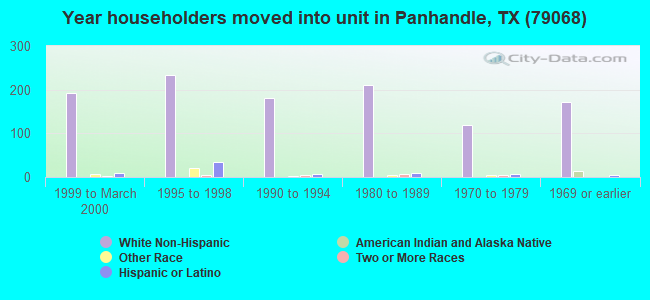
Length of stay since moving in significantly above state average.
Averages for the 2020 tax year for zip code 79068, filed in 2021:
Average Adjusted Gross Income (AGI) in 2020: $71,405 (Individual Income Tax Returns)
Here:
$71,405
State:
$77,054
Salary/wage: $64,114 (reported on 80.9% of returns)
Here:
$64,114
State:
$62,766
(% of AGI for various income ranges: 1141.5% for AGIs below $25k, 3404.2% for AGIs $25k-50k, 6198.7% for AGIs $50k-75k, 9869.2% for AGIs $75k-100k, 16671.7% for AGIs $100k-200k)
Taxable interest for individuals: $827 (reported on 34.4% of returns)
This zip code:
$827
Texas:
$2,665
(% of AGI for various income ranges: 15.4% for AGIs below $25k, 12.6% for AGIs $25k-50k, 34.0% for AGIs $50k-75k, 45.8% for AGIs $75k-100k, 74.4% for AGIs $100k-200k)
Ordinary dividends: $3,020 (reported on 15.3% of returns)
Here:
$3,020
State:
$10,044
(% of AGI for various income ranges: 19.2% for AGIs below $25k, 42.1% for AGIs $25k-50k, 65.3% for AGIs $50k-75k, 46.7% for AGIs $75k-100k, 177.8% for AGIs $100k-200k)
Net capital gain/loss in AGI: +$9,148 (reported on 16.0% of returns)
Here:
+$9,148
State:
+$39,590
(% of AGI for various income ranges: 4.2% for AGIs below $25k, 10.0% for AGIs $25k-50k, 88.7% for AGIs $50k-75k, 21.7% for AGIs $75k-100k, 358.9% for AGIs $100k-200k)
Profit/loss from business: +$7,548 (reported on 16.0% of returns)
Here:
+$7,548
State:
+$10,888
(% of AGI for various income ranges: 97.3% for AGIs below $25k, 87.4% for AGIs $25k-50k, 50.7% for AGIs $50k-75k, 164.2% for AGIs $75k-100k, 496.1% for AGIs $100k-200k)
Taxable individual retirement arrangement distribution: $17,193 (reported on 11.5% of returns)
79068:
$17,193
Texas:
$24,740
(% of AGI for various income ranges: 67.3% for AGIs below $25k, 216.8% for AGIs $25k-50k, 482.5% for AGIs $75k-100k, 785.0% for AGIs $100k-200k)
Total itemized deductions: $31,060 (reported on 3.8% of returns)
Here:
$31,060
State:
$40,428
(% of AGI for various income ranges: 862.8% for AGIs $100k-200k)
Charity contributions: $15,725 (reported on 3.1% of returns)
Here:
$15,725
State:
$18,201
(% of AGI for various income ranges: 349.4% for AGIs $100k-200k)
Taxes paid: $5,200 (reported on 3.8% of returns)
79068:
$5,200
State:
$7,821
(% of AGI for various income ranges: 144.4% for AGIs $100k-200k)
Earned income credit: $2,387 (reported on 11.5% of returns)
Here:
$2,387
State:
$2,584
(% of AGI for various income ranges: 86.2% for AGIs below $25k, 70.5% for AGIs $25k-50k)
Percentage of individuals using paid preparers for their 2020 taxes: 93.1%
Here:
93%
State:
92%
(% for various income ranges: 91.7% for AGIs below $25k, 91.7% for AGIs $25k-50k, 95.0% for AGIs $50k-75k, 88.9% for AGIs $75k-100k, 96.4% for AGIs $100k-200k, 100.0% for AGIs over 200k)
Averages for the 2012 tax year for zip code 79068, filed in 2013:
Average Adjusted Gross Income (AGI) in 2012: $59,474 (Individual Income Tax Returns)
Here:
$59,474
State:
$65,384
Salary/wage: $51,194 (reported on 84.6% of returns)
Here:
$51,194
State:
$52,524
(% of AGI for various income ranges: 75.7% for AGIs below $25k, 78.0% for AGIs $25k-50k, 80.4% for AGIs $50k-75k, 84.9% for AGIs $75k-100k, 87.6% for AGIs $100k-200k)
Taxable interest for individuals: $1,637 (reported on 33.8% of returns)
This zip code:
$1,637
Texas:
$2,372
(% of AGI for various income ranges: 1.1% for AGIs below $25k, 0.6% for AGIs $25k-50k, 0.4% for AGIs $50k-75k, 0.2% for AGIs $75k-100k, 0.7% for AGIs $100k-200k, 3.7% for AGIs over 200k)
Ordinary dividends: $3,629 (reported on 15.4% of returns)
Here:
$3,629
State:
$9,721
(% of AGI for various income ranges: 1.0% for AGIs below $25k, 0.7% for AGIs $25k-50k, 0.4% for AGIs $50k-75k, 0.2% for AGIs $75k-100k, 1.2% for AGIs $100k-200k, 2.6% for AGIs over 200k)
Net capital gain/loss in AGI: +$11,031 (reported on 11.8% of returns)
Here:
+$11,031
State:
+$35,319
(% of AGI for various income ranges: 0.3% for AGIs below $25k, 0.1% for AGIs $50k-75k, 0.1% for AGIs $75k-100k, 2.5% for AGIs $100k-200k, 10.8% for AGIs over 200k)
Profit/loss from business: +$9,458 (reported on 17.6% of returns)
Here:
+$9,458
State:
+$13,732
(% of AGI for various income ranges: 5.4% for AGIs below $25k, 2.5% for AGIs $25k-50k, 2.2% for AGIs $50k-75k, 2.1% for AGIs $75k-100k, 4.5% for AGIs $100k-200k)
Taxable individual retirement arrangement distribution: $13,407 (reported on 11.0% of returns)
79068:
$13,407
Texas:
$19,511
(% of AGI for various income ranges: 3.6% for AGIs below $25k, 2.1% for AGIs $25k-50k, 2.0% for AGIs $50k-75k, 2.0% for AGIs $75k-100k, 4.1% for AGIs $100k-200k)
Total itemized deductions: $20,444 (20% of AGI, reported on 19.9% of returns)
Here:
$20,444
State:
$24,724
Here:
19.7% of AGI
State:
15.9% of AGI
(% of AGI for various income ranges: 7.1% for AGIs below $25k, 7.8% for AGIs $25k-50k, 4.8% for AGIs $50k-75k, 6.2% for AGIs $75k-100k, 8.1% for AGIs $100k-200k, 6.2% for AGIs over 200k)
Charity contributions: $7,205 (reported on 15.4% of returns)
Here:
$7,205
State:
$6,808
(% of AGI for various income ranges: 2.3% for AGIs $25k-50k, 1.1% for AGIs $50k-75k, 1.0% for AGIs $75k-100k, 2.5% for AGIs $100k-200k, 3.3% for AGIs over 200k)
Taxes paid: $4,322 (reported on 19.9% of returns)
79068:
$4,322
State:
$6,921
(% of AGI for various income ranges: 2.0% for AGIs $25k-50k, 0.9% for AGIs $50k-75k, 1.1% for AGIs $75k-100k, 2.6% for AGIs $100k-200k)
Earned income credit: $1,925 (reported on 14.7% of returns)
Here:
$1,925
State:
$2,570
(% of AGI for various income ranges: 4.4% for AGIs below $25k, 1.6% for AGIs $25k-50k)
Percentage of individuals using paid preparers for their 2012 taxes: 53.7%
Here:
54%
State:
51%
(% for various income ranges: 48.8% for AGIs below $25k, 50.0% for AGIs $25k-50k, 52.4% for AGIs $50k-75k, 55.0% for AGIs $75k-100k, 63.2% for AGIs $100k-200k, 100.0% for AGIs over 200k)
Averages for the 2004 tax year for zip code 79068, filed in 2005:
Average Adjusted Gross Income (AGI) in 2004: $42,712 (Individual Income Tax Returns)
Here:
$42,712
State:
$47,881
Salary/wage: $37,942 (reported on 82.7% of returns)
Here:
$37,942
State:
$41,947
(% of AGI for various income ranges: 128.9% for AGIs below $10k, 69.5% for AGIs $10k-25k, 82.4% for AGIs $25k-50k, 84.4% for AGIs $50k-75k, 80.9% for AGIs $75k-100k, 46.7% for AGIs over 100k)
Taxable interest for individuals: $1,551 (reported on 45.1% of returns)
This zip code:
$1,551
Texas:
$2,255
(% of AGI for various income ranges: 9.5% for AGIs below $10k, 3.8% for AGIs $10k-25k, 1.3% for AGIs $25k-50k, 1.2% for AGIs $50k-75k, 1.1% for AGIs $75k-100k, 1.4% for AGIs over 100k)
Taxable dividends: $1,413 (reported on 19.7% of returns)
Here:
$1,413
State:
$4,261
(% of AGI for various income ranges: 3.8% for AGIs below $10k, 1.0% for AGIs $10k-25k, 0.8% for AGIs $25k-50k, 0.4% for AGIs $50k-75k, 0.4% for AGIs $75k-100k, 0.6% for AGIs over 100k)
Net capital gain/loss: +$5,170 (reported on 17.2% of returns)
Here:
+$5,170
State:
+$16,110
(% of AGI for various income ranges: -0.2% for AGIs below $10k, -0.3% for AGIs $10k-25k, 1.1% for AGIs $25k-50k, 0.5% for AGIs $50k-75k, 0.4% for AGIs $75k-100k, 6.9% for AGIs over 100k)
Profit/loss from business: +$3,568 (reported on 18.0% of returns)
Here:
+$3,568
State:
+$11,013
(% of AGI for various income ranges: 12.3% for AGIs below $10k, 3.7% for AGIs $10k-25k, 2.1% for AGIs $25k-50k, 0.7% for AGIs $50k-75k, 1.3% for AGIs $75k-100k, 0.5% for AGIs over 100k)
IRA payment deduction: $3,054 (reported on 2.8% of returns)
79068:
$3,054
Texas:
$3,120
Total itemized deductions: $14,987 (21% of AGI, reported on 17.3% of returns)
Here:
$14,987
State:
$19,631
Here:
21.0% of AGI
State:
18.9% of AGI
(% of AGI for various income ranges: 8.1% for AGIs $10k-25k, 5.9% for AGIs $25k-50k, 5.8% for AGIs $50k-75k, 7.3% for AGIs $75k-100k, 5.1% for AGIs over 100k)
Charity contributions deductions: $4,658 (6% of AGI, reported on 14.0% of returns)
Here:
$4,658
State:
$4,753
Here:
6.2% of AGI
State:
4.2% of AGI
(% of AGI for various income ranges: 1.4% for AGIs $10k-25k, 1.1% for AGIs $25k-50k, 1.3% for AGIs $50k-75k, 2.0% for AGIs $75k-100k, 2.0% for AGIs over 100k)
Total tax: $5,711 (reported on 75.1% of returns)
79068:
$5,711
State:
$9,058
(% of AGI for various income ranges: 4.8% for AGIs below $10k, 4.6% for AGIs $10k-25k, 6.0% for AGIs $25k-50k, 8.5% for AGIs $50k-75k, 10.5% for AGIs $75k-100k, 17.3% for AGIs over 100k)
Earned income credit: $1,869 (reported on 14.8% of returns)
Here:
$1,869
State:
$2,024
Percentage of individuals using paid preparers for their 2004 taxes: 56.8%
Here:
57%
State:
57%
(% for various income ranges: 53.6% for AGIs below $10k, 58.1% for AGIs $10k-25k, 57.0% for AGIs $25k-50k, 54.7% for AGIs $50k-75k, 60.5% for AGIs $75k-100k, 63.5% for AGIs over 100k)
Likely homosexual households (counted as self-reported same-sex unmarried-partner households)
Lesbian couples: 0.1% of all households
Gay men: 0.0% of all households
Household received Food Stamps/SNAP in the past 12 months: 22 Household did not receive Food Stamps/SNAP in the past 12 months: 1,310
Women who had a birth in the past 12 months: 16 (10 now married, 5 unmarried) Women who did not have a birth in the past 12 months: 720 (299 now married, 422 unmarried)
Housing units in zip code 79068 with a mortgage: 481 Median monthly owner costs for units with a mortgage: $1,334 Median monthly owner costs for units without a mortgage: $517
Residents with income below the poverty level in 2022:
This zip code:
6.0%
Whole state:
14.0%
Residents with income below 50% of the poverty level in 2022:
This zip code:
1.2%
Whole state:
7.4%
Median number of rooms in houses and condos:
Here:
5.3
State:
6.3
Median number of rooms in apartments:
Here:
4.8
State:
4.0
Notable locations in this zip code not listed on our city pages
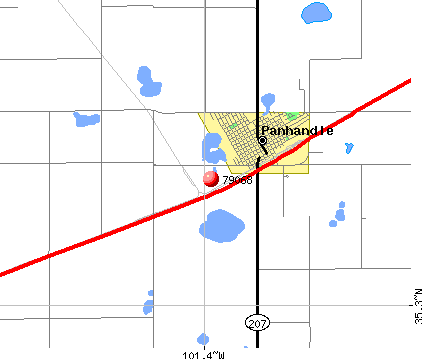
Notable locations in zip code 79068: Deal Ranch (A), Sixtysix Sixtysix Ranch (B), Williams Ranch (C), Bennett Ranch (D), Bois D'Arc Tree (E), Pantex Plant Fire Department (F), Panhandle Fire Department (G), Carson County Square House Museum (H), Panhandle Volunteer Emergency Medical Services (I). Display/hide their locations on the map
Lakes and reservoirs: Icehouse Lake (A), Rockwell Lake (B), Pantex Lake (C), Soil Conservation Service Site 1 Reservoir (D). Display/hide their locations on the map
In group quarters: 69 (-1 institutionalized population)
Size of family households: 518 2-persons, 170 3-persons, 98 4-persons, 38 5-persons, 23 6-persons, 21 7-or-more-persons
Size of nonfamily households: 406 1-person, 63 2-persons, 7 4-persons
452 married couples with children.
208 single-parent households (208 women).
96.5% of residents of 79068 zip code speak English at home.
3.3% of residents speak Spanish at home (63% very well, 14% well, 15% not well, 9% not at all).
0.1% of residents speak other Indo-European language at home (100% very well).
0.3% of residents speak Asian or Pacific Island language at home (78% very well, 22% not well).
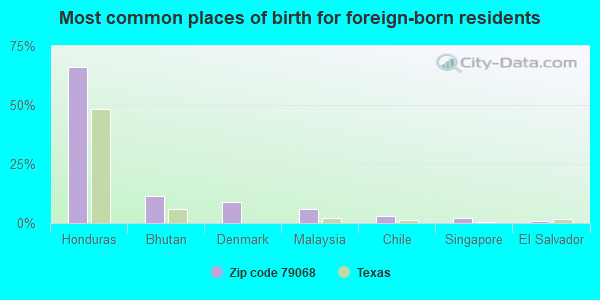
Foreign born population: 108 (3.2%) (87.2% of them are naturalized citizens)
This zip code:
3.2%
Whole state:
17.2%
66%Honduras
12%Bhutan
9%Denmark
6%Malaysia
3%Chile
2%Singapore
1%El Salvador
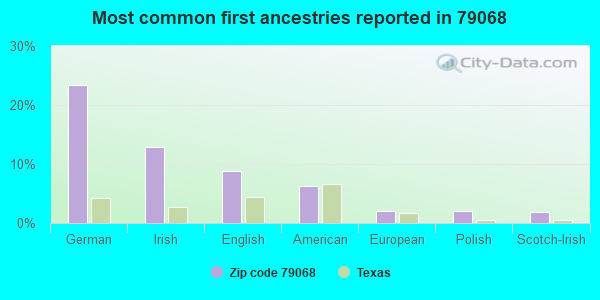
23%German
13%Irish
9%English
6%American
2%European
2%Polish
2%Scotch-Irish
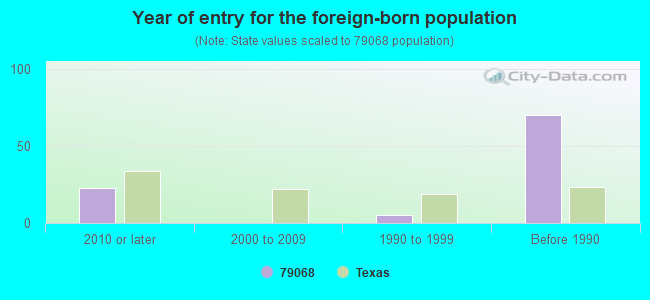
Year of entry for the foreign-born population
232010 or later
02000 to 2009
51990 to 1999
70Before 1990
Facilities with environmental interests located in this zip code:
AMERICAN PIPELINE CARSON PLANT (HWY 207 9 MI N in PANHANDLE, TX)
(Resource Conservation and Recovery Act (tracking hazardous waste)) Business NAICS classification: NATURAL GAS LIQUID EXTRACTION. Organizations: AMERICAN PIPELINE COMPANY (CONTACT/OPERATOR)
Alternative names: AMERICAN PROCESSING LP/CARSON
AMERICAN PROCESSING L.P. (11 MILES N OF PANHANDLE in PANHANDLE, TX)
AIR MAJOR (AIRS/AFS) Business SIC classification: NATURAL GAS LIQUIDS
Housing units lacking complete plumbing facilities: 0.2% Housing units lacking complete kitchen facilities: 1.5%
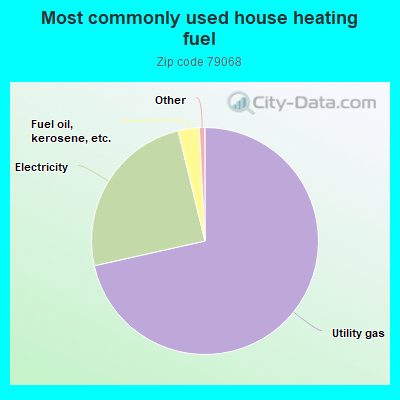
71.5%Utility gas
24.7%Electricity
3.0%Fuel oil, kerosene, etc.
Population in 1990: 3,669.
Place of birth for U.S.-born residents:
This state: 2,449
Northeast: 61
Midwest: 144
South: 212
West: 381
63% of the 79068 zip code residents lived in the same house 5 years ago. Out of people who lived in different houses, 39% lived in this county. Out of people who lived in different counties, 50% lived in Texas.
88% of the 79068 zip code residents lived in the same house 1 year ago. Out of people who lived in different houses, 50% moved from this county. Out of people who lived in different houses, 31% moved from different county within same state. Out of people who lived in different houses, 19% moved from different state.
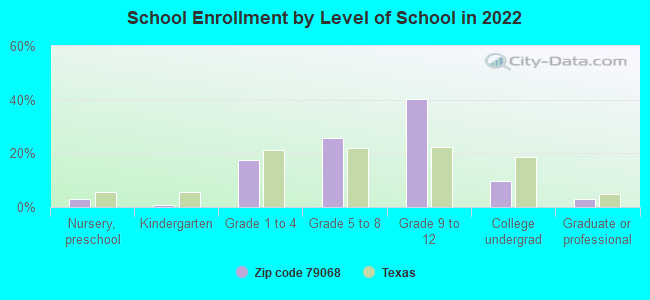
Private vs. public school enrollment:
Students in private schools in grades 1 to 8 (elementary and middle school): 18
Here:
6.4%
Texas:
8.8%
Students in private schools in grades 9 to 12 (high school): 9
Here:
3.8%
Texas:
8.0%
Students in private undergraduate colleges: 44
Here:
70.9%
Texas:
16.2%
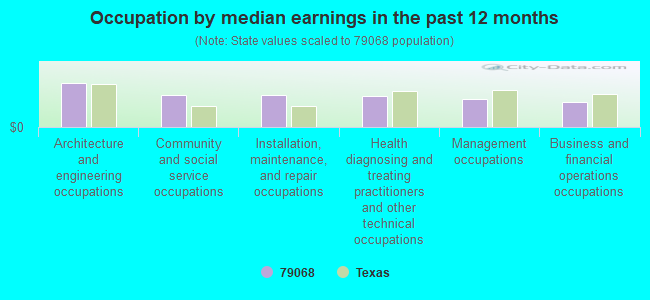
Occupation by median earnings in the past 12 months ($)
125,982Architecture and engineering occupations
91,759Community and social service occupations
91,499Installation, maintenance, and repair occupations
88,258Health diagnosing and treating practitioners and other technical occupations
79,493Management occupations
72,159Business and financial operations occupations
Companies with federal contracts located in this zip code:
VIBRA-WHIRL, LTD (94 MAIN ST in PANHANDLE, TX; small business) : $44,445 in 2 contractsin 2001
$45,945 with Air Force for Construction of Structures and Facilities -- Office Buildings. Taking place in GA. Signed on 2001-07-02. Completion date: 2001-10-25.
-$1,500, same as above.Signed on 2001-11-01. Completion date: 2001-12-14.
Top industries in this zip code by the number of employees in 2005:
Health Care and Social Assistance: Nursing Care Facilities (50-99 employees: 1 establishment)
Accommodation and Food Services: Full-Service Restaurants (10-19: 2, 1-4: 3)
Construction: Other Heavy and Civil Engineering Construction (20-49: 1)
Other Services (except Public Administration): Religious Organizations (10-19: 1, 1-4: 7)
Finance and Insurance: Insurance Agencies and Brokerages (10-19: 1, 1-4: 1)
Accommodation and Food Services: Limited-Service Restaurants (10-19: 1)
Professional, Scientific, and Technical Services: Veterinary Services (10-19: 1)
People in group quarters in 2010:
47 people in nursing facilities/skilled-nursing facilities
18 people in other noninstitutional facilities
6 people in local jails and other municipal confinement facilities
People in group quarters in 2000:
52 people in nursing homes
20 people in religious group quarters
18 people in local jails and other confinement facilities (including police lockups)
9 people in other noninstitutional group quarters
Fatal accident statistics in 2014:
Fatal accident count: 1
Vehicles involved in fatal accidents: 2
Fatal accidents caused by drunken drivers: 0
Fatalities: 1
Persons involved in fatal accidents: 2
Pedestrians involved in fatal accidents: 1
Fatal accident statistics in 2012:
Fatal accident count: 3
Vehicles involved in fatal accidents: 4
Fatal accidents caused by drunken drivers: 0
Fatalities: 4
Persons involved in fatal accidents: 5
Pedestrians involved in fatal accidents: 0
2002 - 2018 National Fire Incident Reporting System (NFIRS) incidents
Based on the data from the years 2002 - 2018 the average number of fire incidents per year is 34. The highest number of fire incidents - 73 took place in 2016, and the least - 4 in 2018. The data has a decreasing trend.
When looking into fire subcategories, the most incidents belonged to: Outside Fires (67.7%), and Mobile Property/Vehicle Fires (13.8%).
Fire incident types reported to NFIRS in Zip Code 79068


 Nearest zip codes: 79108, 79097, 79036, 79111, 79019, 79039.


 Based on the data from the years 2002 - 2018 the average number of fire incidents per year is 34. The highest number of fire incidents - 73 took place in 2016, and the least - 4 in 2018. The data has a decreasing trend.
 When looking into fire subcategories, the most incidents belonged to: Outside Fires (67.7%), and Mobile Property/Vehicle Fires (13.8%).