Estimated zip code population in 2022: 3,678 Zip code population in 2010: 3,749 Zip code population in 2000: 3,317
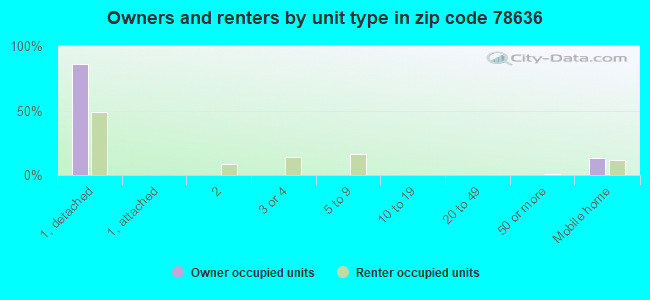
Houses and condos: 2,226 Renter-occupied apartments: 515
% of renters here:
29%
State:
38%
March 2022 cost of living index in zip code 78636: 83.0 (low, U.S. average is 100)
Land area: 349.7 sq. mi. Water area: 2.8 sq. mi.
Population density: 11 people per square mile
(very low).
OSM Map
General Map
Google Map
MSN Map
OSM Map
General Map
Google Map
MSN Map
OSM Map
General Map
Google Map
MSN Map
OSM Map
General Map
Google Map
MSN Map
Please wait while loading the map...
Real estate property taxes paid for housing units in 2022:
This zip code:
0.8% ($3,312)
Texas:
1.5% ($4,050)
Median real estate property taxes paid for housing units with mortgages in 2022: $4,368 (1.0%) Median real estate property taxes paid for housing units with no mortgage in 2022: $3,050 (0.8%)
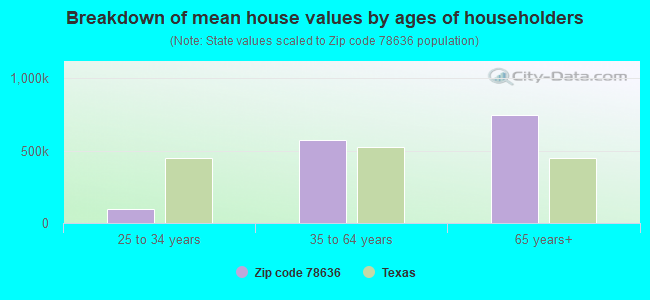
Estimated median house/condo value in 2022: $404,421
78636:
$404,421
Texas:
$275,400
According to our research of Texas and other state lists, there were 4 registered sex offenders living in 78636 zip code as of June 02, 2024. The ratio of all residents to sex offenders in zip code 78636 is 1,020 to 1. The ratio of registered sex offenders to all residents in this zip code is lower than the state average.
Median resident age:
This zip code:
53.1 years
Texas median age:
35.6 years
Average household size:
This zip code:
2.0 people
Texas:
2.6 people
Averages for the 2020 tax year for zip code 78636, filed in 2021:
Average Adjusted Gross Income (AGI) in 2020: $91,631 (Individual Income Tax Returns)
Here:
$91,631
State:
$77,054
Salary/wage: $63,597 (reported on 74.3% of returns)
Here:
$63,597
State:
$62,766
(% of AGI for various income ranges: 1152.6% for AGIs below $25k, 3613.0% for AGIs $25k-50k, 6477.5% for AGIs $50k-75k, 9102.5% for AGIs $75k-100k, 18091.8% for AGIs $100k-200k, 71240.0% for AGIs over 200k)
Taxable interest for individuals: $3,605 (reported on 36.9% of returns)
This zip code:
$3,605
Texas:
$2,665
(% of AGI for various income ranges: 28.6% for AGIs below $25k, 35.5% for AGIs $25k-50k, 91.2% for AGIs $50k-75k, 113.3% for AGIs $75k-100k, 303.5% for AGIs $100k-200k, 4262.5% for AGIs over 200k)
Ordinary dividends: $20,600 (reported on 23.8% of returns)
Here:
$20,600
State:
$10,044
(% of AGI for various income ranges: 33.3% for AGIs below $25k, 65.8% for AGIs $25k-50k, 247.5% for AGIs $50k-75k, 197.5% for AGIs $75k-100k, 757.6% for AGIs $100k-200k, 19540.0% for AGIs over 200k)
Net capital gain/loss in AGI: +$55,883 (reported on 22.8% of returns)
Here:
+$55,883
State:
+$39,590
(% of AGI for various income ranges: 4.3% for AGIs below $25k, 28.5% for AGIs $25k-50k, 223.1% for AGIs $50k-75k, 200.8% for AGIs $75k-100k, 1324.7% for AGIs $100k-200k, 58257.5% for AGIs over 200k)
Profit/loss from business: +$11,188 (reported on 24.8% of returns)
Here:
+$11,188
State:
+$10,888
(% of AGI for various income ranges: 268.3% for AGIs below $25k, 246.7% for AGIs $25k-50k, 241.9% for AGIs $50k-75k, 504.2% for AGIs $75k-100k, 641.2% for AGIs $100k-200k, 4207.5% for AGIs over 200k)
Taxable individual retirement arrangement distribution: $32,400 (reported on 11.2% of returns)
78636:
$32,400
Texas:
$24,740
(% of AGI for various income ranges: 63.6% for AGIs below $25k, 146.7% for AGIs $25k-50k, 328.8% for AGIs $50k-75k, 567.5% for AGIs $75k-100k, 1438.2% for AGIs $100k-200k, 7622.5% for AGIs over 200k)
Total itemized deductions: $42,953 (reported on 9.2% of returns)
Here:
$42,953
State:
$40,428
(% of AGI for various income ranges: 143.6% for AGIs below $25k, 571.2% for AGIs $50k-75k, 1248.2% for AGIs $100k-200k, 11305.0% for AGIs over 200k)
Charity contributions: $24,180 (reported on 7.3% of returns)
Here:
$24,180
State:
$18,201
(% of AGI for various income ranges: 143.8% for AGIs $50k-75k, 426.5% for AGIs $100k-200k, 6680.0% for AGIs over 200k)
Taxes paid: $7,783 (reported on 8.7% of returns)
78636:
$7,783
State:
$7,821
(% of AGI for various income ranges: 29.0% for AGIs below $25k, 129.4% for AGIs $50k-75k, 325.3% for AGIs $100k-200k, 1297.5% for AGIs over 200k)
Earned income credit: $2,052 (reported on 13.1% of returns)
Here:
$2,052
State:
$2,584
(% of AGI for various income ranges: 89.8% for AGIs below $25k, 53.6% for AGIs $25k-50k)
Percentage of individuals using paid preparers for their 2020 taxes: 89.8%
Here:
90%
State:
92%
(% for various income ranges: 90.5% for AGIs below $25k, 87.0% for AGIs $25k-50k, 88.9% for AGIs $50k-75k, 90.0% for AGIs $75k-100k, 91.4% for AGIs $100k-200k, 93.3% for AGIs over 200k)
Averages for the 2012 tax year for zip code 78636, filed in 2013:
Average Adjusted Gross Income (AGI) in 2012: $70,076 (Individual Income Tax Returns)
Here:
$70,076
State:
$65,384
Salary/wage: $51,975 (reported on 74.7% of returns)
Here:
$51,975
State:
$52,524
(% of AGI for various income ranges: 64.5% for AGIs below $25k, 68.4% for AGIs $25k-50k, 73.0% for AGIs $50k-75k, 68.1% for AGIs $75k-100k, 64.8% for AGIs $100k-200k, 33.2% for AGIs over 200k)
Taxable interest for individuals: $2,404 (reported on 39.4% of returns)
This zip code:
$2,404
Texas:
$2,372
(% of AGI for various income ranges: 3.3% for AGIs below $25k, 1.2% for AGIs $25k-50k, 0.7% for AGIs $50k-75k, 1.1% for AGIs $75k-100k, 1.3% for AGIs $100k-200k, 1.4% for AGIs over 200k)
Ordinary dividends: $11,806 (reported on 20.0% of returns)
Here:
$11,806
State:
$9,721
(% of AGI for various income ranges: 5.0% for AGIs below $25k, 2.0% for AGIs $25k-50k, 0.5% for AGIs $50k-75k, 1.2% for AGIs $75k-100k, 2.2% for AGIs $100k-200k, 6.0% for AGIs over 200k)
Net capital gain/loss in AGI: +$56,026 (reported on 20.6% of returns)
Here:
+$56,026
State:
+$35,319
(% of AGI for various income ranges: 1.5% for AGIs $25k-50k, 0.2% for AGIs $50k-75k, 1.3% for AGIs $75k-100k, 4.3% for AGIs $100k-200k, 42.6% for AGIs over 200k)
Profit/loss from business: +$14,240 (reported on 23.5% of returns)
Here:
+$14,240
State:
+$13,732
(% of AGI for various income ranges: 10.8% for AGIs below $25k, 6.4% for AGIs $25k-50k, 3.6% for AGIs $50k-75k, 2.9% for AGIs $75k-100k, 4.5% for AGIs $100k-200k, 4.5% for AGIs over 200k)
Taxable individual retirement arrangement distribution: $15,805 (reported on 12.4% of returns)
78636:
$15,805
Texas:
$19,511
(% of AGI for various income ranges: 4.2% for AGIs below $25k, 2.5% for AGIs $25k-50k, 1.7% for AGIs $50k-75k, 6.0% for AGIs $75k-100k, 6.2% for AGIs $100k-200k)
Total itemized deductions: $24,963 (16% of AGI, reported on 27.1% of returns)
Here:
$24,963
State:
$24,724
Here:
16.4% of AGI
State:
15.9% of AGI
(% of AGI for various income ranges: 10.9% for AGIs below $25k, 7.6% for AGIs $25k-50k, 10.0% for AGIs $50k-75k, 10.2% for AGIs $75k-100k, 11.0% for AGIs $100k-200k, 9.0% for AGIs over 200k)
Charity contributions: $6,991 (reported on 20.6% of returns)
Here:
$6,991
State:
$6,808
(% of AGI for various income ranges: 1.3% for AGIs below $25k, 1.2% for AGIs $25k-50k, 1.0% for AGIs $50k-75k, 1.2% for AGIs $75k-100k, 2.2% for AGIs $100k-200k, 3.1% for AGIs over 200k)
Taxes paid: $6,926 (reported on 27.1% of returns)
78636:
$6,926
State:
$6,921
(% of AGI for various income ranges: 2.5% for AGIs below $25k, 1.9% for AGIs $25k-50k, 2.5% for AGIs $50k-75k, 2.9% for AGIs $75k-100k, 3.1% for AGIs $100k-200k, 2.7% for AGIs over 200k)
Earned income credit: $2,138 (reported on 17.1% of returns)
Here:
$2,138
State:
$2,570
(% of AGI for various income ranges: 5.9% for AGIs below $25k, 1.2% for AGIs $25k-50k)
Percentage of individuals using paid preparers for their 2012 taxes: 54.1%
Here:
54%
State:
51%
(% for various income ranges: 50.8% for AGIs below $25k, 52.6% for AGIs $25k-50k, 53.8% for AGIs $50k-75k, 55.6% for AGIs $75k-100k, 61.1% for AGIs $100k-200k, 71.4% for AGIs over 200k)
Averages for the 2004 tax year for zip code 78636, filed in 2005:
Average Adjusted Gross Income (AGI) in 2004: $44,313 (Individual Income Tax Returns)
Here:
$44,313
State:
$47,881
Salary/wage: $39,572 (reported on 76.5% of returns)
Here:
$39,572
State:
$41,947
(% of AGI for various income ranges: 880.1% for AGIs below $10k, 66.4% for AGIs $10k-25k, 73.8% for AGIs $25k-50k, 74.5% for AGIs $50k-75k, 78.5% for AGIs $75k-100k, 50.8% for AGIs over 100k)
Taxable interest for individuals: $3,439 (reported on 47.1% of returns)
This zip code:
$3,439
Texas:
$2,255
(% of AGI for various income ranges: 77.1% for AGIs below $10k, 4.8% for AGIs $10k-25k, 2.2% for AGIs $25k-50k, 1.0% for AGIs $50k-75k, 1.1% for AGIs $75k-100k, 6.2% for AGIs over 100k)
Taxable dividends: $3,868 (reported on 20.9% of returns)
Here:
$3,868
State:
$4,261
(% of AGI for various income ranges: 17.4% for AGIs below $10k, 1.4% for AGIs $10k-25k, 0.9% for AGIs $25k-50k, 0.6% for AGIs $50k-75k, 0.3% for AGIs $75k-100k, 3.7% for AGIs over 100k)
Net capital gain/loss: +$18,370 (reported on 20.5% of returns)
Here:
+$18,370
State:
+$16,110
(% of AGI for various income ranges: -4.5% for AGIs below $10k, -0.4% for AGIs $10k-25k, 0.8% for AGIs $25k-50k, 1.0% for AGIs $50k-75k, 1.8% for AGIs $75k-100k, 23.0% for AGIs over 100k)
Profit/loss from business: +$7,898 (reported on 25.2% of returns)
Here:
+$7,898
State:
+$11,013
(% of AGI for various income ranges: 53.2% for AGIs below $10k, 9.0% for AGIs $10k-25k, 4.5% for AGIs $25k-50k, 3.6% for AGIs $50k-75k, 5.3% for AGIs $75k-100k, 3.1% for AGIs over 100k)
IRA payment deduction: $2,974 (reported on 2.4% of returns)
78636:
$2,974
Texas:
$3,120
(% of AGI for various income ranges: 0.4% for AGIs $10k-25k, 0.2% for AGIs $50k-75k, 0.6% for AGIs $75k-100k)
Total itemized deductions: $18,849 (23% of AGI, reported on 25.5% of returns)
Here:
$18,849
State:
$19,631
Here:
23.4% of AGI
State:
18.9% of AGI
(% of AGI for various income ranges: 121.4% for AGIs below $10k, 10.9% for AGIs $10k-25k, 10.2% for AGIs $25k-50k, 11.6% for AGIs $50k-75k, 12.2% for AGIs $75k-100k, 9.4% for AGIs over 100k)
Charity contributions deductions: $3,917 (4% of AGI, reported on 20.2% of returns)
Here:
$3,917
State:
$4,753
Here:
4.4% of AGI
State:
4.2% of AGI
(% of AGI for various income ranges: 1.3% for AGIs $10k-25k, 1.2% for AGIs $25k-50k, 1.8% for AGIs $50k-75k, 2.3% for AGIs $75k-100k, 2.1% for AGIs over 100k)
Total tax: $6,716 (reported on 75.8% of returns)
78636:
$6,716
State:
$9,058
(% of AGI for various income ranges: 29.4% for AGIs below $10k, 4.4% for AGIs $10k-25k, 6.5% for AGIs $25k-50k, 9.2% for AGIs $50k-75k, 11.1% for AGIs $75k-100k, 17.9% for AGIs over 100k)
Earned income credit: $1,918 (reported on 14.9% of returns)
Here:
$1,918
State:
$2,024
Percentage of individuals using paid preparers for their 2004 taxes: 62.1%
Here:
62%
State:
57%
(% for various income ranges: 53.9% for AGIs below $10k, 66.0% for AGIs $10k-25k, 60.0% for AGIs $25k-50k, 63.0% for AGIs $50k-75k, 69.4% for AGIs $75k-100k, 71.6% for AGIs over 100k)
Household received Food Stamps/SNAP in the past 12 months: 121 Household did not receive Food Stamps/SNAP in the past 12 months: 1,638
Women who had a birth in the past 12 months: 29 (12 now married, 16 unmarried) Women who did not have a birth in the past 12 months: 598 (260 now married, 337 unmarried)
Housing units in zip code 78636 with a mortgage: 457 (9 second mortgage, 4 both second mortgage and home equity loan) Median monthly owner costs for units with a mortgage: $1,680 Median monthly owner costs for units without a mortgage: $621
Residents with income below the poverty level in 2022:
This zip code:
10.6%
Whole state:
14.0%
Residents with income below 50% of the poverty level in 2022:
This zip code:
7.1%
Whole state:
7.4%
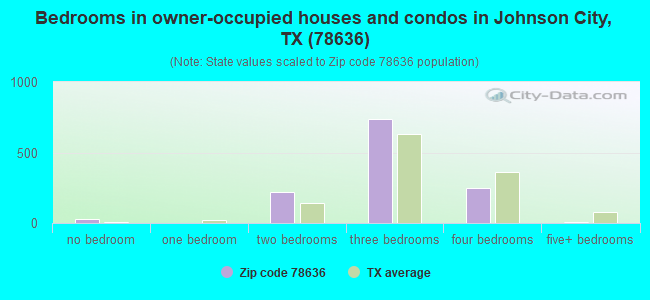
Median number of rooms in houses and condos:
Here:
6.1
State:
6.3
Median number of rooms in apartments:
Here:
4.2
State:
4.0
Notable locations in this zip code not listed on our city pages
Notable locations in zip code 78636: West Ranch (A), Circle Bar Ranch (B), Robinson Community Hall (C), Rocky Creek Ranch (D), Duval County Library (E), Johnson City Volunteer Fire Department (F), North Blanco County Emergency Medical Services (G), Happy Old Folks Home (H), Round Mountain Stage-Coach Inn and Stable (I). Display/hide their locations on the map
Streams, rivers, and creeks: Yeager Creek (A), Williams Creek (B), Walker Branch (C), Turkey Creek (D), Town Creek (E), Towhead Creek (F), Sycamore Creek (G), Smith Spring Branch (H), Rocky Creek (I). Display/hide their locations on the map
In group quarters: 74 (-1 institutionalized population)
Size of family households: 703 2-persons, 135 3-persons, 103 4-persons, 114 5-persons, 13 6-persons, 13 7-or-more-persons
Size of nonfamily households: 654 1-person, 36 2-persons
292 married couples with children.
222 single-parent households (55 men, 167 women).
88.8% of residents of 78636 zip code speak English at home.
9.9% of residents speak Spanish at home (64% very well, 28% well, 1% not well, 7% not at all).
1.0% of residents speak other Indo-European language at home (100% very well).
1.0% of residents speak Asian or Pacific Island language at home (35% very well, 65% well).
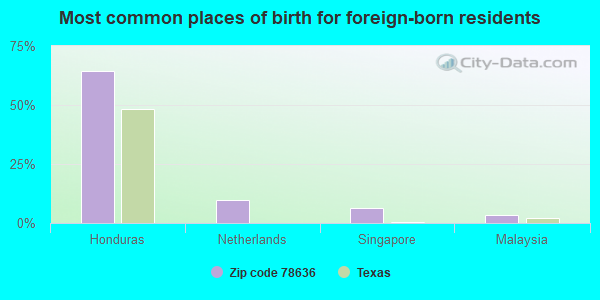
Foreign born population: 248 (6.8%) (66.1% of them are naturalized citizens)
This zip code:
6.8%
Whole state:
17.2%
64%Honduras
10%Netherlands
6%Singapore
3%Malaysia
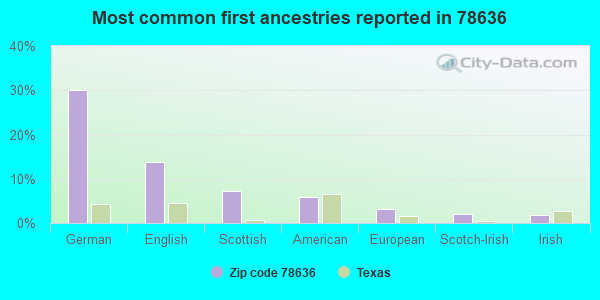
30%German
14%English
7%Scottish
6%American
3%European
2%Scotch-Irish
2%Irish
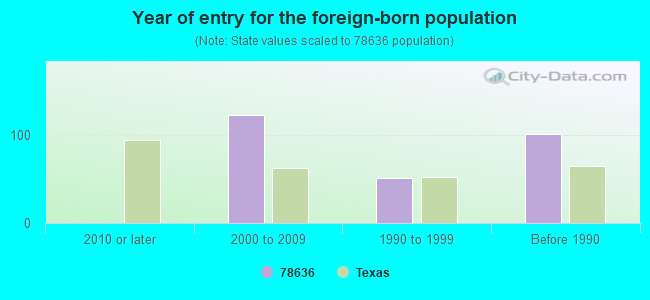
Year of entry for the foreign-born population
02010 or later
1232000 to 2009
511990 to 1999
101Before 1990
Housing units lacking complete plumbing facilities: 2.2% Housing units lacking complete kitchen facilities: 2.2%
81.7%Electricity
14.6%Bottled, tank, or LP gas
2.2%Utility gas
1.6%Wood
Population in 1990: 2,219. Population change in the 1990s: +1,098 (+49.5%).
Place of birth for U.S.-born residents:
This state: 2,352
Northeast: 139
Midwest: 288
South: 270
West: 327
53% of the 78636 zip code residents lived in the same house 5 years ago. Out of people who lived in different houses, 35% lived in this county. Out of people who lived in different counties, 50% lived in Texas.
90% of the 78636 zip code residents lived in the same house 1 year ago. Out of people who lived in different houses, 31% moved from this county. Out of people who lived in different houses, 69% moved from different county within same state. Out of people who lived in different houses, 1% moved from abroad.
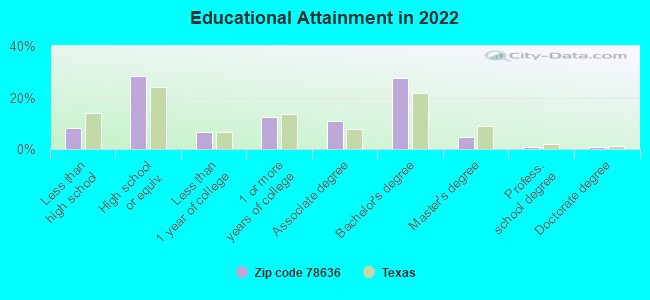
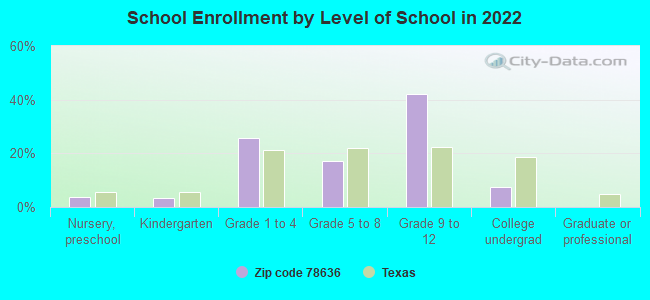
Private vs. public school enrollment:
Students in private schools in grades 1 to 8 (elementary and middle school):
Here:
0.0%
Texas:
8.8%
Students in private schools in grades 9 to 12 (high school):
Here:
0.0%
Texas:
8.0%
Students in private undergraduate colleges:
Here:
0.0%
Texas:
16.2%
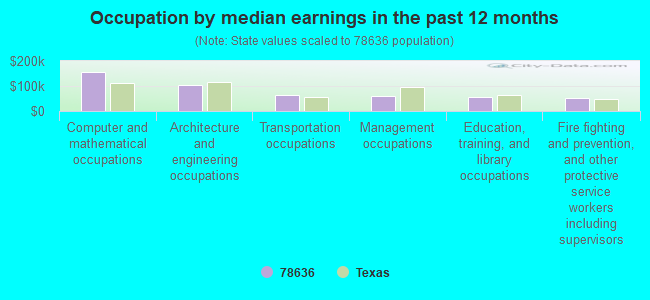
Occupation by median earnings in the past 12 months ($)
155,118Computer and mathematical occupations
103,512Architecture and engineering occupations
63,488Transportation occupations
60,000Management occupations
55,446Education, training, and library occupations
51,809Fire fighting and prevention, and other protective service workers including supervisors
Top industries in this zip code by the number of employees in 2005:
Utilities: Electric Power Distribution (100-249 employees: 2 establishments)

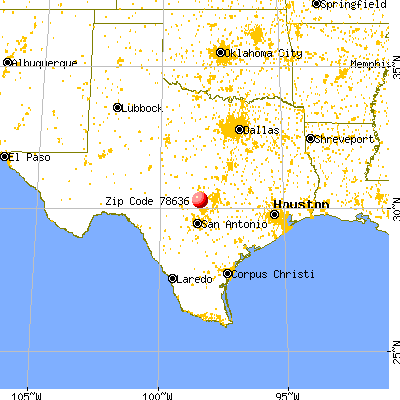


 Nearest zip codes: 78663, 78635, 78657, 78671, 78606, 78620.