Averages for the 2020 tax year for zip code 78372, filed in 2021:
Average Adjusted Gross Income (AGI) in 2020: $58,840 (Individual Income Tax Returns)
Here:
$58,840
State:
$77,054
Salary/wage: $52,268 (reported on 83.7% of returns)
Here:
$52,268
State:
$62,766
(% of AGI for various income ranges: 1114.2% for AGIs below $25k, 3391.1% for AGIs $25k-50k, 6200.4% for AGIs $50k-75k, 9552.4% for AGIs $75k-100k, 16526.7% for AGIs $100k-200k, 43236.7% for AGIs over 200k)
Taxable interest for individuals: $1,127 (reported on 19.8% of returns)
This zip code:
$1,127
Texas:
$2,665
(% of AGI for various income ranges: 9.6% for AGIs below $25k, 6.8% for AGIs $25k-50k, 22.1% for AGIs $50k-75k, 70.0% for AGIs $75k-100k, 28.3% for AGIs $100k-200k, 716.7% for AGIs over 200k)
Ordinary dividends: $4,568 (reported on 8.5% of returns)
Here:
$4,568
State:
$10,044
(% of AGI for various income ranges: 4.4% for AGIs below $25k, 11.5% for AGIs $25k-50k, 73.6% for AGIs $50k-75k, 52.9% for AGIs $75k-100k, 37.9% for AGIs $100k-200k, 1743.3% for AGIs over 200k)
Net capital gain/loss in AGI: +$11,900 (reported on 8.5% of returns)
Here:
+$11,900
State:
+$39,590
(% of AGI for various income ranges: 3.6% for AGIs below $25k, 16.6% for AGIs $25k-50k, 47.9% for AGIs $50k-75k, 235.9% for AGIs $75k-100k, 296.7% for AGIs $100k-200k, 4183.3% for AGIs over 200k)
Profit/loss from business: +$6,129 (reported on 20.2% of returns)
Here:
+$6,129
State:
+$10,888
(% of AGI for various income ranges: 134.1% for AGIs below $25k, 136.8% for AGIs $25k-50k, 84.3% for AGIs $50k-75k, 31.8% for AGIs $75k-100k, 469.2% for AGIs $100k-200k)
Taxable individual retirement arrangement distribution: $17,877 (reported on 5.0% of returns)
78372:
$17,877
Texas:
$24,740
(% of AGI for various income ranges: 20.0% for AGIs below $25k, 99.2% for AGIs $25k-50k, 118.6% for AGIs $50k-75k, 317.6% for AGIs $75k-100k, 320.8% for AGIs $100k-200k)
Total itemized deductions: $34,245 (reported on 4.3% of returns)
Here:
$34,245
State:
$40,428
(% of AGI for various income ranges: 224.3% for AGIs $25k-50k, 368.8% for AGIs $75k-100k, 812.9% for AGIs $100k-200k)
Charity contributions: $11,943 (reported on 2.7% of returns)
Here:
$11,943
State:
$18,201
(% of AGI for various income ranges: 44.5% for AGIs $25k-50k, 250.0% for AGIs $100k-200k)
Taxes paid: $6,411 (reported on 3.5% of returns)
78372:
$6,411
State:
$7,821
(% of AGI for various income ranges: 27.2% for AGIs $25k-50k, 77.6% for AGIs $75k-100k, 125.4% for AGIs $100k-200k)
Earned income credit: $2,859 (reported on 24.4% of returns)
Here:
$2,859
State:
$2,584
(% of AGI for various income ranges: 160.3% for AGIs below $25k, 104.0% for AGIs $25k-50k)
Percentage of individuals using paid preparers for their 2020 taxes: 93.0%
Here:
93%
State:
92%
(% for various income ranges: 92.6% for AGIs below $25k, 92.1% for AGIs $25k-50k, 94.4% for AGIs $50k-75k, 91.3% for AGIs $75k-100k, 97.1% for AGIs $100k-200k, 85.7% for AGIs over 200k)
Averages for the 2012 tax year for zip code 78372, filed in 2013:
Average Adjusted Gross Income (AGI) in 2012: $57,774 (Individual Income Tax Returns)
Here:
$57,774
State:
$65,384
Salary/wage: $49,893 (reported on 86.4% of returns)
Here:
$49,893
State:
$52,524
(% of AGI for various income ranges: 79.2% for AGIs below $25k, 83.5% for AGIs $25k-50k, 90.1% for AGIs $50k-75k, 87.4% for AGIs $75k-100k, 86.5% for AGIs $100k-200k, 33.4% for AGIs over 200k)
Taxable interest for individuals: $804 (reported on 21.2% of returns)
This zip code:
$804
Texas:
$2,372
(% of AGI for various income ranges: 0.5% for AGIs below $25k, 0.5% for AGIs $25k-50k, 0.2% for AGIs $50k-75k, 0.2% for AGIs $75k-100k, 0.2% for AGIs $100k-200k, 0.3% for AGIs over 200k)
Ordinary dividends: $2,615 (reported on 8.0% of returns)
Here:
$2,615
State:
$9,721
(% of AGI for various income ranges: 0.7% for AGIs below $25k, 0.5% for AGIs $25k-50k, 0.4% for AGIs $50k-75k, 0.3% for AGIs $75k-100k, 0.5% for AGIs $100k-200k)
Net capital gain/loss in AGI: +$7,425 (reported on 6.4% of returns)
Here:
+$7,425
State:
+$35,319
(% of AGI for various income ranges: 0.4% for AGIs $25k-50k, 0.3% for AGIs $50k-75k, 1.4% for AGIs $100k-200k, 1.7% for AGIs over 200k)
Profit/loss from business: +$10,021 (reported on 19.2% of returns)
Here:
+$10,021
State:
+$13,732
(% of AGI for various income ranges: 8.9% for AGIs below $25k, 4.0% for AGIs $25k-50k, 3.0% for AGIs $50k-75k, 3.6% for AGIs $75k-100k, 3.9% for AGIs $100k-200k)
Taxable individual retirement arrangement distribution: $9,692 (reported on 4.8% of returns)
78372:
$9,692
Texas:
$19,511
(% of AGI for various income ranges: 0.9% for AGIs below $25k, 1.3% for AGIs $25k-50k, 1.6% for AGIs $50k-75k, 1.1% for AGIs $100k-200k)
Total itemized deductions: $20,286 (16% of AGI, reported on 16.8% of returns)
Here:
$20,286
State:
$24,724
Here:
16.0% of AGI
State:
15.9% of AGI
(% of AGI for various income ranges: 4.0% for AGIs below $25k, 5.2% for AGIs $25k-50k, 6.9% for AGIs $50k-75k, 7.3% for AGIs $75k-100k, 7.0% for AGIs $100k-200k, 4.2% for AGIs over 200k)
Charity contributions: $4,322 (reported on 10.8% of returns)
Here:
$4,322
State:
$6,808
(% of AGI for various income ranges: 0.8% for AGIs $25k-50k, 0.8% for AGIs $50k-75k, 0.6% for AGIs $75k-100k, 0.9% for AGIs $100k-200k, 1.1% for AGIs over 200k)
Taxes paid: $4,134 (reported on 15.2% of returns)
78372:
$4,134
State:
$6,921
(% of AGI for various income ranges: 0.7% for AGIs below $25k, 0.8% for AGIs $25k-50k, 1.2% for AGIs $50k-75k, 1.1% for AGIs $75k-100k, 1.4% for AGIs $100k-200k, 0.9% for AGIs over 200k)
Earned income credit: $2,843 (reported on 26.0% of returns)
Here:
$2,843
State:
$2,570
(% of AGI for various income ranges: 11.9% for AGIs below $25k, 1.9% for AGIs $25k-50k)
Percentage of individuals using paid preparers for their 2012 taxes: 56.4%
Here:
56%
State:
51%
(% for various income ranges: 50.5% for AGIs below $25k, 57.4% for AGIs $25k-50k, 55.6% for AGIs $50k-75k, 56.5% for AGIs $75k-100k, 70.0% for AGIs $100k-200k, 83.3% for AGIs over 200k)
Averages for the 2004 tax year for zip code 78372, filed in 2005:
Average Adjusted Gross Income (AGI) in 2004: $34,443 (Individual Income Tax Returns)
Here:
$34,443
State:
$47,881
Salary/wage: $34,356 (reported on 86.0% of returns)
Here:
$34,356
State:
$41,947
(% of AGI for various income ranges: 159.8% for AGIs below $10k, 80.3% for AGIs $10k-25k, 90.3% for AGIs $25k-50k, 90.7% for AGIs $50k-75k, 90.7% for AGIs $75k-100k, 67.4% for AGIs over 100k)
Taxable interest for individuals: $1,410 (reported on 22.7% of returns)
This zip code:
$1,410
Texas:
$2,255
(% of AGI for various income ranges: 6.6% for AGIs below $10k, 1.2% for AGIs $10k-25k, 0.5% for AGIs $25k-50k, 0.2% for AGIs $50k-75k, 0.4% for AGIs $75k-100k, 2.0% for AGIs over 100k)
Taxable dividends: $1,194 (reported on 8.8% of returns)
Here:
$1,194
State:
$4,261
(% of AGI for various income ranges: 2.4% for AGIs below $10k, 0.4% for AGIs $10k-25k, 0.2% for AGIs $25k-50k, 0.1% for AGIs $50k-75k, 0.1% for AGIs $75k-100k, 0.5% for AGIs over 100k)
Net capital gain/loss: +$2,557 (reported on 8.8% of returns)
Here:
+$2,557
State:
+$16,110
(% of AGI for various income ranges: -1.9% for AGIs below $10k, 0.4% for AGIs $10k-25k, 0.1% for AGIs $25k-50k, -0.1% for AGIs $50k-75k, 0.3% for AGIs $75k-100k, 2.9% for AGIs over 100k)
Profit/loss from business: +$4,011 (reported on 17.9% of returns)
Here:
+$4,011
State:
+$11,013
(% of AGI for various income ranges: -3.1% for AGIs below $10k, 4.9% for AGIs $10k-25k, 3.1% for AGIs $25k-50k, 3.0% for AGIs $50k-75k, -0.1% for AGIs $75k-100k, 0.1% for AGIs over 100k)
IRA payment deduction: $2,909 (reported on 1.1% of returns)
78372:
$2,909
Texas:
$3,120
Total itemized deductions: $16,246 (24% of AGI, reported on 13.5% of returns)
Here:
$16,246
State:
$19,631
Here:
24.3% of AGI
State:
18.9% of AGI
(% of AGI for various income ranges: 6.1% for AGIs $10k-25k, 6.1% for AGIs $25k-50k, 6.6% for AGIs $50k-75k, 6.4% for AGIs $75k-100k, 7.2% for AGIs over 100k)
Charity contributions deductions: $2,571 (4% of AGI, reported on 10.2% of returns)
Here:
$2,571
State:
$4,753
Here:
3.5% of AGI
State:
4.2% of AGI
(% of AGI for various income ranges: 0.6% for AGIs $10k-25k, 0.6% for AGIs $25k-50k, 0.5% for AGIs $50k-75k, 0.7% for AGIs $75k-100k, 1.4% for AGIs over 100k)
Total tax: $4,823 (reported on 65.3% of returns)
78372:
$4,823
State:
$9,058
(% of AGI for various income ranges: 5.3% for AGIs below $10k, 3.3% for AGIs $10k-25k, 5.9% for AGIs $25k-50k, 8.3% for AGIs $50k-75k, 11.0% for AGIs $75k-100k, 16.9% for AGIs over 100k)
Earned income credit: $2,134 (reported on 28.2% of returns)
Here:
$2,134
State:
$2,024
Percentage of individuals using paid preparers for their 2004 taxes: 60.5%
Here:
61%
State:
57%
(% for various income ranges: 55.6% for AGIs below $10k, 62.3% for AGIs $10k-25k, 59.3% for AGIs $25k-50k, 62.5% for AGIs $50k-75k, 62.3% for AGIs $75k-100k, 74.5% for AGIs over 100k)
Household received Food Stamps/SNAP in the past 12 months: 241 Household did not receive Food Stamps/SNAP in the past 12 months: 1,567
Women who had a birth in the past 12 months: 94 (72 now married, 21 unmarried) Women who did not have a birth in the past 12 months: 755 (493 now married, 256 unmarried)
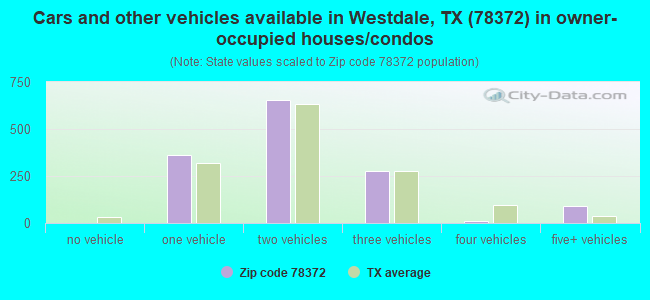
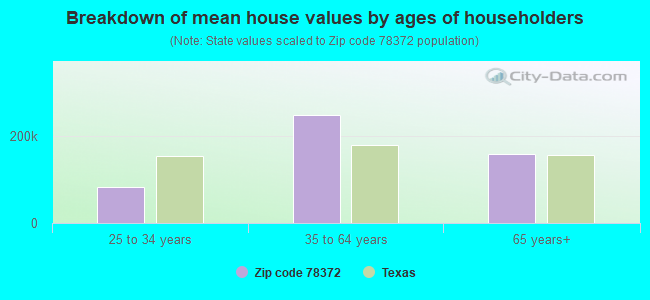
Housing units in zip code 78372 with a mortgage: 495 Median monthly owner costs for units with a mortgage: $1,230 Median monthly owner costs for units without a mortgage: $370
Residents with income below the poverty level in 2022:
This zip code:
17.4%
Whole state:
14.0%
Residents with income below 50% of the poverty level in 2022:
This zip code:
14.2%
Whole state:
7.4%
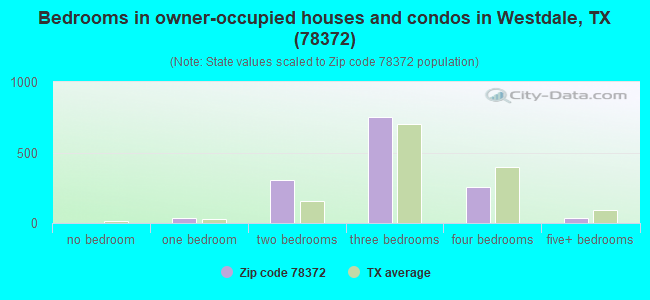
Median number of rooms in houses and condos:
Here:
5.4
State:
6.3
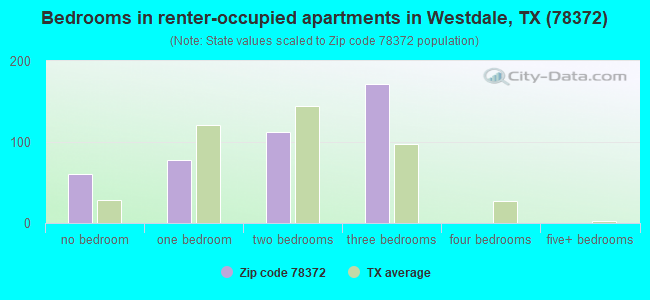
Median number of rooms in apartments:
Here:
3.9
State:
4.0
Notable locations in this zip code not listed on our city pages
Notable locations in zip code 78372: Anna Rose (A), Blanca Windmill (B), Calabaza Windmill (C), Conejo Windmill (D), Foster Windmill (E), Freeborn Ranch (F), Lagarto Windmill (G), Laguna Windmill (H), Las Pilas Windmill (I), Longoria Windmill (J), Mendiates Windmill (K), Patterson Windmill (L), Penitas Ranch (M), Rancho de la Parrita (N), Williams Windmill (O), Orange Grove Volunteer Fire Department (P), Jim Wells County Sheriff's Office (Q), Orange Grove Police Department (R). Display/hide their locations on the map
Cemeteries: Adams Cemetery (1), Dilworth Cemetery (2), Wade Cemetery (3), McNeill Cemetery (4), Reynolds Cemetery (5). Display/hide their locations on the map
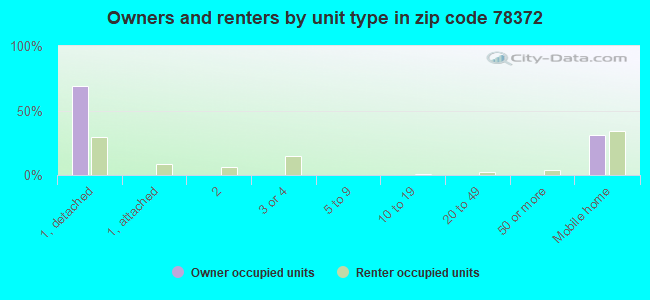
Size of family households: 440 2-persons, 276 3-persons, 288 4-persons, 205 5-persons, 49 6-persons
Size of nonfamily households: 409 1-person, 133 2-persons
1,134 married couples with children.
180 single-parent households (24 men, 156 women).
58.7% of residents of 78372 zip code speak English at home.
36.8% of residents speak Spanish at home (85% very well, 9% well, 4% not well, 2% not at all).
0.2% of residents speak other Indo-European language at home (100% very well).
5.1% of residents speak other language at home (100% very well).
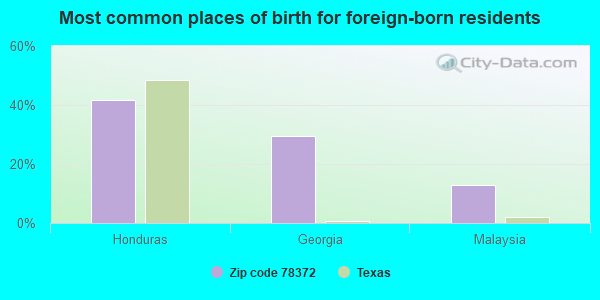
Foreign born population: 425 (8.3%) (56.7% of them are naturalized citizens)
This zip code:
8.3%
Whole state:
17.2%
42%Honduras
29%Georgia
13%Malaysia
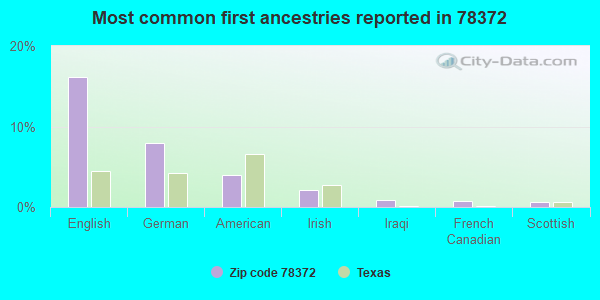
16%English
8%German
4%American
2%Irish
1%Iraqi
1%French Canadian
1%Scottish
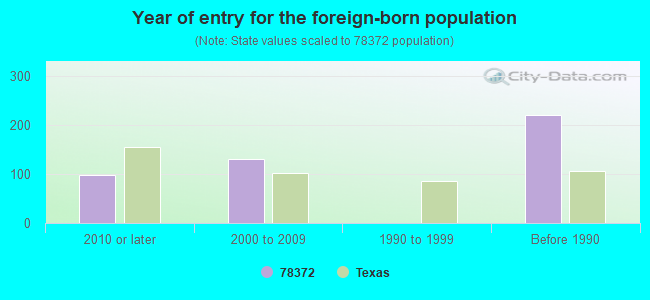
Year of entry for the foreign-born population
982010 or later
1302000 to 2009
01990 to 1999
221Before 1990
Housing units lacking complete plumbing facilities: 12.3% Housing units lacking complete kitchen facilities: 8.8%
85.9%Electricity
8.7%Bottled, tank, or LP gas
3.5%Utility gas
2.0%Other fuel
Population in 1990: 4,339. Population change in the 1990s: +322 (+7.4%).
Place of birth for U.S.-born residents:
This state: 4,226
Northeast: 65
Midwest: 85
South: 179
West: 61
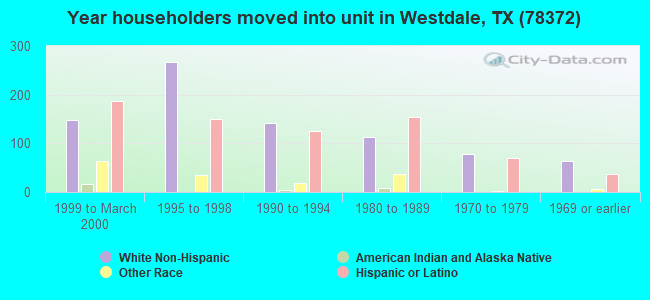
57% of the 78372 zip code residents lived in the same house 5 years ago. Out of people who lived in different houses, 46% lived in this county. Out of people who lived in different counties, 50% lived in Texas.
93% of the 78372 zip code residents lived in the same house 1 year ago. Out of people who lived in different houses, 41% moved from this county. Out of people who lived in different houses, 38% moved from different county within same state. Out of people who lived in different houses, 23% moved from different state.
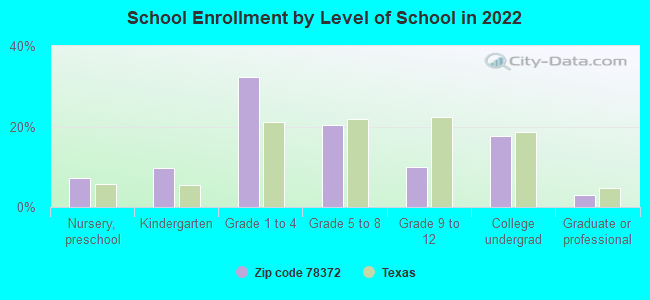
Private vs. public school enrollment:
Students in private schools in grades 1 to 8 (elementary and middle school): 213
Here:
34.8%
Texas:
8.8%
Students in private schools in grades 9 to 12 (high school):
Here:
0.0%
Texas:
8.0%
Students in private undergraduate colleges: 21
Here:
10.8%
Texas:
16.2%
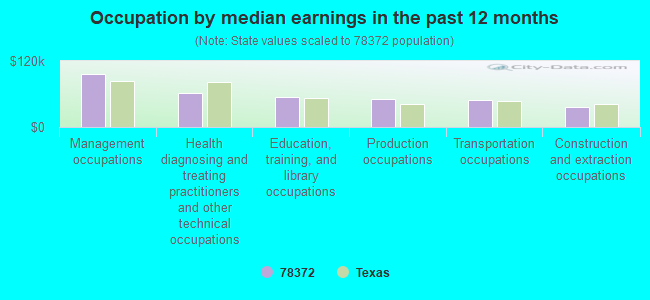
Occupation by median earnings in the past 12 months ($)
95,862Management occupations
61,583Health diagnosing and treating practitioners and other technical occupations
54,043Education, training, and library occupations
50,955Production occupations
48,638Transportation occupations
36,549Construction and extraction occupations
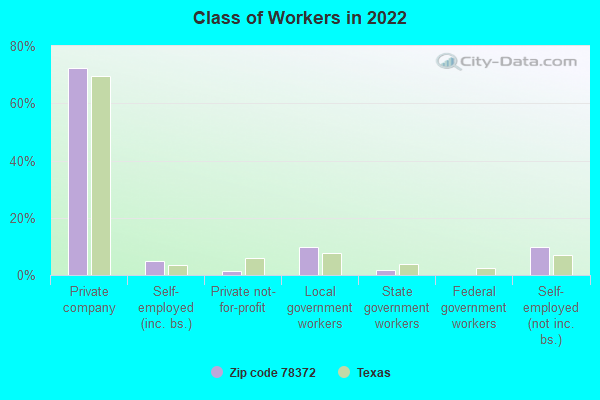
Top industries in this zip code by the number of employees in 2005:
Mining: Support Activities for Oil and Gas Operations (10-19 employees: 2 establishments, 5-9 employees: 1 establishment, 1-4 employees: 1 establishment)
Accommodation and Food Services: Food Service Contractors (20-49: 1)
Accommodation and Food Services: Limited-Service Restaurants (20-49: 1)
Management of Companies and Enterprises: Corporate, Subsidiary, and Regional Managing Offices (10-19: 1)
People in group quarters in 2000:
6 people in homes for the mentally retarded
Fatal accident statistics in 2014:
Fatal accident count: 2
Vehicles involved in fatal accidents: 3
Fatal accidents caused by drunken drivers: 1
Fatalities: 2
Persons involved in fatal accidents: 3
Pedestrians involved in fatal accidents: 0
Fatal accident statistics in 2013:
Fatal accident count: 2
Vehicles involved in fatal accidents: 3
Fatal accidents caused by drunken drivers: 0
Fatalities: 2
Persons involved in fatal accidents: 5
Pedestrians involved in fatal accidents: 0
2006 - 2018 National Fire Incident Reporting System (NFIRS) incidents
Based on the data from the years 2006 - 2018 the average number of fires per year is 33. The highest number of reported fires - 114 took place in 2011, and the least - 0 in 2015. The data has an increasing trend.
When looking into fire subcategories, the most incidents belonged to: Outside Fires (73.4%), and Structure Fires (16.9%).
Fire incident types reported to NFIRS in Zip Code 78372

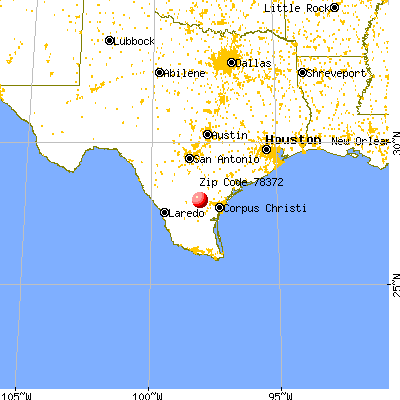


 Nearest zip codes: 78383, 78332, 78022, 78368, 78330, 78342.
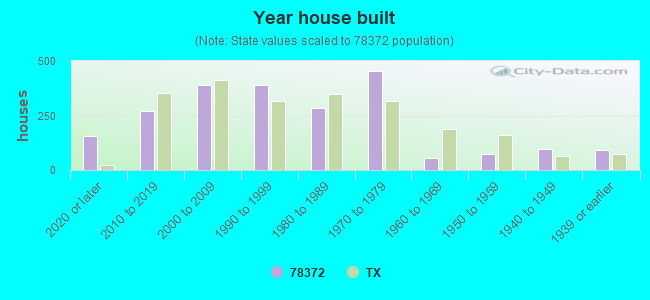


 Based on the data from the years 2006 - 2018 the average number of fires per year is 33. The highest number of reported fires - 114 took place in 2011, and the least - 0 in 2015. The data has an increasing trend.
 When looking into fire subcategories, the most incidents belonged to: Outside Fires (73.4%), and Structure Fires (16.9%).