Estimated zip code population in 2022: 13,725 Zip code population in 2010: 13,638 Zip code population in 2000: 13,346
Houses and condos: 6,017 Renter-occupied apartments: 1,758
% of renters here:
30%
State:
38%
March 2022 cost of living index in zip code 78248: 88.4 (less than average, U.S. average is 100)
Land area: 3.9 sq. mi. Water area: 0.0 sq. mi.
Population density: 3,501 people per square mile
(average).
OSM Map
General Map
Google Map
MSN Map
OSM Map
General Map
Google Map
MSN Map
OSM Map
General Map
Google Map
MSN Map
OSM Map
General Map
Google Map
MSN Map
Please wait while loading the map...
Real estate property taxes paid for housing units in 2022:
This zip code:
1.9% ($9,532)
Texas:
1.5% ($4,050)
Median real estate property taxes paid for housing units with mortgages in 2022: $9,794 (2.0%) Median real estate property taxes paid for housing units with no mortgage in 2022: $9,356 (1.9%)
Estimated median house/condo value in 2022: $491,670
78248:
$491,670
Texas:
$275,400
According to our research of Texas and other state lists, there were 3 registered sex offenders living in 78248 zip code as of July 16, 2024. The ratio of all residents to sex offenders in zip code 78248 is 4,807 to 1. The ratio of registered sex offenders to all residents in this zip code is much lower than the state average.
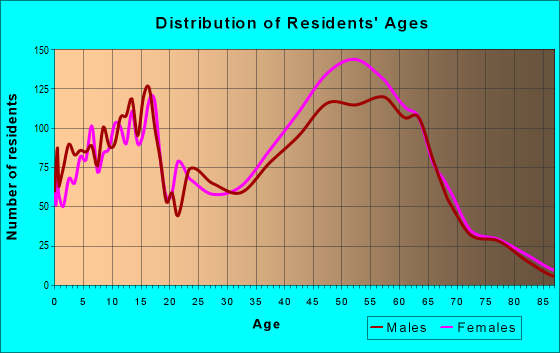
Median resident age:
This zip code:
43.4 years
Texas median age:
35.6 years
Average household size:
This zip code:
2.3 people
Texas:
2.6 people
Averages for the 2020 tax year for zip code 78248, filed in 2021:
Average Adjusted Gross Income (AGI) in 2020: $152,813 (Individual Income Tax Returns)
Here:
$152,813
State:
$77,054
Salary/wage: $115,948 (reported on 77.2% of returns)
Here:
$115,948
State:
$62,766
(% of AGI for various income ranges: 1087.4% for AGIs below $25k, 3449.6% for AGIs $25k-50k, 5984.5% for AGIs $50k-75k, 8257.2% for AGIs $75k-100k, 17766.9% for AGIs $100k-200k, 80905.9% for AGIs over 200k)
Taxable interest for individuals: $3,154 (reported on 49.6% of returns)
This zip code:
$3,154
Texas:
$2,665
(% of AGI for various income ranges: 33.2% for AGIs below $25k, 45.1% for AGIs $25k-50k, 87.1% for AGIs $50k-75k, 193.1% for AGIs $75k-100k, 273.8% for AGIs $100k-200k, 1465.2% for AGIs over 200k)
Ordinary dividends: $12,967 (reported on 40.1% of returns)
Here:
$12,967
State:
$10,044
(% of AGI for various income ranges: 63.8% for AGIs below $25k, 112.7% for AGIs $25k-50k, 235.5% for AGIs $50k-75k, 477.2% for AGIs $75k-100k, 734.3% for AGIs $100k-200k, 5574.1% for AGIs over 200k)
Net capital gain/loss in AGI: +$32,062 (reported on 37.6% of returns)
Here:
+$32,062
State:
+$39,590
(% of AGI for various income ranges: 60.2% for AGIs below $25k, 90.0% for AGIs $25k-50k, 172.4% for AGIs $50k-75k, 380.8% for AGIs $75k-100k, 738.2% for AGIs $100k-200k, 16372.7% for AGIs over 200k)
Profit/loss from business: +$30,945 (reported on 22.3% of returns)
Here:
+$30,945
State:
+$10,888
(% of AGI for various income ranges: 157.3% for AGIs below $25k, 193.4% for AGIs $25k-50k, 430.4% for AGIs $50k-75k, 607.2% for AGIs $75k-100k, 1209.2% for AGIs $100k-200k, 6594.5% for AGIs over 200k)
Taxable individual retirement arrangement distribution: $28,852 (reported on 14.8% of returns)
78248:
$28,852
Texas:
$24,740
(% of AGI for various income ranges: 85.0% for AGIs below $25k, 149.7% for AGIs $25k-50k, 373.9% for AGIs $50k-75k, 728.9% for AGIs $75k-100k, 1171.2% for AGIs $100k-200k, 2794.5% for AGIs over 200k)
Self-employed (Keogh) retirement plans: $23,093 (reported on 2.1% of returns)
78248:
$23,093
Texas:
$29,298
(% of AGI for various income ranges: 88.3% for AGIs $100k-200k, 556.1% for AGIs over 200k)
Total itemized deductions: $41,725 (reported on 19.5% of returns)
Here:
$41,725
State:
$40,428
(% of AGI for various income ranges: 83.9% for AGIs below $25k, 170.9% for AGIs $25k-50k, 560.2% for AGIs $50k-75k, 977.2% for AGIs $75k-100k, 1472.0% for AGIs $100k-200k, 7723.0% for AGIs over 200k)
Charity contributions: $17,158 (reported on 17.3% of returns)
Here:
$17,158
State:
$18,201
(% of AGI for various income ranges: 9.8% for AGIs below $25k, 21.6% for AGIs $25k-50k, 91.4% for AGIs $50k-75k, 181.7% for AGIs $75k-100k, 425.5% for AGIs $100k-200k, 3429.5% for AGIs over 200k)
Taxes paid: $8,766 (reported on 19.5% of returns)
78248:
$8,766
State:
$7,821
(% of AGI for various income ranges: 28.2% for AGIs below $25k, 42.6% for AGIs $25k-50k, 145.1% for AGIs $50k-75k, 265.6% for AGIs $75k-100k, 411.0% for AGIs $100k-200k, 1302.5% for AGIs over 200k)
Earned income credit: $1,717 (reported on 5.1% of returns)
Here:
$1,717
State:
$2,584
(% of AGI for various income ranges: 39.0% for AGIs below $25k, 32.7% for AGIs $25k-50k)
Percentage of individuals using paid preparers for their 2020 taxes: 91.0%
Here:
91%
State:
92%
(% for various income ranges: 90.4% for AGIs below $25k, 91.9% for AGIs $25k-50k, 89.6% for AGIs $50k-75k, 88.5% for AGIs $75k-100k, 91.8% for AGIs $100k-200k, 92.1% for AGIs over 200k)
Averages for the 2012 tax year for zip code 78248, filed in 2013:
Average Adjusted Gross Income (AGI) in 2012: $131,350 (Individual Income Tax Returns)
Here:
$131,350
State:
$65,384
Salary/wage: $101,003 (reported on 81.0% of returns)
Here:
$101,003
State:
$52,524
(% of AGI for various income ranges: 73.9% for AGIs below $25k, 72.8% for AGIs $25k-50k, 64.8% for AGIs $50k-75k, 64.0% for AGIs $75k-100k, 71.1% for AGIs $100k-200k, 56.5% for AGIs over 200k)
Taxable interest for individuals: $2,718 (reported on 54.2% of returns)
This zip code:
$2,718
Texas:
$2,372
(% of AGI for various income ranges: 2.0% for AGIs below $25k, 1.6% for AGIs $25k-50k, 2.2% for AGIs $50k-75k, 1.2% for AGIs $75k-100k, 0.9% for AGIs $100k-200k, 1.1% for AGIs over 200k)
Ordinary dividends: $9,771 (reported on 40.1% of returns)
Here:
$9,771
State:
$9,721
(% of AGI for various income ranges: 4.4% for AGIs below $25k, 2.0% for AGIs $25k-50k, 2.2% for AGIs $50k-75k, 2.0% for AGIs $75k-100k, 1.9% for AGIs $100k-200k, 3.7% for AGIs over 200k)
Net capital gain/loss in AGI: +$20,549 (reported on 35.0% of returns)
Here:
+$20,549
State:
+$35,319
(% of AGI for various income ranges: 0.4% for AGIs $25k-50k, 0.8% for AGIs $50k-75k, 0.4% for AGIs $75k-100k, 1.9% for AGIs $100k-200k, 8.8% for AGIs over 200k)
Profit/loss from business: +$30,517 (reported on 22.1% of returns)
Here:
+$30,517
State:
+$13,732
(% of AGI for various income ranges: 8.4% for AGIs below $25k, 4.7% for AGIs $25k-50k, 6.5% for AGIs $50k-75k, 5.1% for AGIs $75k-100k, 4.7% for AGIs $100k-200k, 5.1% for AGIs over 200k)
Taxable individual retirement arrangement distribution: $26,663 (reported on 13.8% of returns)
78248:
$26,663
Texas:
$19,511
(% of AGI for various income ranges: 2.7% for AGIs below $25k, 2.6% for AGIs $25k-50k, 4.6% for AGIs $50k-75k, 3.9% for AGIs $75k-100k, 3.3% for AGIs $100k-200k, 2.3% for AGIs over 200k)
Self-employment retirement plans: $23,780 (reported on 2.2% of returns)
78248:
$23,780
Texas:
$23,938
(% of AGI for various income ranges: 1.1% for AGIs below $25k, 0.2% for AGIs $100k-200k, 0.6% for AGIs over 200k)
Total itemized deductions: $29,676 (14% of AGI, reported on 53.1% of returns)
Here:
$29,676
State:
$24,724
Here:
14.4% of AGI
State:
15.9% of AGI
(% of AGI for various income ranges: 14.8% for AGIs below $25k, 14.6% for AGIs $25k-50k, 16.2% for AGIs $50k-75k, 16.5% for AGIs $75k-100k, 14.2% for AGIs $100k-200k, 9.8% for AGIs over 200k)
Charity contributions: $6,520 (reported on 47.2% of returns)
Here:
$6,520
State:
$6,808
(% of AGI for various income ranges: 1.0% for AGIs below $25k, 1.5% for AGIs $25k-50k, 1.8% for AGIs $50k-75k, 2.7% for AGIs $75k-100k, 2.5% for AGIs $100k-200k, 2.4% for AGIs over 200k)
Taxes paid: $9,953 (reported on 52.8% of returns)
78248:
$9,953
State:
$6,921
(% of AGI for various income ranges: 4.0% for AGIs below $25k, 4.2% for AGIs $25k-50k, 5.3% for AGIs $50k-75k, 6.1% for AGIs $75k-100k, 5.3% for AGIs $100k-200k, 3.0% for AGIs over 200k)
Earned income credit: $1,558 (reported on 5.2% of returns)
Here:
$1,558
State:
$2,570
(% of AGI for various income ranges: 2.2% for AGIs below $25k, 0.5% for AGIs $25k-50k)
Percentage of individuals using paid preparers for their 2012 taxes: 49.1%
Here:
49%
State:
51%
(% for various income ranges: 40.5% for AGIs below $25k, 40.6% for AGIs $25k-50k, 48.1% for AGIs $50k-75k, 47.0% for AGIs $75k-100k, 51.8% for AGIs $100k-200k, 68.5% for AGIs over 200k)
Averages for the 2004 tax year for zip code 78248, filed in 2005:
Average Adjusted Gross Income (AGI) in 2004: $105,731 (Individual Income Tax Returns)
Here:
$105,731
State:
$47,881
Salary/wage: $92,030 (reported on 83.3% of returns)
Here:
$92,030
State:
$41,947
(% of AGI for various income ranges: 70.8% for AGIs $10k-25k, 73.7% for AGIs $25k-50k, 71.2% for AGIs $50k-75k, 72.6% for AGIs $75k-100k, 71.5% for AGIs over 100k)
Taxable interest for individuals: $2,352 (reported on 63.9% of returns)
This zip code:
$2,352
Texas:
$2,255
(% of AGI for various income ranges: 4.8% for AGIs $10k-25k, 2.6% for AGIs $25k-50k, 1.9% for AGIs $50k-75k, 1.6% for AGIs $75k-100k, 1.1% for AGIs over 100k)
Taxable dividends: $3,709 (reported on 46.8% of returns)
Here:
$3,709
State:
$4,261
(% of AGI for various income ranges: 3.5% for AGIs $10k-25k, 2.3% for AGIs $25k-50k, 2.1% for AGIs $50k-75k, 2.0% for AGIs $75k-100k, 1.4% for AGIs over 100k)
Net capital gain/loss: +$14,302 (reported on 41.5% of returns)
Here:
+$14,302
State:
+$16,110
(% of AGI for various income ranges: 0.6% for AGIs $10k-25k, 0.4% for AGIs $25k-50k, 0.9% for AGIs $50k-75k, 1.4% for AGIs $75k-100k, 7.0% for AGIs over 100k)
Profit/loss from business: +$27,763 (reported on 22.1% of returns)
Here:
+$27,763
State:
+$11,013
(% of AGI for various income ranges: 8.2% for AGIs $10k-25k, 5.9% for AGIs $25k-50k, 5.2% for AGIs $50k-75k, 5.8% for AGIs $75k-100k, 5.7% for AGIs over 100k)
IRA payment deduction: $3,632 (reported on 3.9% of returns)
78248:
$3,632
Texas:
$3,120
(% of AGI for various income ranges: 0.4% for AGIs $10k-25k, 0.3% for AGIs $25k-50k, 0.3% for AGIs $50k-75k, 0.3% for AGIs $75k-100k, 0.1% for AGIs over 100k)
Self-employed pension: $16,566 (reported on 3.1% of returns)
Here:
$16,566
Texas:
$16,401
(% of AGI for various income ranges: 0.3% for AGIs $25k-50k, 0.3% for AGIs $50k-75k, 0.3% for AGIs $75k-100k, 0.6% for AGIs over 100k)
Total itemized deductions: $23,304 (15% of AGI, reported on 57.4% of returns)
Here:
$23,304
State:
$19,631
Here:
15.5% of AGI
State:
18.9% of AGI
(% of AGI for various income ranges: 20.3% for AGIs $10k-25k, 18.1% for AGIs $25k-50k, 20.1% for AGIs $50k-75k, 19.5% for AGIs $75k-100k, 10.5% for AGIs over 100k)
Charity contributions deductions: $5,322 (3% of AGI, reported on 51.5% of returns)
Here:
$5,322
State:
$4,753
Here:
3.4% of AGI
State:
4.2% of AGI
(% of AGI for various income ranges: 1.4% for AGIs $10k-25k, 1.9% for AGIs $25k-50k, 2.9% for AGIs $50k-75k, 3.0% for AGIs $75k-100k, 2.6% for AGIs over 100k)
Total tax: $23,937 (reported on 84.3% of returns)
78248:
$23,937
State:
$9,058
(% of AGI for various income ranges: 5.2% for AGIs $10k-25k, 8.2% for AGIs $25k-50k, 10.1% for AGIs $50k-75k, 10.8% for AGIs $75k-100k, 21.8% for AGIs over 100k)
Earned income credit: $1,230 (reported on 4.2% of returns)
Here:
$1,230
State:
$2,024
Percentage of individuals using paid preparers for their 2004 taxes: 51.9%
Here:
52%
State:
57%
(% for various income ranges: 47.1% for AGIs below $10k, 46.7% for AGIs $10k-25k, 51.3% for AGIs $25k-50k, 51.6% for AGIs $50k-75k, 49.9% for AGIs $75k-100k, 57.2% for AGIs over 100k)
Likely homosexual households (counted as self-reported same-sex unmarried-partner households)
Lesbian couples: 0.0% of all households
Gay men: 0.3% of all households
Household received Food Stamps/SNAP in the past 12 months: 101 Household did not receive Food Stamps/SNAP in the past 12 months: 5,686
Women who had a birth in the past 12 months: 250 (255 now married, 0 unmarried) Women who did not have a birth in the past 12 months: 2,683 (1,263 now married, 1,417 unmarried)
Housing units in zip code 78248 with a mortgage: 2,376 (95 second mortgage, 103 both second mortgage and home equity loan) Houses without a mortgage: 25
Median monthly owner costs for units with a mortgage: $2,773 Median monthly owner costs for units without a mortgage: $1,246
Residents with income below the poverty level in 2022:
This zip code:
2.3%
Whole state:
14.0%
Residents with income below 50% of the poverty level in 2022:
This zip code:
0.6%
Whole state:
7.4%
Median number of rooms in houses and condos:
Here:
8.0
State:
6.3
Median number of rooms in apartments:
Here:
3.8
State:
4.0
Notable locations in this zip code not listed on our city pages
Churches in zip code 78248 include: Faith Presbyterian Church (A), Congregation Agudas Achim (B), Woodland Baptist Church (C). Display/hide their locations on the map
Tourist attraction (not listed on the city page) : Adventure Club San Antonio (Recreational Trips & Guides; 1150 N. Loop 1604 W.).
In group quarters: 74 (-1 institutionalized population)
Size of family households: 1,925 2-persons, 1,146 3-persons, 886 4-persons, 57 5-persons, 45 6-persons, 6 7-or-more-persons
Size of nonfamily households: 1,572 1-person, 188 2-persons
2,461 married couples with children.
429 single-parent households (92 men, 337 women).
80.3% of residents of 78248 zip code speak English at home.
15.8% of residents speak Spanish at home (86% very well, 13% well, 1% not well).
2.5% of residents speak other Indo-European language at home (95% very well, 4% well, 1% not well).
1.6% of residents speak Asian or Pacific Island language at home (90% very well, 8% well, 3% not well).
0.4% of residents speak other language at home (82% very well, 18% well).
Foreign born population: 1,148 (8.4%) (73.2% of them are naturalized citizens)
Housing units lacking complete plumbing facilities: 1.4% Housing units lacking complete kitchen facilities: 1.6%
54.5%Electricity
43.4%Utility gas
1.2%No fuel used
0.8%Bottled, tank, or LP gas
Population in 1990: 4,469. Population change in the 1990s: +8,877 (+198.6%).
Place of birth for U.S.-born residents:
This state: 7,831
Northeast: 629
Midwest: 1,260
South: 1,509
West: 1,140
39% of the 78248 zip code residents lived in the same house 5 years ago. Out of people who lived in different houses, 48% lived in this county. Out of people who lived in different counties, 50% lived in Texas.
91% of the 78248 zip code residents lived in the same house 1 year ago. Out of people who lived in different houses, 61% moved from this county. Out of people who lived in different houses, 28% moved from different county within same state. Out of people who lived in different houses, 9% moved from different state.
Private vs. public school enrollment:
Students in private schools in grades 1 to 8 (elementary and middle school): 315
Here:
28.8%
Texas:
8.8%
Students in private schools in grades 9 to 12 (high school): 215
Here:
28.1%
Texas:
8.0%
Students in private undergraduate colleges: 30
Here:
9.0%
Texas:
16.2%
Occupation by median earnings in the past 12 months ($)
167,131Legal occupations
116,007Life, physical, and social science occupations
109,000Computer and mathematical occupations
101,444Architecture and engineering occupations
98,844Business and financial operations occupations
98,832Management occupations
Companies with biggest federal contracts located in this zip code (SAN ANTONIO, TX):
RITE-WAY SVCS OF SAN ANTONIO (14423 TRIPLE CROWN; small business) : $6,726,905 in 21 contractsfrom 1999 to 2001
Contracts for Other Housekeeping Services, Custodial Janitorial Services by Navy, Army, Department of Veterans Affairs Signed by year:2000: $3,263,133; 2001: $3,366,192; 2002: $0; 2003: $0; 2004: $0; 2005: $0; 2006: $0.
Biggest contracts:
$2,392,033 with Navy for Other Housekeeping Services. Taking place in MS. Signed on 2001-10-01. Completion date: 2002-09-30.
$2,259,572, same as above.Signed on 2000-10-01. Completion date: 2001-09-30.
$452,727 with Navy for Other Housekeeping Services. Taking place in AZ. Signed on 2000-10-01. Completion date: 2001-09-30.
$451,515, same as above.Signed on 2001-10-01. Completion date: 2002-09-30.
INTEGRATED SYSTEMS INTERNATION (2 KENT FALLS DRIVE; small business) : $1,349,914 in 10 contractsfrom 1999 to 2001
Contracts for ADP Central Processing Unit (CPU, Computer), Digital, Maintenance, Repair and Rebuilding of Equipment -- Automatic Data Processing Equipment (Including Firmware), Software, Supplies and Support Equipment, Quality Control Services -- Electrical and Electronic Equipment Components, ADP Facility Operation and Maintenance Services, and moreby Air Force, Federal Technology Service, Navy Signed by year:2000: $949,405; 2001: $130,804; 2002: $0; 2003: $0; 2004: $0; 2005: $0; 2006: $0.
Biggest contracts:
$433,396 with Air Force for ADP Central Processing Unit (CPU, Computer), Digital. Signed on 2000-08-02. Completion date: 2000-05-06.
$269,705 with Air Force for Maintenance, Repair and Rebuilding of Equipment -- Automatic Data Processing Equipment (Including Firmware), Software, Supplies and Support Equipment. Signed on 1999-10-01. Completion date: 2000-09-30.
$220,672 with Air Force for Quality Control Services -- Electrical and Electronic Equipment Components. Signed on 2000-10-01. Completion date: 2001-09-30.
$122,273 with Air Force for ADP Central Processing Unit (CPU, Computer), Digital. Signed on 2000-08-22. Completion date: 2000-09-15.
HYPERION BIO- TECHNOLOGY INC (13302 LANGTRY ST; small business) : $688,798 in 2 contractsfrom 2004 to 2005
$588,890 with Air Force for Biomedical -- Advanced Development (R&D). Signed on 2005-09-30. Completion date: 2007-09-30.
$99,908 with Army for Other Defense -- Applied Research and Exploratory Development (R&D). Signed on 2004-09-24. Completion date: 2005-09-30.
BURGERT, JAMES (1416 CANYON EDGE; small business) : $672,000 in 5 contractsfrom 2002 to 2005
Contracts for Nursing Services by Army Signed by year:2000: $0; 2001: $0; 2002: $160,000; 2003: $165,000; 2004: $170,500; 2005: $176,500; 2006: $0.
Biggest contracts:
$176,500 with Army for Nursing Services. Signed on 2005-10-18. Completion date: 2003-09-30.
$170,500, same as above.Signed on 2004-10-05. Completion date: 2003-09-30.
$165,000, same as above.Signed on 2003-10-01. Completion date: 2003-09-30.
$160,000, same as above.Signed on 2002-10-25. Completion date: 2003-09-30.
ROBERTA F FICKE (3 LINDQUIST; small business) : $554,547 in 8 contractsfrom 1999 to 2004
Contracts for Internal Medicine Services by Army Signed by year:2000: $91,716; 2001: $89,940; 2002: $91,680; 2003: $93,516; 2004: $97,777; 2005: $0; 2006: $0.
Biggest contracts:
$98,400 with Army for Internal Medicine Services. Signed on 2004-10-05. Completion date: 2005-09-30.
$93,516, same as above.Signed on 2003-10-24. Completion date: 2004-09-30.
$91,716, same as above.Signed on 2000-11-03. Completion date: 2004-09-30.
$91,680, same as above.Signed on 2002-10-10. Completion date: 2004-09-30.
PARTOVI, SIROUS (17106 EAGLE HOLLOW DR; small business) : $281,190 in 2 contractsfrom 2004 to 2005
$187,460 with Air Force for Other Medical Services. Signed on 2004-11-01. Completion date: 2005-09-30.
$93,730, same as above.Signed on 2005-10-01. Completion date: 2006-03-31.
TEALEY, ANDREW (13306 STAIROCK; small business) : $243,500 in 4 contractsfrom 2002 to 2004
$165,000 with Army for Nursing Services. Signed on 2003-10-01. Completion date: 2003-09-30.
$161,000, same as above.Signed on 2002-10-25. Completion date: 2003-09-30.
$0, same as above.Signed on 2002-10-25. Completion date: 2003-09-30.
-$82,500, same as above.Signed on 2004-05-27. Completion date: 2003-09-30.
CHARLES L SHINN & ASSOCIATES (1145 MESA BLANCA; small business) : $178,884 in 11 contractsfrom 1999 to 2005
Contracts for Other Professional Services, Other ADP and Telecommunications Services (includes data storage on tapes, compact disks, etc.), Personnel Testing, Other Management Support Services, and moreby Army, Air Force, Bureau of the Public Debt Signed by year:2000: $74,656; 2001: $0; 2002: $0; 2003: $9,000; 2004: $33,390; 2005: -$20,612; 2006: $0.
Biggest contracts:
$82,450 with Army for Other Professional Services. Signed on 1999-12-23. Completion date: 2000-06-30.
$74,656 with Air Force for Other ADP and Telecommunications Services (includes data storage on tapes, compact disks, etc.). Signed on 2000-08-09. Completion date: 2000-01-31.
$22,000 with Army for Personnel Testing. Signed on 2003-09-23. Completion date: 2003-09-30.
$18,540 with Air Force for Other Management Support Services. Taking place in AZ. Signed on 2004-08-09. Completion date: 2004-08-20.
CARDIOLOGIC GROUP LLC (2403 KELSO; small business)
$90,000 with Air Force for ADP Systems Analysis Services. Signed on 2003-09-24. Completion date: 2004-09-23.
RG WALTER & ASSOCIATES (17318 FOUNTAIN BLUFF; small business)
$60,000 with Navy for Engineering and Technical Services. Signed on 2000-07-31. Completion date: 2001-02-26.
Top industries in this zip code by the number of employees in 2005:
Professional, Scientific, and Technical Services: Process, Physical Distribution, and Logistics Consulting Services (100-249 employees: 1 establishment, 1-4 employees: 1 establishment)
Other Services (except Public Administration): Religious Organizations (50-99: 1, 20-49: 2, 10-19: 1, 1-4: 3)
Health Care and Social Assistance: Offices of Dentists (20-49: 1, 10-19: 2, 5-9: 3, 1-4: 1)
Arts, Entertainment, and Recreation: All Other Amusement and Recreation Industries (20-49: 2)
Health Care and Social Assistance: Offices of Physicians (except Mental Health Specialists) (10-19: 1, 5-9: 3, 1-4: 9)
Other Services (except Public Administration): Beauty Salons (20-49: 1, 10-19: 1, 1-4: 1)
Accommodation and Food Services: Full-Service Restaurants (20-49: 1, 5-9: 2)
Accommodation and Food Services: Limited-Service Restaurants (20-49: 1, 1-4: 3)
Fatal accident statistics in 2013:
Fatal accident count: 1
Vehicles involved in fatal accidents: 2
Fatal accidents caused by drunken drivers: 1
Fatalities: 1
Persons involved in fatal accidents: 2
Pedestrians involved in fatal accidents: 0
Fatal accident statistics in 2012:
Fatal accident count: 1
Vehicles involved in fatal accidents: 2
Fatal accidents caused by drunken drivers: 1
Fatalities: 1
Persons involved in fatal accidents: 2
Pedestrians involved in fatal accidents: 0
Home Mortgage Disclosure Act Aggregated Statistics For Year 2009 (Based on 4 full tracts)
A) FHA, FSA/RHS & VA Home Purchase Loans
B) Conventional Home Purchase Loans
C) Refinancings
D) Home Improvement Loans
F) Non-occupant Loans on < 5 Family Dwellings (A B C & D)
G) Loans On Manufactured Home Dwelling (A B C & D)
Number
Average Value
Number
Average Value
Number
Average Value
Number
Average Value
Number
Average Value
Number
Average Value
LOANS ORIGINATED
145
$240,191
333
$215,842
822
$216,203
46
$52,267
40
$176,584
2
$240,010
APPLICATIONS APPROVED, NOT ACCEPTED
6
$223,220
16
$195,268
81
$187,677
6
$22,818
6
$114,872
0
$0
APPLICATIONS DENIED
6
$163,728
16
$217,771
156
$224,216
26
$81,793
4
$96,760
0
$0
APPLICATIONS WITHDRAWN
12
$193,637
38
$201,221
117
$206,417
18
$127,818
2
$155,805
0
$0
FILES CLOSED FOR INCOMPLETENESS
0
$0
2
$47,635
22
$189,879
0
$0
0
$0
0
$0
Aggregated Statistics For Year 2008 (Based on 4 full tracts)
A) FHA, FSA/RHS & VA Home Purchase Loans
B) Conventional Home Purchase Loans
C) Refinancings
D) Home Improvement Loans
F) Non-occupant Loans on < 5 Family Dwellings (A B C & D)
Number
Average Value
Number
Average Value
Number
Average Value
Number
Average Value
Number
Average Value
LOANS ORIGINATED
63
$241,611
457
$230,937
309
$202,437
113
$65,257
32
$127,985
APPLICATIONS APPROVED, NOT ACCEPTED
6
$223,010
48
$233,485
53
$201,242
20
$55,445
14
$198,055
APPLICATIONS DENIED
10
$179,670
40
$182,974
148
$176,091
65
$68,969
14
$113,031
APPLICATIONS WITHDRAWN
10
$165,897
65
$225,722
121
$192,036
14
$166,590
4
$233,590
FILES CLOSED FOR INCOMPLETENESS
0
$0
14
$208,041
14
$223,790
4
$40,002
0
$0
Aggregated Statistics For Year 2007 (Based on 4 full tracts)
A) FHA, FSA/RHS & VA Home Purchase Loans
B) Conventional Home Purchase Loans
C) Refinancings
D) Home Improvement Loans
F) Non-occupant Loans on < 5 Family Dwellings (A B C & D)
G) Loans On Manufactured Home Dwelling (A B C & D)
Number
Average Value
Number
Average Value
Number
Average Value
Number
Average Value
Number
Average Value
Number
Average Value
LOANS ORIGINATED
28
$250,825
790
$191,930
281
$192,456
125
$73,161
89
$130,133
0
$0
APPLICATIONS APPROVED, NOT ACCEPTED
0
$0
51
$179,592
61
$179,150
30
$43,311
12
$137,416
0
$0
APPLICATIONS DENIED
2
$243,960
105
$187,577
148
$214,611
51
$52,729
16
$171,472
0
$0
APPLICATIONS WITHDRAWN
4
$138,120
53
$177,328
83
$176,009
18
$44,642
12
$176,062
2
$134,325
FILES CLOSED FOR INCOMPLETENESS
0
$0
26
$158,834
40
$223,690
2
$29,770
10
$273,790
0
$0
Aggregated Statistics For Year 2006 (Based on 4 full tracts)
A) FHA, FSA/RHS & VA Home Purchase Loans
B) Conventional Home Purchase Loans
C) Refinancings
D) Home Improvement Loans
F) Non-occupant Loans on < 5 Family Dwellings (A B C & D)
G) Loans On Manufactured Home Dwelling (A B C & D)
Number
Average Value
Number
Average Value
Number
Average Value
Number
Average Value
Number
Average Value
Number
Average Value
LOANS ORIGINATED
22
$199,798
996
$167,851
301
$177,001
121
$54,735
144
$155,102
0
$0
APPLICATIONS APPROVED, NOT ACCEPTED
0
$0
123
$153,453
59
$163,981
20
$37,732
40
$142,412
0
$0
APPLICATIONS DENIED
4
$114,080
146
$158,381
182
$184,601
55
$91,942
47
$161,784
6
$46,093
APPLICATIONS WITHDRAWN
6
$227,418
89
$157,572
154
$196,473
20
$143,043
20
$146,596
0
$0
FILES CLOSED FOR INCOMPLETENESS
0
$0
24
$142,763
32
$165,391
2
$62,225
6
$230,272
0
$0
Aggregated Statistics For Year 2005 (Based on 4 full tracts)
A) FHA, FSA/RHS & VA Home Purchase Loans
B) Conventional Home Purchase Loans
C) Refinancings
D) Home Improvement Loans
F) Non-occupant Loans on < 5 Family Dwellings (A B C & D)
G) Loans On Manufactured Home Dwelling (A B C & D)
Number
Average Value
Number
Average Value
Number
Average Value
Number
Average Value
Number
Average Value
Number
Average Value
LOANS ORIGINATED
34
$180,160
1,073
$151,076
402
$163,881
91
$54,866
69
$146,759
0
$0
APPLICATIONS APPROVED, NOT ACCEPTED
0
$0
105
$142,850
73
$156,304
22
$76,973
20
$115,809
4
$51,440
APPLICATIONS DENIED
6
$200,173
127
$126,427
174
$165,322
51
$82,725
2
$56,300
2
$49,620
APPLICATIONS WITHDRAWN
2
$199,515
139
$152,085
154
$194,329
28
$196,716
28
$165,530
2
$160,005
FILES CLOSED FOR INCOMPLETENESS
0
$0
44
$133,756
103
$201,614
2
$59,545
6
$171,685
0
$0
Aggregated Statistics For Year 2004 (Based on 4 full tracts)
A) FHA, FSA/RHS & VA Home Purchase Loans
B) Conventional Home Purchase Loans
C) Refinancings
D) Home Improvement Loans
F) Non-occupant Loans on < 5 Family Dwellings (A B C & D)
G) Loans On Manufactured Home Dwelling (A B C & D)
Number
Average Value
Number
Average Value
Number
Average Value
Number
Average Value
Number
Average Value
Number
Average Value
LOANS ORIGINATED
85
$165,976
1,011
$146,759
655
$166,625
81
$54,007
89
$143,649
2
$25,680
APPLICATIONS APPROVED, NOT ACCEPTED
6
$147,825
115
$154,159
101
$171,019
24
$34,898
12
$126,919
2
$44,660
APPLICATIONS DENIED
10
$137,944
111
$128,332
269
$178,172
57
$59,140
12
$93,078
12
$39,909
APPLICATIONS WITHDRAWN
125
$107,152
95
$156,828
214
$179,931
22
$95,766
4
$249,605
0
$0
FILES CLOSED FOR INCOMPLETENESS
0
$0
24
$165,066
125
$177,784
2
$53,590
6
$91,300
0
$0
Aggregated Statistics For Year 2003 (Based on 4 full tracts)
A) FHA, FSA/RHS & VA Home Purchase Loans
B) Conventional Home Purchase Loans
C) Refinancings
D) Home Improvement Loans
E) Loans on Dwellings For 5+ Families
F) Non-occupant Loans on < 5 Family Dwellings (A B C & D)
Number
Average Value
Number
Average Value
Number
Average Value
Number
Average Value
Number
Average Value
Number
Average Value
LOANS ORIGINATED
85
$157,674
1,075
$157,945
2,014
$158,064
81
$62,113
4
$14,341,405
77
$143,883
APPLICATIONS APPROVED, NOT ACCEPTED
10
$174,858
59
$132,311
226
$140,803
18
$51,283
0
$0
4
$120,628
APPLICATIONS DENIED
6
$105,025
97
$119,363
430
$164,958
51
$51,029
0
$0
16
$195,194
APPLICATIONS WITHDRAWN
12
$111,468
91
$140,057
305
$159,113
20
$29,709
0
$0
10
$61,339
FILES CLOSED FOR INCOMPLETENESS
2
$142,230
26
$141,605
81
$169,756
2
$61,530
2
$11,951,170
2
$150,130
Aggregated Statistics For Year 1999 (Based on 1 full tract)
A) FHA, FSA/RHS & VA Home Purchase Loans
B) Conventional Home Purchase Loans
C) Refinancings
D) Home Improvement Loans
F) Non-occupant Loans on < 5 Family Dwellings (A B C & D)
Detailed PMIC statistics for the following Tracts:1914.06
, 1914.07
2002 - 2018 National Fire Incident Reporting System (NFIRS) incidents
Based on the data from the years 2002 - 2018 the average number of fires per year is 12. The highest number of reported fire incidents - 21 took place in 2011, and the least - 0 in 2008. The data has a declining trend.
When looking into fire subcategories, the most reports belonged to: Outside Fires (37.7%), and Structure Fires (23.6%).
Fire incident types reported to NFIRS in Zip Code 78248


 Nearest zip codes: 78231, 78232, 78258, 78230, 78216, 78213.


 : $6,726,905 in 21 contracts from 1999 to 2001


 Based on the data from the years 2002 - 2018 the average number of fires per year is 12. The highest number of reported fire incidents - 21 took place in 2011, and the least - 0 in 2008. The data has a declining trend.
 When looking into fire subcategories, the most reports belonged to: Outside Fires (37.7%), and Structure Fires (23.6%).