Estimated zip code population in 2022: 5,307 Zip code population in 2010: 5,930 Zip code population in 2000: 4,891
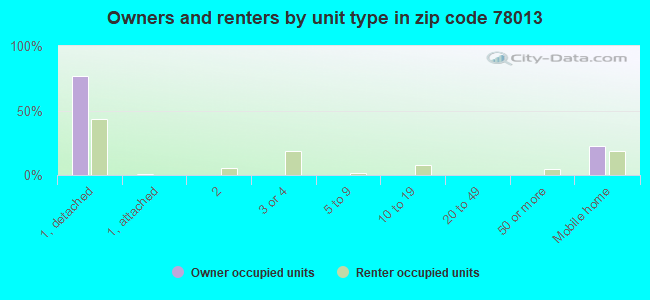
Houses and condos: 2,781 Renter-occupied apartments: 340
% of renters here:
15%
State:
38%
March 2022 cost of living index in zip code 78013: 81.8 (low, U.S. average is 100)
Land area: 230.3 sq. mi. Water area: 0.3 sq. mi.
Population density: 23 people per square mile
(very low).
OSM Map
General Map
Google Map
MSN Map
OSM Map
General Map
Google Map
MSN Map
OSM Map
General Map
Google Map
MSN Map
OSM Map
General Map
Google Map
MSN Map
Please wait while loading the map...
Real estate property taxes paid for housing units in 2022:
This zip code:
0.8% ($3,041)
Texas:
1.5% ($4,050)
Median real estate property taxes paid for housing units with mortgages in 2022: $3,294 (0.9%) Median real estate property taxes paid for housing units with no mortgage in 2022: $2,951 (0.7%)
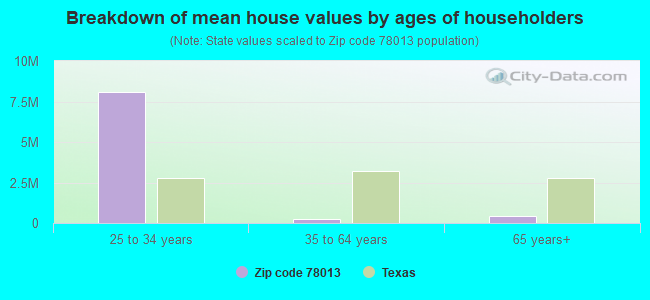
Estimated median house/condo value in 2022: $399,099
78013:
$399,099
Texas:
$275,400
According to our research of Texas and other state lists, there were 9 registered sex offenders living in 78013 zip code as of July 15, 2024. The ratio of all residents to sex offenders in zip code 78013 is 722 to 1. The ratio of registered sex offenders to all residents in this zip code is lower than the state average.
Median resident age:
This zip code:
51.5 years
Texas median age:
35.6 years
Average household size:
This zip code:
2.3 people
Texas:
2.6 people
Averages for the 2020 tax year for zip code 78013, filed in 2021:
Average Adjusted Gross Income (AGI) in 2020: $90,569 (Individual Income Tax Returns)
Here:
$90,569
State:
$77,054
Salary/wage: $59,467 (reported on 72.0% of returns)
Here:
$59,467
State:
$62,766
(% of AGI for various income ranges: 1108.3% for AGIs below $25k, 3666.0% for AGIs $25k-50k, 6439.6% for AGIs $50k-75k, 8384.1% for AGIs $75k-100k, 15739.4% for AGIs $100k-200k, 73284.0% for AGIs over 200k)
Taxable interest for individuals: $3,101 (reported on 34.4% of returns)
This zip code:
$3,101
Texas:
$2,665
(% of AGI for various income ranges: 31.0% for AGIs below $25k, 44.0% for AGIs $25k-50k, 89.1% for AGIs $50k-75k, 223.5% for AGIs $75k-100k, 359.4% for AGIs $100k-200k, 2672.0% for AGIs over 200k)
Ordinary dividends: $13,195 (reported on 22.9% of returns)
Here:
$13,195
State:
$10,044
(% of AGI for various income ranges: 33.3% for AGIs below $25k, 39.6% for AGIs $25k-50k, 243.0% for AGIs $50k-75k, 473.5% for AGIs $75k-100k, 1151.7% for AGIs $100k-200k, 9218.0% for AGIs over 200k)
Net capital gain/loss in AGI: +$66,900 (reported on 21.9% of returns)
Here:
+$66,900
State:
+$39,590
(% of AGI for various income ranges: 9.0% for AGIs below $25k, 25.8% for AGIs $25k-50k, 65.2% for AGIs $50k-75k, 180.6% for AGIs $75k-100k, 2226.7% for AGIs $100k-200k, 72316.0% for AGIs over 200k)
Profit/loss from business: +$14,091 (reported on 26.5% of returns)
Here:
+$14,091
State:
+$10,888
(% of AGI for various income ranges: 359.7% for AGIs below $25k, 237.7% for AGIs $25k-50k, 524.8% for AGIs $50k-75k, 883.5% for AGIs $75k-100k, 858.9% for AGIs $100k-200k, 5700.0% for AGIs over 200k)
Taxable individual retirement arrangement distribution: $22,048 (reported on 11.1% of returns)
78013:
$22,048
Texas:
$24,740
(% of AGI for various income ranges: 55.9% for AGIs below $25k, 84.2% for AGIs $25k-50k, 238.7% for AGIs $50k-75k, 479.4% for AGIs $75k-100k, 1687.2% for AGIs $100k-200k, 3344.0% for AGIs over 200k)
Total itemized deductions: $43,708 (reported on 8.6% of returns)
Here:
$43,708
State:
$40,428
(% of AGI for various income ranges: 156.0% for AGIs $25k-50k, 314.3% for AGIs $50k-75k, 436.5% for AGIs $75k-100k, 1403.9% for AGIs $100k-200k, 11374.0% for AGIs over 200k)
Charity contributions: $13,395 (reported on 6.8% of returns)
Here:
$13,395
State:
$18,201
(% of AGI for various income ranges: 114.8% for AGIs $50k-75k, 405.0% for AGIs $100k-200k, 3104.0% for AGIs over 200k)
Taxes paid: $6,538 (reported on 8.6% of returns)
78013:
$6,538
State:
$7,821
(% of AGI for various income ranges: 15.2% for AGIs below $25k, 54.3% for AGIs $50k-75k, 87.6% for AGIs $75k-100k, 257.2% for AGIs $100k-200k, 1488.0% for AGIs over 200k)
Earned income credit: $2,518 (reported on 16.1% of returns)
Here:
$2,518
State:
$2,584
(% of AGI for various income ranges: 129.8% for AGIs below $25k, 73.1% for AGIs $25k-50k)
Percentage of individuals using paid preparers for their 2020 taxes: 91.0%
Here:
91%
State:
92%
(% for various income ranges: 88.8% for AGIs below $25k, 94.2% for AGIs $25k-50k, 91.7% for AGIs $50k-75k, 92.6% for AGIs $75k-100k, 89.5% for AGIs $100k-200k, 90.0% for AGIs over 200k)
Averages for the 2012 tax year for zip code 78013, filed in 2013:
Average Adjusted Gross Income (AGI) in 2012: $69,509 (Individual Income Tax Returns)
Here:
$69,509
State:
$65,384
Salary/wage: $49,642 (reported on 74.9% of returns)
Here:
$49,642
State:
$52,524
(% of AGI for various income ranges: 68.9% for AGIs below $25k, 75.9% for AGIs $25k-50k, 69.5% for AGIs $50k-75k, 61.1% for AGIs $75k-100k, 63.9% for AGIs $100k-200k, 33.6% for AGIs over 200k)
Taxable interest for individuals: $2,491 (reported on 34.9% of returns)
This zip code:
$2,491
Texas:
$2,372
(% of AGI for various income ranges: 1.7% for AGIs below $25k, 0.8% for AGIs $25k-50k, 1.7% for AGIs $50k-75k, 2.5% for AGIs $75k-100k, 0.9% for AGIs $100k-200k, 1.1% for AGIs over 200k)
Ordinary dividends: $8,522 (reported on 19.2% of returns)
Here:
$8,522
State:
$9,721
(% of AGI for various income ranges: 1.7% for AGIs below $25k, 1.7% for AGIs $25k-50k, 2.8% for AGIs $50k-75k, 2.7% for AGIs $75k-100k, 2.1% for AGIs $100k-200k, 2.6% for AGIs over 200k)
Net capital gain/loss in AGI: +$26,970 (reported on 17.3% of returns)
Here:
+$26,970
State:
+$35,319
(% of AGI for various income ranges: 0.4% for AGIs below $25k, 0.6% for AGIs $25k-50k, 1.3% for AGIs $50k-75k, 1.4% for AGIs $75k-100k, 4.3% for AGIs $100k-200k, 13.3% for AGIs over 200k)
Profit/loss from business: +$9,130 (reported on 27.5% of returns)
Here:
+$9,130
State:
+$13,732
(% of AGI for various income ranges: 16.6% for AGIs below $25k, 5.6% for AGIs $25k-50k, 2.9% for AGIs $50k-75k, 3.8% for AGIs $75k-100k, 3.9% for AGIs $100k-200k, 0.7% for AGIs over 200k)
Taxable individual retirement arrangement distribution: $21,354 (reported on 11.0% of returns)
78013:
$21,354
Texas:
$19,511
(% of AGI for various income ranges: 3.4% for AGIs below $25k, 3.8% for AGIs $25k-50k, 3.8% for AGIs $50k-75k, 7.1% for AGIs $75k-100k, 5.7% for AGIs $100k-200k, 1.3% for AGIs over 200k)
Total itemized deductions: $23,945 (17% of AGI, reported on 22.0% of returns)
Here:
$23,945
State:
$24,724
Here:
17.1% of AGI
State:
15.9% of AGI
(% of AGI for various income ranges: 8.6% for AGIs below $25k, 6.8% for AGIs $25k-50k, 8.9% for AGIs $50k-75k, 11.9% for AGIs $75k-100k, 11.1% for AGIs $100k-200k, 4.7% for AGIs over 200k)
Charity contributions: $6,107 (reported on 17.3% of returns)
Here:
$6,107
State:
$6,808
(% of AGI for various income ranges: 0.8% for AGIs below $25k, 1.1% for AGIs $25k-50k, 1.4% for AGIs $50k-75k, 1.9% for AGIs $75k-100k, 2.1% for AGIs $100k-200k, 1.5% for AGIs over 200k)
Taxes paid: $6,128 (reported on 21.2% of returns)
78013:
$6,128
State:
$6,921
(% of AGI for various income ranges: 1.6% for AGIs below $25k, 1.4% for AGIs $25k-50k, 2.1% for AGIs $50k-75k, 3.0% for AGIs $75k-100k, 3.3% for AGIs $100k-200k, 1.1% for AGIs over 200k)
Earned income credit: $2,502 (reported on 21.2% of returns)
Here:
$2,502
State:
$2,570
(% of AGI for various income ranges: 7.6% for AGIs below $25k, 1.5% for AGIs $25k-50k)
Percentage of individuals using paid preparers for their 2012 taxes: 57.6%
Here:
58%
State:
51%
(% for various income ranges: 53.3% for AGIs below $25k, 58.7% for AGIs $25k-50k, 58.1% for AGIs $50k-75k, 60.0% for AGIs $75k-100k, 62.5% for AGIs $100k-200k, 80.0% for AGIs over 200k)
Averages for the 2004 tax year for zip code 78013, filed in 2005:
Average Adjusted Gross Income (AGI) in 2004: $42,121 (Individual Income Tax Returns)
Here:
$42,121
State:
$47,881
Salary/wage: $34,969 (reported on 74.1% of returns)
Here:
$34,969
State:
$41,947
(% of AGI for various income ranges: 104.4% for AGIs below $10k, 69.2% for AGIs $10k-25k, 74.7% for AGIs $25k-50k, 71.4% for AGIs $50k-75k, 66.2% for AGIs $75k-100k, 43.1% for AGIs over 100k)
Taxable interest for individuals: $2,658 (reported on 42.7% of returns)
This zip code:
$2,658
Texas:
$2,255
(% of AGI for various income ranges: 12.2% for AGIs below $10k, 3.3% for AGIs $10k-25k, 2.4% for AGIs $25k-50k, 2.5% for AGIs $50k-75k, 2.6% for AGIs $75k-100k, 2.4% for AGIs over 100k)
Taxable dividends: $3,259 (reported on 23.1% of returns)
Here:
$3,259
State:
$4,261
(% of AGI for various income ranges: 5.5% for AGIs below $10k, 2.0% for AGIs $10k-25k, 1.8% for AGIs $25k-50k, 1.6% for AGIs $50k-75k, 1.8% for AGIs $75k-100k, 1.6% for AGIs over 100k)
Net capital gain/loss: +$13,048 (reported on 22.2% of returns)
Here:
+$13,048
State:
+$16,110
(% of AGI for various income ranges: 2.6% for AGIs below $10k, 0.6% for AGIs $10k-25k, 1.2% for AGIs $25k-50k, 2.3% for AGIs $50k-75k, 5.9% for AGIs $75k-100k, 14.9% for AGIs over 100k)
Profit/loss from business: +$10,739 (reported on 27.7% of returns)
Here:
+$10,739
State:
+$11,013
(% of AGI for various income ranges: 12.6% for AGIs below $10k, 13.5% for AGIs $10k-25k, 6.4% for AGIs $25k-50k, 3.9% for AGIs $50k-75k, 6.9% for AGIs $75k-100k, 7.0% for AGIs over 100k)
IRA payment deduction: $3,683 (reported on 2.9% of returns)
78013:
$3,683
Texas:
$3,120
(% of AGI for various income ranges: 0.3% for AGIs $10k-25k, 0.4% for AGIs $25k-50k, 0.4% for AGIs $50k-75k, 0.2% for AGIs over 100k)
Self-employed pension: $16,667 (reported on 0.6% of returns)
Here:
$16,667
Texas:
$16,401
Total itemized deductions: $19,438 (22% of AGI, reported on 19.9% of returns)
Here:
$19,438
State:
$19,631
Here:
21.8% of AGI
State:
18.9% of AGI
(% of AGI for various income ranges: 17.3% for AGIs below $10k, 7.1% for AGIs $10k-25k, 7.5% for AGIs $25k-50k, 11.0% for AGIs $50k-75k, 12.4% for AGIs $75k-100k, 8.5% for AGIs over 100k)
Charity contributions deductions: $4,766 (5% of AGI, reported on 16.3% of returns)
Here:
$4,766
State:
$4,753
Here:
4.9% of AGI
State:
4.2% of AGI
(% of AGI for various income ranges: 0.9% for AGIs below $10k, 0.8% for AGIs $10k-25k, 1.4% for AGIs $25k-50k, 1.6% for AGIs $50k-75k, 2.3% for AGIs $75k-100k, 2.5% for AGIs over 100k)
Total tax: $7,139 (reported on 72.8% of returns)
78013:
$7,139
State:
$9,058
(% of AGI for various income ranges: 7.0% for AGIs below $10k, 4.8% for AGIs $10k-25k, 5.8% for AGIs $25k-50k, 8.6% for AGIs $50k-75k, 10.8% for AGIs $75k-100k, 21.1% for AGIs over 100k)
Earned income credit: $1,816 (reported on 19.5% of returns)
Here:
$1,816
State:
$2,024
Percentage of individuals using paid preparers for their 2004 taxes: 63.0%
Here:
63%
State:
57%
(% for various income ranges: 54.5% for AGIs below $10k, 64.1% for AGIs $10k-25k, 65.0% for AGIs $25k-50k, 63.5% for AGIs $50k-75k, 62.1% for AGIs $75k-100k, 78.7% for AGIs over 100k)
Household received Food Stamps/SNAP in the past 12 months: 225 Household did not receive Food Stamps/SNAP in the past 12 months: 2,090
Women who had a birth in the past 12 months: 65 (17 now married, 45 unmarried) Women who did not have a birth in the past 12 months: 831 (583 now married, 240 unmarried)
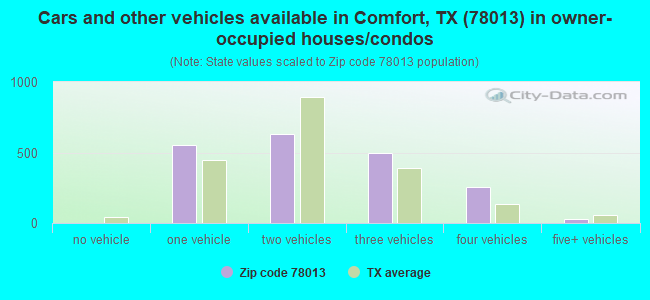
Housing units in zip code 78013 with a mortgage: 882 (32 second mortgage, 34 both second mortgage and home equity loan) Houses without a mortgage: 132
Median monthly owner costs for units with a mortgage: $2,160 Median monthly owner costs for units without a mortgage: $680
Residents with income below the poverty level in 2022:
This zip code:
6.9%
Whole state:
14.0%
Residents with income below 50% of the poverty level in 2022:
This zip code:
2.7%
Whole state:
7.4%
Median number of rooms in houses and condos:
Here:
6.2
State:
6.3
Median number of rooms in apartments:
Here:
4.3
State:
4.0
Notable locations in this zip code not listed on our city pages
Notable locations in zip code 78013: Camp Capers (A), Camp Idlewide (B), Crosscreek Ranch (C), Hasenwinkel Ranch (D), Comfort Historic District (E), Rausch Ranch (F), Comfort Volunteer Fire Department (G), Kendall County Emergency Medical Service Substation (H), Otto Brinkmann House (I), Waring Community Center (J). Display/hide their locations on the map
Cemeteries: Hermann Sons Cemetery (1), Brownsboro Cemetery (2), White Cemetery (3), Steves Family Cemetery (4), Treue der Union (5), Gaddis Cemetery (6), Langridge Family Cemetery (7). Display/hide their locations on the map
Creeks: Wilson Creek (A), Turkey Bottom Creek (B), Allen Creek (C), Polecat Spring Creek (D), Holliday Creek (E), North Creek (F), Verde Creek (G), Flat Rock Creek (H), Possum Creek (I). Display/hide their locations on the map
In group quarters: 65 (-1 institutionalized population)
Size of family households: 895 2-persons, 323 3-persons, 187 4-persons, 203 5-persons, 92 6-persons, 10 7-or-more-persons
Size of nonfamily households: 579 1-person, 24 2-persons
552 married couples with children.
215 single-parent households (79 men, 136 women).
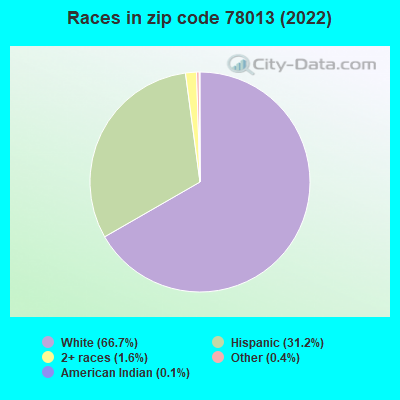
81.4% of residents of 78013 zip code speak English at home.
18.5% of residents speak Spanish at home (65% very well, 29% well, 6% not well).
0.4% of residents speak other Indo-European language at home (100% very well).
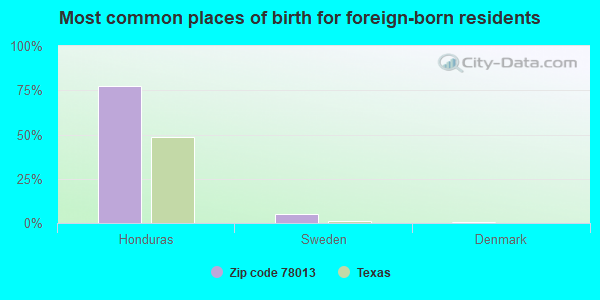
Foreign born population: 545 (10.3%) (28.5% of them are naturalized citizens)
This zip code:
10.3%
Whole state:
17.2%
77%Honduras
5%Sweden
1%Denmark
0%Algeria
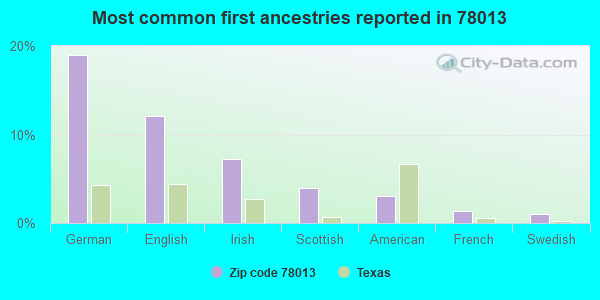
19%German
12%English
7%Irish
4%Scottish
3%American
1%French
1%Swedish
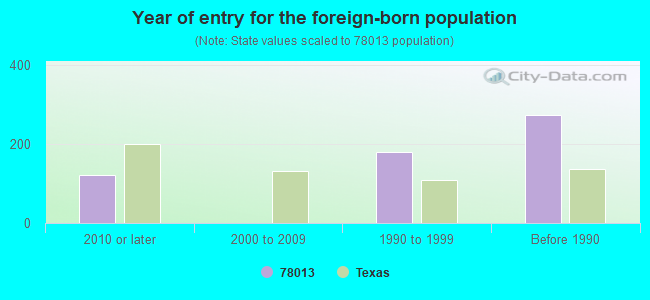
Year of entry for the foreign-born population
1222010 or later
12000 to 2009
1801990 to 1999
273Before 1990
Facilities with environmental interests located in this zip code:
Housing units lacking complete plumbing facilities: 3.8% Housing units lacking complete kitchen facilities: 4.4%
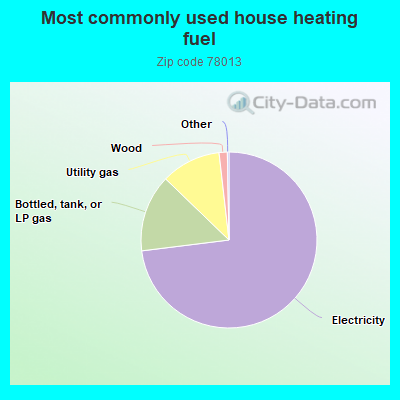
73.1%Electricity
14.2%Bottled, tank, or LP gas
11.0%Utility gas
1.5%Wood
Population in 1990: 3,253. Population change in the 1990s: +1,638 (+50.4%).
Place of birth for U.S.-born residents:
This state: 3,421
Northeast: 114
Midwest: 354
South: 419
West: 391
56% of the 78013 zip code residents lived in the same house 5 years ago. Out of people who lived in different houses, 38% lived in this county. Out of people who lived in different counties, 50% lived in Texas.
94% of the 78013 zip code residents lived in the same house 1 year ago. Out of people who lived in different houses, 12% moved from this county. Out of people who lived in different houses, 92% moved from different county within same state. Out of people who lived in different houses, 2% moved from different state.
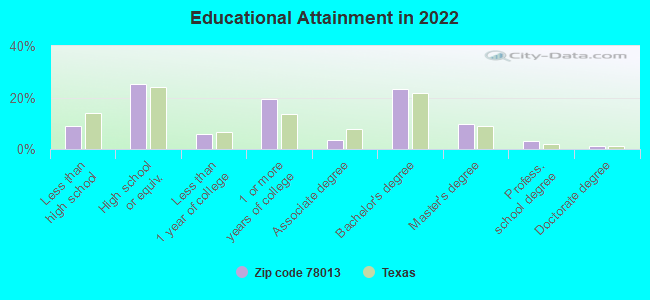
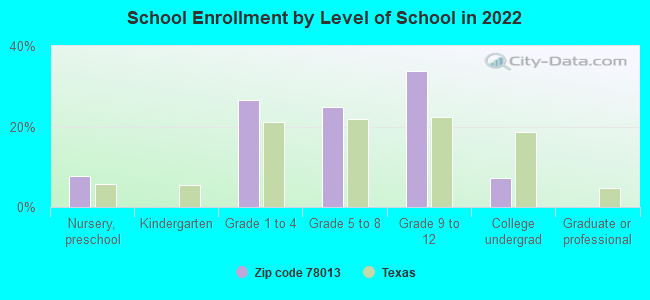
Private vs. public school enrollment:
Students in private schools in grades 1 to 8 (elementary and middle school): 94
Here:
21.0%
Texas:
8.8%
Students in private schools in grades 9 to 12 (high school): 14
Here:
4.9%
Texas:
8.0%
Students in private undergraduate colleges: 17
Here:
28.4%
Texas:
16.2%
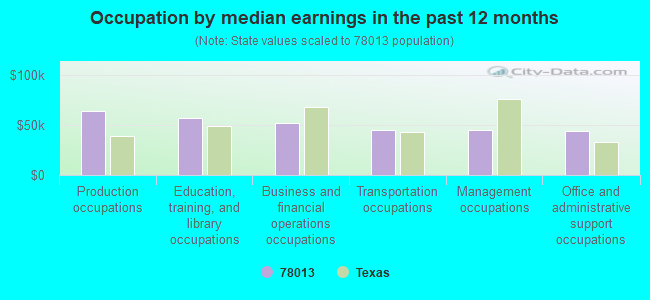
Occupation by median earnings in the past 12 months ($)
64,430Production occupations
56,982Education, training, and library occupations
52,003Business and financial operations occupations
45,592Transportation occupations
44,946Management occupations
43,850Office and administrative support occupations
Companies with federal contracts located in this zip code:
PARTNERWERKS, INC (102 OLEANDER RD in COMFORT, TX)
$33,853 with Army for Services -- Basic Research (R&D). Signed on 2001-09-28. Completion date: 2001-09-30.
EXECUTIVE INTERIORS (110 APACHERIA PASS in COMFORT, TX; small business) : $29,752 in 2 contractsin 2004
$15,364 with Army for Miscellaneous Furniture and Fixtures. Taking place in KY. Signed on 2004-06-10. Completion date: 2004-07-12.
$14,388 with Army for Office Furniture. Signed on 2004-02-20. Completion date: 2004-03-21.
Top industries in this zip code by the number of employees in 2005:
Health Care and Social Assistance: Nursing Care Facilities (50-99 employees: 1 establishment)
Accommodation and Food Services: Limited-Service Restaurants (20-49: 1, 10-19: 2)
Other Services (except Public Administration): Religious Organizations (10-19: 2, 5-9: 3, 1-4: 1)
55 people in nursing facilities/skilled-nursing facilities
45 people in other noninstitutional facilities
People in group quarters in 2000:
52 people in college dormitories (includes college quarters off campus)
51 people in nursing homes
Fatal accident statistics in 2014:
Fatal accident count: 5
Vehicles involved in fatal accidents: 8
Fatal accidents caused by drunken drivers: 0
Fatalities: 5
Persons involved in fatal accidents: 17
Pedestrians involved in fatal accidents: 0
Fatal accident statistics in 2013:
Fatal accident count: 4
Vehicles involved in fatal accidents: 7
Fatal accidents caused by drunken drivers: 1
Fatalities: 4
Persons involved in fatal accidents: 14
Pedestrians involved in fatal accidents: 0
2002 - 2018 National Fire Incident Reporting System (NFIRS) incidents
Based on the data from the years 2002 - 2018 the average number of fire incidents per year is 44. The highest number of fire incidents - 106 took place in 2008, and the least - 19 in 2012. The data has a rising trend.
When looking into fire subcategories, the most reports belonged to: Outside Fires (75.1%), and Structure Fires (11.5%).
Fire incident types reported to NFIRS in Zip Code 78013

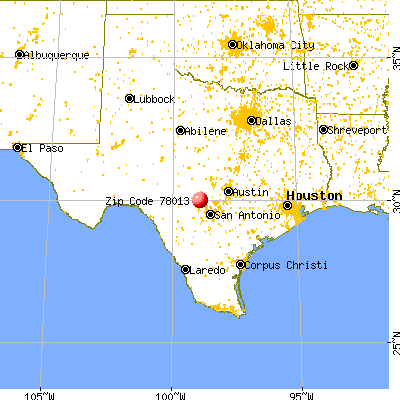


 Nearest zip codes: 78010, 78006, 78028, 78063, 78624, 78003.
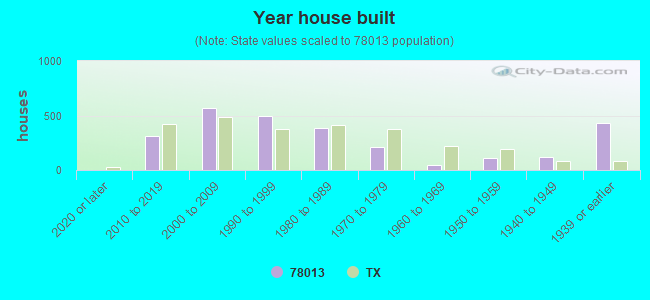


 Based on the data from the years 2002 - 2018 the average number of fire incidents per year is 44. The highest number of fire incidents - 106 took place in 2008, and the least - 19 in 2012. The data has a rising trend.
 When looking into fire subcategories, the most reports belonged to: Outside Fires (75.1%), and Structure Fires (11.5%).