Estimated zip code population in 2022: 16,943 Zip code population in 2010: 13,981 Zip code population in 2000: 14,224
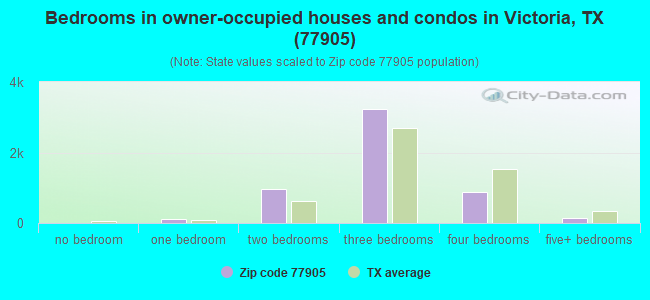
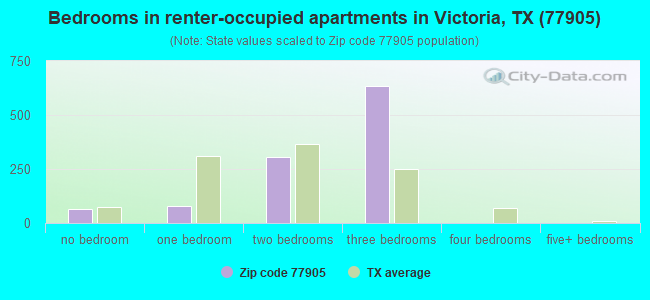
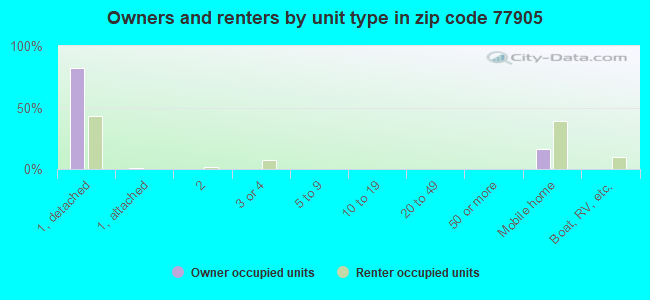
Houses and condos: 7,089 Renter-occupied apartments: 1,092
% of renters here:
17%
State:
38%
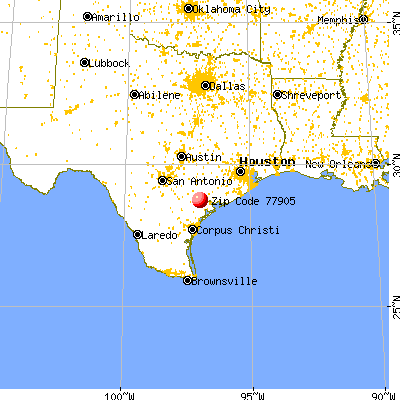
March 2022 cost of living index in zip code 77905: 79.7 (low, U.S. average is 100)
Land area: 419.8 sq. mi. Water area: 8.2 sq. mi.
Population density: 40 people per square mile
(very low).
OSM Map
General Map
Google Map
MSN Map
OSM Map
General Map
Google Map
MSN Map
OSM Map
General Map
Google Map
MSN Map
OSM Map
General Map
Google Map
MSN Map
Please wait while loading the map...
Real estate property taxes paid for housing units in 2022:
This zip code:
1.2% ($2,444)
Texas:
1.5% ($4,050)
Median real estate property taxes paid for housing units with mortgages in 2022: $3,355 (1.3%) Median real estate property taxes paid for housing units with no mortgage in 2022: $1,950 (1.1%)
Averages for the 2020 tax year for zip code 77905, filed in 2021:
Average Adjusted Gross Income (AGI) in 2020: $70,699 (Individual Income Tax Returns)
Here:
$70,699
State:
$77,054
Salary/wage: $59,973 (reported on 81.2% of returns)
Here:
$59,973
State:
$62,766
(% of AGI for various income ranges: 1155.0% for AGIs below $25k, 3461.5% for AGIs $25k-50k, 6357.5% for AGIs $50k-75k, 8981.0% for AGIs $75k-100k, 16705.1% for AGIs $100k-200k, 52022.2% for AGIs over 200k)
Taxable interest for individuals: $1,167 (reported on 29.7% of returns)
This zip code:
$1,167
Texas:
$2,665
(% of AGI for various income ranges: 19.6% for AGIs below $25k, 19.8% for AGIs $25k-50k, 37.8% for AGIs $50k-75k, 61.9% for AGIs $75k-100k, 74.7% for AGIs $100k-200k, 701.1% for AGIs over 200k)
Ordinary dividends: $4,765 (reported on 16.9% of returns)
Here:
$4,765
State:
$10,044
(% of AGI for various income ranges: 17.7% for AGIs below $25k, 30.6% for AGIs $25k-50k, 65.2% for AGIs $50k-75k, 105.0% for AGIs $75k-100k, 153.5% for AGIs $100k-200k, 2871.1% for AGIs over 200k)
Net capital gain/loss in AGI: +$9,081 (reported on 15.4% of returns)
Here:
+$9,081
State:
+$39,590
(% of AGI for various income ranges: 11.5% for AGIs below $25k, 18.1% for AGIs $25k-50k, 73.2% for AGIs $50k-75k, 113.3% for AGIs $75k-100k, 389.4% for AGIs $100k-200k, 5427.8% for AGIs over 200k)
Profit/loss from business: +$9,834 (reported on 19.1% of returns)
Here:
+$9,834
State:
+$10,888
(% of AGI for various income ranges: 110.4% for AGIs below $25k, 137.7% for AGIs $25k-50k, 170.3% for AGIs $50k-75k, 142.9% for AGIs $75k-100k, 346.3% for AGIs $100k-200k, 5102.2% for AGIs over 200k)
Taxable individual retirement arrangement distribution: $20,016 (reported on 10.8% of returns)
77905:
$20,016
Texas:
$24,740
(% of AGI for various income ranges: 83.7% for AGIs below $25k, 128.5% for AGIs $25k-50k, 239.0% for AGIs $50k-75k, 459.4% for AGIs $75k-100k, 704.7% for AGIs $100k-200k, 2441.1% for AGIs over 200k)
Self-employed (Keogh) retirement plans: $24,450 (reported on 0.3% of returns)
77905:
$24,450
Texas:
$29,298
(% of AGI for various income ranges: 61.9% for AGIs $100k-200k)
Total itemized deductions: $41,097 (reported on 4.3% of returns)
Here:
$41,097
State:
$40,428
(% of AGI for various income ranges: 50.1% for AGIs below $25k, 76.0% for AGIs $25k-50k, 229.6% for AGIs $50k-75k, 303.8% for AGIs $75k-100k, 433.9% for AGIs $100k-200k, 4035.6% for AGIs over 200k)
Charity contributions: $14,390 (reported on 3.1% of returns)
Here:
$14,390
State:
$18,201
(% of AGI for various income ranges: 13.6% for AGIs below $25k, 48.1% for AGIs $50k-75k, 63.1% for AGIs $75k-100k, 134.4% for AGIs $100k-200k, 1215.6% for AGIs over 200k)
Taxes paid: $6,236 (reported on 4.1% of returns)
77905:
$6,236
State:
$7,821
(% of AGI for various income ranges: 4.7% for AGIs below $25k, 9.1% for AGIs $25k-50k, 32.9% for AGIs $50k-75k, 36.0% for AGIs $75k-100k, 73.8% for AGIs $100k-200k, 626.7% for AGIs over 200k)
Earned income credit: $2,509 (reported on 16.9% of returns)
Here:
$2,509
State:
$2,584
(% of AGI for various income ranges: 118.5% for AGIs below $25k, 80.7% for AGIs $25k-50k, 1.5% for AGIs $50k-75k)
Percentage of individuals using paid preparers for their 2020 taxes: 93.2%
Here:
93%
State:
92%
(% for various income ranges: 91.9% for AGIs below $25k, 93.5% for AGIs $25k-50k, 92.9% for AGIs $50k-75k, 93.9% for AGIs $75k-100k, 94.2% for AGIs $100k-200k, 96.2% for AGIs over 200k)
Averages for the 2012 tax year for zip code 77905, filed in 2013:
Average Adjusted Gross Income (AGI) in 2012: $64,903 (Individual Income Tax Returns)
Here:
$64,903
State:
$65,384
Salary/wage: $54,622 (reported on 84.5% of returns)
Here:
$54,622
State:
$52,524
(% of AGI for various income ranges: 75.4% for AGIs below $25k, 80.4% for AGIs $25k-50k, 77.9% for AGIs $50k-75k, 81.4% for AGIs $75k-100k, 80.3% for AGIs $100k-200k, 42.1% for AGIs over 200k)
Taxable interest for individuals: $1,155 (reported on 32.8% of returns)
This zip code:
$1,155
Texas:
$2,372
(% of AGI for various income ranges: 1.2% for AGIs below $25k, 0.5% for AGIs $25k-50k, 0.6% for AGIs $50k-75k, 0.6% for AGIs $75k-100k, 0.6% for AGIs $100k-200k, 0.4% for AGIs over 200k)
Ordinary dividends: $2,810 (reported on 15.6% of returns)
Here:
$2,810
State:
$9,721
(% of AGI for various income ranges: 1.0% for AGIs below $25k, 0.6% for AGIs $25k-50k, 0.7% for AGIs $50k-75k, 0.4% for AGIs $75k-100k, 0.9% for AGIs $100k-200k, 0.5% for AGIs over 200k)
Net capital gain/loss in AGI: +$6,837 (reported on 12.7% of returns)
Here:
+$6,837
State:
+$35,319
(% of AGI for various income ranges: 0.4% for AGIs $25k-50k, 0.6% for AGIs $50k-75k, 0.6% for AGIs $75k-100k, 1.4% for AGIs $100k-200k, 3.2% for AGIs over 200k)
Profit/loss from business: +$18,561 (reported on 18.7% of returns)
Here:
+$18,561
State:
+$13,732
(% of AGI for various income ranges: 8.8% for AGIs below $25k, 4.2% for AGIs $25k-50k, 3.9% for AGIs $50k-75k, 3.3% for AGIs $75k-100k, 4.4% for AGIs $100k-200k, 8.5% for AGIs over 200k)
Taxable individual retirement arrangement distribution: $13,597 (reported on 9.6% of returns)
77905:
$13,597
Texas:
$19,511
(% of AGI for various income ranges: 3.8% for AGIs below $25k, 2.2% for AGIs $25k-50k, 2.8% for AGIs $50k-75k, 2.3% for AGIs $75k-100k, 2.2% for AGIs $100k-200k, 0.6% for AGIs over 200k)
Self-employment retirement plans: $25,400 (reported on 0.6% of returns)
77905:
$25,400
Texas:
$23,938
Total itemized deductions: $21,084 (16% of AGI, reported on 18.5% of returns)
Here:
$21,084
State:
$24,724
Here:
16.2% of AGI
State:
15.9% of AGI
(% of AGI for various income ranges: 6.8% for AGIs below $25k, 6.0% for AGIs $25k-50k, 6.4% for AGIs $50k-75k, 5.5% for AGIs $75k-100k, 6.7% for AGIs $100k-200k, 5.0% for AGIs over 200k)
Charity contributions: $6,230 (reported on 13.2% of returns)
Here:
$6,230
State:
$6,808
(% of AGI for various income ranges: 0.5% for AGIs below $25k, 0.6% for AGIs $25k-50k, 0.8% for AGIs $50k-75k, 0.8% for AGIs $75k-100k, 1.3% for AGIs $100k-200k, 2.4% for AGIs over 200k)
Taxes paid: $5,050 (reported on 17.9% of returns)
77905:
$5,050
State:
$6,921
(% of AGI for various income ranges: 0.9% for AGIs below $25k, 1.2% for AGIs $25k-50k, 1.4% for AGIs $50k-75k, 1.3% for AGIs $75k-100k, 1.8% for AGIs $100k-200k, 1.2% for AGIs over 200k)
Earned income credit: $2,274 (reported on 16.5% of returns)
Here:
$2,274
State:
$2,570
(% of AGI for various income ranges: 6.9% for AGIs below $25k, 1.1% for AGIs $25k-50k)
Percentage of individuals using paid preparers for their 2012 taxes: 55.0%
Here:
55%
State:
51%
(% for various income ranges: 47.1% for AGIs below $25k, 51.1% for AGIs $25k-50k, 58.3% for AGIs $50k-75k, 60.5% for AGIs $75k-100k, 65.6% for AGIs $100k-200k, 84.2% for AGIs over 200k)
Averages for the 2004 tax year for zip code 77905, filed in 2005:
Average Adjusted Gross Income (AGI) in 2004: $41,158 (Individual Income Tax Returns)
Here:
$41,158
State:
$47,881
Salary/wage: $37,121 (reported on 85.3% of returns)
Here:
$37,121
State:
$41,947
(% of AGI for various income ranges: 130.2% for AGIs below $10k, 78.0% for AGIs $10k-25k, 81.6% for AGIs $25k-50k, 82.8% for AGIs $50k-75k, 81.3% for AGIs $75k-100k, 60.1% for AGIs over 100k)
Taxable interest for individuals: $1,571 (reported on 41.1% of returns)
This zip code:
$1,571
Texas:
$2,255
(% of AGI for various income ranges: 5.4% for AGIs below $10k, 2.5% for AGIs $10k-25k, 1.4% for AGIs $25k-50k, 1.2% for AGIs $50k-75k, 0.7% for AGIs $75k-100k, 2.1% for AGIs over 100k)
Taxable dividends: $1,556 (reported on 18.4% of returns)
Here:
$1,556
State:
$4,261
(% of AGI for various income ranges: 2.8% for AGIs below $10k, 0.6% for AGIs $10k-25k, 0.5% for AGIs $25k-50k, 0.5% for AGIs $50k-75k, 0.6% for AGIs $75k-100k, 1.1% for AGIs over 100k)
Net capital gain/loss: +$3,490 (reported on 15.8% of returns)
Here:
+$3,490
State:
+$16,110
(% of AGI for various income ranges: 3.2% for AGIs below $10k, 0.6% for AGIs $10k-25k, 0.8% for AGIs $25k-50k, 0.7% for AGIs $50k-75k, 1.1% for AGIs $75k-100k, 2.8% for AGIs over 100k)
Profit/loss from business: +$9,227 (reported on 17.7% of returns)
Here:
+$9,227
State:
+$11,013
(% of AGI for various income ranges: 11.1% for AGIs below $10k, 5.4% for AGIs $10k-25k, 2.0% for AGIs $25k-50k, 2.0% for AGIs $50k-75k, 2.8% for AGIs $75k-100k, 7.5% for AGIs over 100k)
IRA payment deduction: $3,203 (reported on 2.1% of returns)
77905:
$3,203
Texas:
$3,120
(% of AGI for various income ranges: 1.0% for AGIs below $10k, 0.2% for AGIs $25k-50k, 0.2% for AGIs $50k-75k, 0.1% for AGIs $75k-100k, 0.2% for AGIs over 100k)
Self-employed pension: $12,071 (reported on 0.5% of returns)
Here:
$12,071
Texas:
$16,401
Total itemized deductions: $15,842 (21% of AGI, reported on 15.7% of returns)
Here:
$15,842
State:
$19,631
Here:
20.8% of AGI
State:
18.9% of AGI
(% of AGI for various income ranges: 8.1% for AGIs below $10k, 5.4% for AGIs $10k-25k, 5.9% for AGIs $25k-50k, 5.0% for AGIs $50k-75k, 6.2% for AGIs $75k-100k, 7.3% for AGIs over 100k)
Charity contributions deductions: $3,918 (5% of AGI, reported on 12.1% of returns)
Here:
$3,918
State:
$4,753
Here:
4.7% of AGI
State:
4.2% of AGI
(% of AGI for various income ranges: 0.4% for AGIs below $10k, 0.5% for AGIs $10k-25k, 0.8% for AGIs $25k-50k, 0.6% for AGIs $50k-75k, 1.3% for AGIs $75k-100k, 2.2% for AGIs over 100k)
Total tax: $5,981 (reported on 73.8% of returns)
77905:
$5,981
State:
$9,058
(% of AGI for various income ranges: 4.0% for AGIs below $10k, 3.9% for AGIs $10k-25k, 6.5% for AGIs $25k-50k, 9.0% for AGIs $50k-75k, 10.9% for AGIs $75k-100k, 19.3% for AGIs over 100k)
Earned income credit: $1,926 (reported on 17.4% of returns)
Here:
$1,926
State:
$2,024
Percentage of individuals using paid preparers for their 2004 taxes: 56.7%
Here:
57%
State:
57%
(% for various income ranges: 47.5% for AGIs below $10k, 55.4% for AGIs $10k-25k, 56.6% for AGIs $25k-50k, 60.3% for AGIs $50k-75k, 62.3% for AGIs $75k-100k, 73.6% for AGIs over 100k)
Household received Food Stamps/SNAP in the past 12 months: 576 Household did not receive Food Stamps/SNAP in the past 12 months: 5,865
Women who had a birth in the past 12 months: 258 (218 now married, 42 unmarried) Women who did not have a birth in the past 12 months: 3,452 (1,878 now married, 1,562 unmarried)
Housing units in zip code 77905 with a mortgage: 2,034 (12 second mortgage) Houses without a mortgage: 34
Median monthly owner costs for units with a mortgage: $1,688 Median monthly owner costs for units without a mortgage: $536
Residents with income below the poverty level in 2022:
This zip code:
13.0%
Whole state:
14.0%
Residents with income below 50% of the poverty level in 2022:
This zip code:
6.2%
Whole state:
7.4%
Median number of rooms in houses and condos:
Here:
5.9
State:
6.3
Median number of rooms in apartments:
Here:
5.4
State:
4.0
Notable locations in this zip code not listed on our city pages
Notable locations in zip code 77905: Primo Stables (A), Terrell Ranch (B), Mission Valley Volunteer Fire Department (C), Quail Creek Volunteer Fire Department (D), Lone Tree Volunteer Fire Department (E), Raisin Volunteer Fire Department Station 1 (F), J T Jecker House (G), Raisin Volunteer Fire Department Station 4 (H), Raisin Volunteer Fire Department Station 3 (I), Raisin Volunteer Fire Department Station 2 (J), Dacosta Volunteer Fire Department (K), Raisin Volunteer Fire Department Station 5 (L). Display/hide their locations on the map
Churches in zip code 77905 include: Bullocks Church (A), Crescent Valley Church (B), Mallahau Church (C), Coleto Baptist Church (D), Martin Luther Lutheran Church (E), Mount Zion Church (F). Display/hide their locations on the map
Cemeteries: Fagan Cemetery (1), De Leon Cemetery (2), De la Garza Cemetery (3), McDonald Cemetery (4), Terrell Cemetery (5), Joshua Cemetery (6), Mission Valley Cemetery (7). Display/hide their locations on the map
Lakes and reservoirs: Mary Lake (A), Warden Lake (B), Sample Lake (C), Pridham Lake (D), Sand Lake (E), Mill Lake (F), Rupley Lake (G), Linn Lake (H). Display/hide their locations on the map
Streams, rivers, and creeks: Boggy Creek (A), Black Bayou (B), Blue Bayou (C), Twelvemile Creek (D), Fifteenmile Creek (E), Spring Bayou (F), Sulphur Creek (G), Samson Bayou (H), Rocky Creek (I). Display/hide their locations on the map
In group quarters: 176 (-1 institutionalized population)
Size of family households: 2,424 2-persons, 1,088 3-persons, 671 4-persons, 290 5-persons, 266 6-persons, 96 7-or-more-persons
Size of nonfamily households: 1,464 1-person, 133 2-persons, 17 4-persons
2,747 married couples with children.
438 single-parent households (360 men, 78 women).
86.0% of residents of 77905 zip code speak English at home.
13.3% of residents speak Spanish at home (72% very well, 19% well, 6% not well, 3% not at all).
0.6% of residents speak other Indo-European language at home (53% very well, 47% well).
0.2% of residents speak other language at home (100% very well).
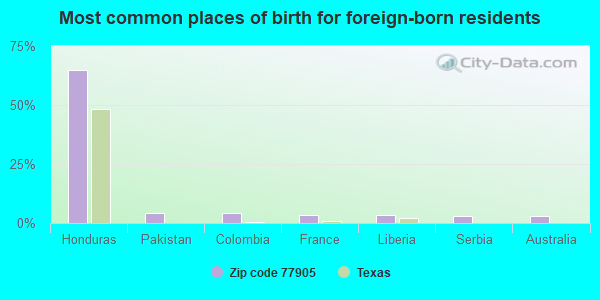
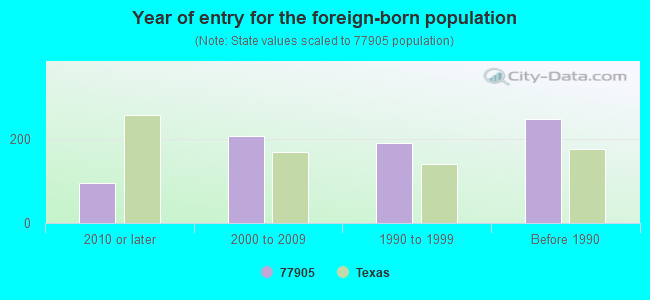
Foreign born population: 668 (3.9%) (61.2% of them are naturalized citizens)
Facilities with environmental interests located in this zip code:
BAKER PETRLOTE CORPORATION - VICTORIA (5901 US HIGHWAY 59 NORTH in VICTORIA, TX)
Small Quantity Generators, between 100 kg and 1000 kg of hazardous waste/month (Resource Conservation and Recovery Act (tracking hazardous waste)) - notification Organizations: BAKER PETROLITE CORPORATION (CONTACT/OPERATOR)
Alternative names: BAKER PETROLITE CORP, BAKER PETROLITE CORPORATION VICTORIA
BAKER OIL TOOLS BAKER HUGHES (7301 US HIGHWAY 59 NORTH in VICTORIA, TX)
Small Quantity Generators, between 100 kg and 1000 kg of hazardous waste/month (Resource Conservation and Recovery Act (tracking hazardous waste)) - notification Organizations: BAKER HUGHES OILFIELD OPERATIONS (CONTACT/OWNER)
Housing units lacking complete plumbing facilities: 1.5% Housing units lacking complete kitchen facilities: 3.9%
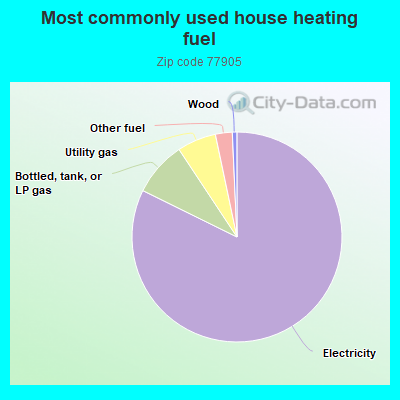
82.3%Electricity
8.4%Bottled, tank, or LP gas
6.0%Utility gas
2.6%Other fuel
0.7%Wood
Place of birth for U.S.-born residents:
This state: 14,059
Northeast: 149
Midwest: 554
South: 751
West: 498
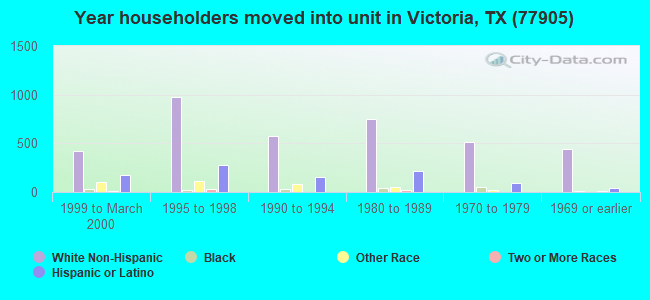
59% of the 77905 zip code residents lived in the same house 5 years ago. Out of people who lived in different houses, 68% lived in this county. Out of people who lived in different counties, 50% lived in Texas.
93% of the 77905 zip code residents lived in the same house 1 year ago. Out of people who lived in different houses, 65% moved from this county. Out of people who lived in different houses, 23% moved from different county within same state. Out of people who lived in different houses, 12% moved from different state.
Private vs. public school enrollment:
Students in private schools in grades 1 to 8 (elementary and middle school): 361
Here:
18.7%
Texas:
8.8%
Students in private schools in grades 9 to 12 (high school): 204
Here:
23.9%
Texas:
8.0%
Students in private undergraduate colleges: 94
Here:
20.9%
Texas:
16.2%
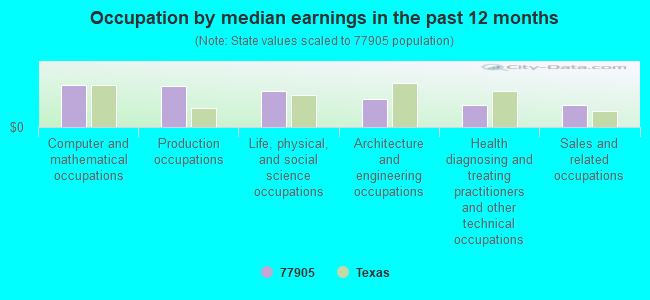
Occupation by median earnings in the past 12 months ($)
109,246Computer and mathematical occupations
106,403Production occupations
93,766Life, physical, and social science occupations
72,298Architecture and engineering occupations
58,301Health diagnosing and treating practitioners and other technical occupations
56,556Sales and related occupations
Companies with federal contracts located in this zip code:
CLEGG INDUSTRIES INC (808 BOB WHITE RD in VICTORIA, TX; small business) : $2,391,079 in 37 contractsfrom 1999 to 2005
Contracts for Miscellaneous Communication Equipment, Clean Work Stations, Controlled Environment and Related Equipment, Trailers, Trucks and Truck Tractors, Wheeled, and moreby Air Force, Animal and Plant Health Inspection Service, Army, NASA, and others Signed by year:2000: $284,676; 2001: $674,715; 2002: $371,190; 2003: $554,645; 2004: $285,674; 2005: $182,179; 2006: $0.
Biggest contracts:
$674,715 with Air Force for Miscellaneous Communication Equipment. Signed on 2001-08-03. Completion date: 2002-01-31.
$244,604 with Animal and Plant Health Inspection Service for Clean Work Stations, Controlled Environment and Related Equipment. Signed on 2003-09-15. Completion date: 2004-03-15.
$160,825 with Army for Trailers. Signed on 2004-03-31. Completion date: 2004-05-12.
$153,254 with NASA for Trailers. Signed on 2005-09-28. Completion date: 2006-01-18.
CKS HYDRO SERVICES, INC. (109 HUNTINGTON ROAD in VICTORIA, TX; small business)
$11,700 with Navy for Maintenance, Repair or Alteration of Real Property -- Airport Runways. Taking place in LA. Signed on 2000-09-13. Completion date: 2000-11-07.
JACO INDUSTRIAL SUPPLY, INC (8264 LONE TREE ROAD in VICTORIA, TX; small business) : $3,598 in 4 contractsfrom 2003 to 2006
$1,341 with Army for Miscellaneous Chemical Specialties. Signed on 2004-03-01. Completion date: 2004-03-10.
$1,033, same as above.Signed on 2003-12-10. Completion date: 2003-12-15.
$816, same as above.Signed on 2005-11-29. Completion date: 2005-12-02.
$408, same as above.Signed on 2006-02-22. Completion date: 2006-02-24.
Top industries in this zip code by the number of employees in 2005:
Mining: Support Activities for Oil and Gas Operations (250-499 employees: 1 establishment, 20-49 employees: 2 establishments, 10-19 employees: 2 establishments, 1-4 employees: 5 establishments)
Construction: Land Subdivision (100-249: 1, 1-4: 2)
Construction: Site Preparation Contractors (50-99: 1, 10-19: 1, 1-4: 2)
Other Services (except Public Administration): Commercial and Industrial Machinery and Equipment (except Automotive and Electronic) Repair and Maintenance (20-49: 1, 10-19: 2, 5-9: 2, 1-4: 2)
Management of Companies and Enterprises: Corporate, Subsidiary, and Regional Managing Offices (50-99: 1)
People in group quarters in 2010:
80 people in residential treatment centers for juveniles (non-correctional)
39 people in residential treatment centers for adults
21 people in group homes intended for adults
People in group quarters in 2000:
223 people in mental (psychiatric) hospitals or wards
8 people in religious group quarters
Fatal accident statistics in 2014:
Fatal accident count: 3
Vehicles involved in fatal accidents: 4
Fatal accidents caused by drunken drivers: 1
Fatalities: 3
Persons involved in fatal accidents: 4
Pedestrians involved in fatal accidents: 0
Fatal accident statistics in 2013:
Fatal accident count: 5
Vehicles involved in fatal accidents: 8
Fatal accidents caused by drunken drivers: 1
Fatalities: 5
Persons involved in fatal accidents: 9
Pedestrians involved in fatal accidents: 0
Home Mortgage Disclosure Act Aggregated Statistics For Year 2009 (Based on 12 partial tracts)
A) FHA, FSA/RHS & VA Home Purchase Loans
B) Conventional Home Purchase Loans
C) Refinancings
D) Home Improvement Loans
F) Non-occupant Loans on < 5 Family Dwellings (A B C & D)
G) Loans On Manufactured Home Dwelling (A B C & D)
Number
Average Value
Number
Average Value
Number
Average Value
Number
Average Value
Number
Average Value
Number
Average Value
LOANS ORIGINATED
85
$132,630
81
$159,882
183
$137,634
59
$51,175
17
$84,141
30
$57,049
APPLICATIONS APPROVED, NOT ACCEPTED
6
$105,428
13
$63,322
32
$125,673
10
$50,172
2
$9,070
11
$39,011
APPLICATIONS DENIED
7
$119,150
58
$84,961
97
$95,759
77
$31,849
11
$64,036
51
$52,915
APPLICATIONS WITHDRAWN
2
$96,155
50
$136,334
82
$107,507
19
$68,441
7
$80,910
7
$125,580
FILES CLOSED FOR INCOMPLETENESS
0
$0
9
$153,834
5
$111,874
0
$0
0
$0
2
$47,215
Aggregated Statistics For Year 2008 (Based on 12 partial tracts)
A) FHA, FSA/RHS & VA Home Purchase Loans
B) Conventional Home Purchase Loans
C) Refinancings
D) Home Improvement Loans
F) Non-occupant Loans on < 5 Family Dwellings (A B C & D)
G) Loans On Manufactured Home Dwelling (A B C & D)
Number
Average Value
Number
Average Value
Number
Average Value
Number
Average Value
Number
Average Value
Number
Average Value
LOANS ORIGINATED
95
$120,555
171
$118,803
166
$120,128
68
$35,825
21
$86,903
60
$58,977
APPLICATIONS APPROVED, NOT ACCEPTED
9
$128,791
33
$91,597
31
$88,815
19
$29,698
0
$0
24
$48,476
APPLICATIONS DENIED
12
$101,409
92
$96,934
135
$100,737
109
$34,584
27
$57,936
48
$52,337
APPLICATIONS WITHDRAWN
10
$108,008
62
$113,582
80
$121,210
18
$71,929
0
$0
3
$99,337
FILES CLOSED FOR INCOMPLETENESS
2
$108,270
4
$274,852
13
$103,373
5
$52,974
2
$60,775
0
$0
Aggregated Statistics For Year 2007 (Based on 12 partial tracts)
A) FHA, FSA/RHS & VA Home Purchase Loans
B) Conventional Home Purchase Loans
C) Refinancings
D) Home Improvement Loans
E) Loans on Dwellings For 5+ Families
F) Non-occupant Loans on < 5 Family Dwellings (A B C & D)
G) Loans On Manufactured Home Dwelling (A B C & D)
Number
Average Value
Number
Average Value
Number
Average Value
Number
Average Value
Number
Average Value
Number
Average Value
Number
Average Value
LOANS ORIGINATED
56
$109,781
223
$112,424
187
$92,234
85
$40,700
2
$1,110,750
14
$61,112
54
$58,383
APPLICATIONS APPROVED, NOT ACCEPTED
7
$116,203
65
$78,010
25
$92,741
31
$29,692
2
$124,245
1
$36,550
36
$57,509
APPLICATIONS DENIED
10
$98,898
102
$67,703
171
$81,384
109
$24,056
0
$0
31
$44,365
63
$48,815
APPLICATIONS WITHDRAWN
5
$96,628
50
$96,734
76
$99,739
18
$27,872
0
$0
9
$85,699
3
$69,667
FILES CLOSED FOR INCOMPLETENESS
3
$122,353
4
$89,875
25
$95,498
6
$35,800
0
$0
2
$17,800
3
$59,973
Aggregated Statistics For Year 2006 (Based on 12 partial tracts)
A) FHA, FSA/RHS & VA Home Purchase Loans
B) Conventional Home Purchase Loans
C) Refinancings
D) Home Improvement Loans
F) Non-occupant Loans on < 5 Family Dwellings (A B C & D)
G) Loans On Manufactured Home Dwelling (A B C & D)
Number
Average Value
Number
Average Value
Number
Average Value
Number
Average Value
Number
Average Value
Number
Average Value
LOANS ORIGINATED
52
$95,440
260
$93,287
154
$85,897
89
$32,585
31
$73,438
56
$50,069
APPLICATIONS APPROVED, NOT ACCEPTED
2
$79,825
64
$64,220
33
$105,426
14
$54,627
3
$86,890
34
$37,355
APPLICATIONS DENIED
7
$35,393
141
$60,729
157
$83,709
113
$32,052
16
$50,035
104
$42,281
APPLICATIONS WITHDRAWN
5
$82,228
28
$118,869
126
$91,863
15
$35,855
2
$112,480
10
$60,621
FILES CLOSED FOR INCOMPLETENESS
0
$0
4
$61,495
35
$103,221
3
$107,377
0
$0
0
$0
Aggregated Statistics For Year 2005 (Based on 12 partial tracts)
A) FHA, FSA/RHS & VA Home Purchase Loans
B) Conventional Home Purchase Loans
C) Refinancings
D) Home Improvement Loans
E) Loans on Dwellings For 5+ Families
F) Non-occupant Loans on < 5 Family Dwellings (A B C & D)
G) Loans On Manufactured Home Dwelling (A B C & D)
Number
Average Value
Number
Average Value
Number
Average Value
Number
Average Value
Number
Average Value
Number
Average Value
Number
Average Value
LOANS ORIGINATED
81
$90,748
298
$94,724
228
$80,909
79
$36,465
2
$517,045
37
$91,280
82
$52,139
APPLICATIONS APPROVED, NOT ACCEPTED
9
$69,673
54
$57,830
54
$72,959
13
$31,378
0
$0
3
$47,037
42
$49,697
APPLICATIONS DENIED
17
$62,615
156
$51,965
206
$71,137
92
$19,660
0
$0
22
$63,185
138
$43,921
APPLICATIONS WITHDRAWN
2
$139,380
40
$93,246
113
$102,761
38
$151,345
0
$0
7
$140,910
7
$58,504
FILES CLOSED FOR INCOMPLETENESS
3
$94,070
5
$74,352
39
$94,196
6
$102,093
0
$0
2
$38,930
0
$0
Aggregated Statistics For Year 2004 (Based on 12 partial tracts)
A) FHA, FSA/RHS & VA Home Purchase Loans
B) Conventional Home Purchase Loans
C) Refinancings
D) Home Improvement Loans
F) Non-occupant Loans on < 5 Family Dwellings (A B C & D)
G) Loans On Manufactured Home Dwelling (A B C & D)
Number
Average Value
Number
Average Value
Number
Average Value
Number
Average Value
Number
Average Value
Number
Average Value
LOANS ORIGINATED
80
$80,075
259
$87,685
277
$82,172
101
$26,772
37
$52,171
84
$50,260
APPLICATIONS APPROVED, NOT ACCEPTED
3
$64,553
80
$64,444
61
$71,460
18
$22,425
0
$0
58
$40,521
APPLICATIONS DENIED
14
$84,721
187
$46,839
229
$75,452
106
$30,250
21
$50,343
155
$38,137
APPLICATIONS WITHDRAWN
10
$93,631
41
$155,368
145
$81,028
18
$32,978
6
$59,543
8
$55,445
FILES CLOSED FOR INCOMPLETENESS
2
$125,180
3
$69,437
61
$104,593
2
$39,140
2
$46,175
0
$0
Aggregated Statistics For Year 2003 (Based on 12 partial tracts)
A) FHA, FSA/RHS & VA Home Purchase Loans
B) Conventional Home Purchase Loans
C) Refinancings
D) Home Improvement Loans
F) Non-occupant Loans on < 5 Family Dwellings (A B C & D)
Number
Average Value
Number
Average Value
Number
Average Value
Number
Average Value
Number
Average Value
LOANS ORIGINATED
62
$80,350
250
$74,273
458
$78,937
59
$22,480
43
$65,764
APPLICATIONS APPROVED, NOT ACCEPTED
8
$47,241
57
$63,149
69
$94,575
15
$22,717
2
$31,050
APPLICATIONS DENIED
0
$0
149
$46,259
257
$62,547
59
$23,776
13
$38,788
APPLICATIONS WITHDRAWN
7
$77,743
37
$78,622
204
$68,548
11
$44,653
5
$101,958
FILES CLOSED FOR INCOMPLETENESS
3
$104,283
5
$59,506
20
$76,834
4
$60,775
0
$0
Aggregated Statistics For Year 2002 (Based on 10 partial tracts)
A) FHA, FSA/RHS & VA Home Purchase Loans
B) Conventional Home Purchase Loans
C) Refinancings
D) Home Improvement Loans
F) Non-occupant Loans on < 5 Family Dwellings (A B C & D)
Number
Average Value
Number
Average Value
Number
Average Value
Number
Average Value
Number
Average Value
LOANS ORIGINATED
87
$81,683
209
$77,257
266
$80,944
65
$19,278
27
$46,792
APPLICATIONS APPROVED, NOT ACCEPTED
2
$66,830
87
$61,838
45
$63,800
5
$16,328
7
$41,231
APPLICATIONS DENIED
12
$89,721
136
$46,279
155
$57,586
26
$12,381
9
$36,684
APPLICATIONS WITHDRAWN
9
$73,993
17
$92,944
96
$57,876
3
$36,420
0
$0
FILES CLOSED FOR INCOMPLETENESS
4
$69,392
4
$128,040
9
$58,367
2
$31,750
0
$0
Aggregated Statistics For Year 2001 (Based on 10 partial tracts)
A) FHA, FSA/RHS & VA Home Purchase Loans
B) Conventional Home Purchase Loans
C) Refinancings
D) Home Improvement Loans
F) Non-occupant Loans on < 5 Family Dwellings (A B C & D)
Number
Average Value
Number
Average Value
Number
Average Value
Number
Average Value
Number
Average Value
LOANS ORIGINATED
84
$73,585
245
$75,990
206
$72,003
88
$18,835
21
$43,874
APPLICATIONS APPROVED, NOT ACCEPTED
5
$54,206
75
$54,938
35
$61,686
3
$105,413
2
$29,935
APPLICATIONS DENIED
5
$81,518
156
$45,891
99
$54,205
31
$17,697
14
$29,303
APPLICATIONS WITHDRAWN
5
$100,870
32
$74,629
91
$59,522
6
$9,890
4
$30,842
FILES CLOSED FOR INCOMPLETENESS
2
$67,125
12
$73,385
4
$33,562
1
$19,760
0
$0
Aggregated Statistics For Year 2000 (Based on 10 partial tracts)
A) FHA, FSA/RHS & VA Home Purchase Loans
B) Conventional Home Purchase Loans
C) Refinancings
D) Home Improvement Loans
F) Non-occupant Loans on < 5 Family Dwellings (A B C & D)
Number
Average Value
Number
Average Value
Number
Average Value
Number
Average Value
Number
Average Value
LOANS ORIGINATED
86
$70,884
245
$70,898
70
$59,960
63
$21,841
24
$35,638
APPLICATIONS APPROVED, NOT ACCEPTED
14
$52,823
74
$55,339
28
$52,766
10
$58,189
0
$0
APPLICATIONS DENIED
31
$53,472
172
$44,879
40
$38,918
42
$17,630
10
$28,786
APPLICATIONS WITHDRAWN
4
$97,142
26
$73,057
23
$51,352
2
$3,520
0
$0
FILES CLOSED FOR INCOMPLETENESS
0
$0
2
$32,305
31
$60,595
0
$0
0
$0
Aggregated Statistics For Year 1999 (Based on 1 full and 6 partial tracts)
A) FHA, FSA/RHS & VA Home Purchase Loans
B) Conventional Home Purchase Loans
C) Refinancings
D) Home Improvement Loans
F) Non-occupant Loans on < 5 Family Dwellings (A B C & D)
2002 - 2018 National Fire Incident Reporting System (NFIRS) incidents
According to the data from the years 2002 - 2018 the average number of fires per year is 121. The highest number of fires - 213 took place in 2011, and the least - 60 in 2004. The data has an increasing trend.
When looking into fire subcategories, the most incidents belonged to: Outside Fires (72.2%), and Structure Fires (14.6%).
Fire incident types reported to NFIRS in Zip Code 77905


 Nearest zip codes: 77901, 77960, 77951, 77988, 77973, 77904.


 According to the data from the years 2002 - 2018 the average number of fires per year is 121. The highest number of fires - 213 took place in 2011, and the least - 60 in 2004. The data has an increasing trend.
 When looking into fire subcategories, the most incidents belonged to: Outside Fires (72.2%), and Structure Fires (14.6%).