Estimated zip code population in 2022: 7,414 Zip code population in 2010: 6,981 Zip code population in 2000: 6,730
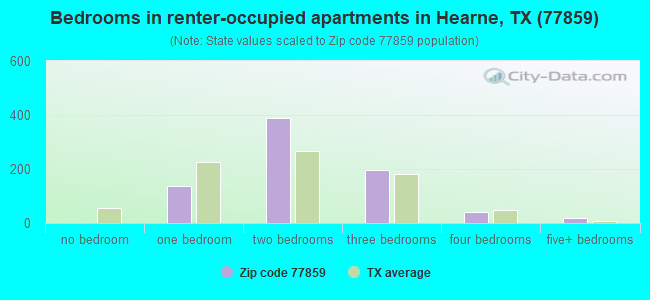
Houses and condos: 3,344 Renter-occupied apartments: 796
% of renters here:
28%
State:
38%
March 2022 cost of living index in zip code 77859: 85.3 (less than average, U.S. average is 100)
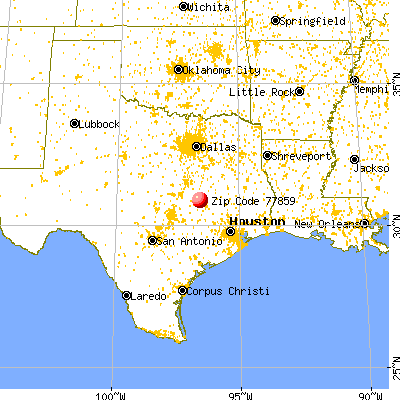
Land area: 169.7 sq. mi. Water area: 1.5 sq. mi.
Population density: 44 people per square mile
(very low).
OSM Map
General Map
Google Map
MSN Map
OSM Map
General Map
Google Map
MSN Map
OSM Map
General Map
Google Map
MSN Map
OSM Map
General Map
Google Map
MSN Map
Please wait while loading the map...
Real estate property taxes paid for housing units in 2022:
This zip code:
1.0% ($1,369)
Texas:
1.5% ($4,050)
Median real estate property taxes paid for housing units with mortgages in 2022: $2,245 (1.2%) Median real estate property taxes paid for housing units with no mortgage in 2022: $1,221 (1.0%)
Business Search- 14 Million verified businesses
Males: 3,831
(51.7%)
Females: 3,583
(48.3%)
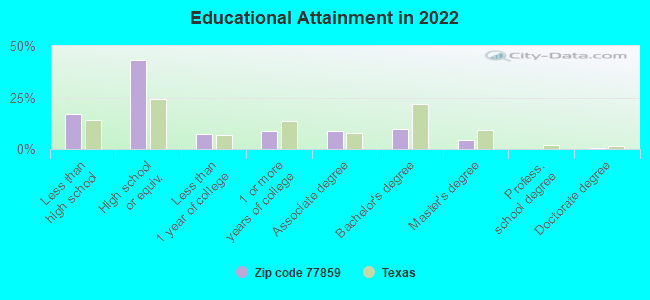
For population 25 years and over in 77859:
High school or higher: 82.4%
Bachelor's degree or higher: 15.0%
Graduate or professional degree: 5.1%
Unemployed: 10.0%
Mean travel time to work (commute): 23.1 minutes
For population 15 years and over in 77859:
Never married: 41.6%
Now married: 38.5%
Separated: 1.4%
Widowed: 6.7%
Divorced: 11.9%
Zip code 77859 compared to state average:
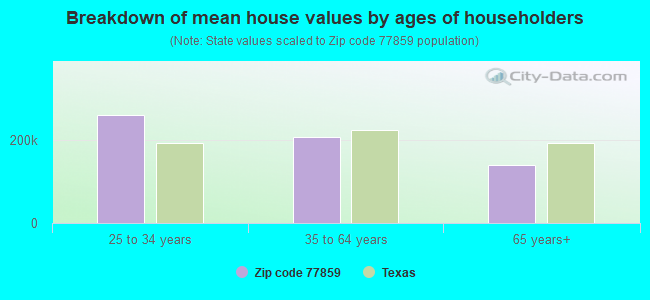
Median house value below state average.
Unemployed percentage above state average.
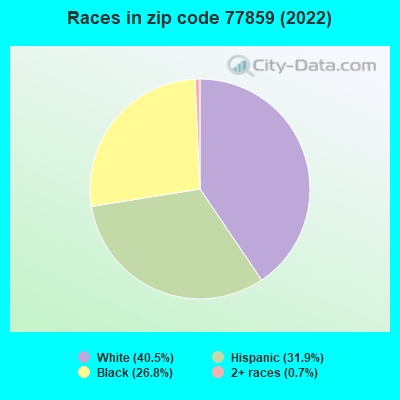
Black race population percentage above state average.
Median age above state average.
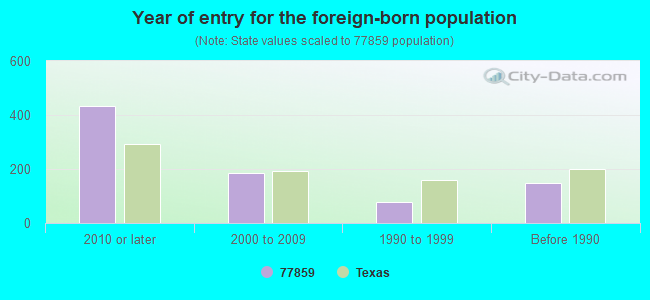
Foreign-born population percentage significantly below state average.
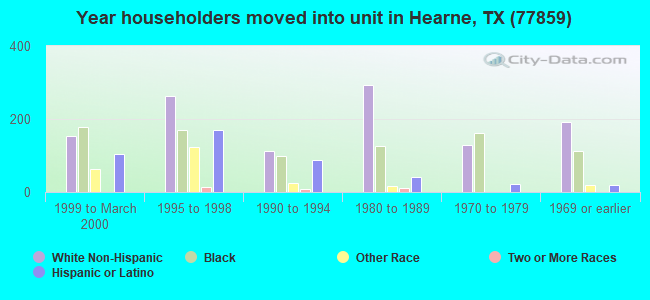
Length of stay since moving in significantly above state average.
House age above state average.
Percentage of population with a bachelor's degree or higher below state average.
Averages for the 2020 tax year for zip code 77859, filed in 2021:
Average Adjusted Gross Income (AGI) in 2020: $46,338 (Individual Income Tax Returns)
Here:
$46,338
State:
$77,054
Salary/wage: $40,177 (reported on 84.3% of returns)
Here:
$40,177
State:
$62,766
(% of AGI for various income ranges: 1451.1% for AGIs below $25k, 3880.7% for AGIs $25k-50k, 6817.7% for AGIs $50k-75k, 10029.2% for AGIs $75k-100k, 13920.6% for AGIs $100k-200k)
Taxable interest for individuals: $1,200 (reported on 18.6% of returns)
This zip code:
$1,200
Texas:
$2,665
(% of AGI for various income ranges: 7.1% for AGIs below $25k, 13.8% for AGIs $25k-50k, 27.7% for AGIs $50k-75k, 64.6% for AGIs $75k-100k, 120.6% for AGIs $100k-200k)
Ordinary dividends: $4,230 (reported on 8.5% of returns)
Here:
$4,230
State:
$10,044
(% of AGI for various income ranges: 3.6% for AGIs below $25k, 32.8% for AGIs $25k-50k, 28.7% for AGIs $50k-75k, 88.5% for AGIs $75k-100k, 233.1% for AGIs $100k-200k)
Net capital gain/loss in AGI: +$13,808 (reported on 7.9% of returns)
Here:
+$13,808
State:
+$39,590
(% of AGI for various income ranges: 3.2% for AGIs below $25k, 18.1% for AGIs $25k-50k, 44.7% for AGIs $50k-75k, 146.9% for AGIs $75k-100k, 460.0% for AGIs $100k-200k)
Profit/loss from business: +$5,149 (reported on 17.9% of returns)
Here:
+$5,149
State:
+$10,888
(% of AGI for various income ranges: 98.7% for AGIs below $25k, 123.3% for AGIs $50k-75k, 438.5% for AGIs $75k-100k, 696.9% for AGIs $100k-200k)
Taxable individual retirement arrangement distribution: $23,012 (reported on 5.3% of returns)
77859:
$23,012
Texas:
$24,740
(% of AGI for various income ranges: 28.0% for AGIs below $25k, 43.6% for AGIs $25k-50k, 184.3% for AGIs $50k-75k, 279.2% for AGIs $75k-100k, 1500.6% for AGIs $100k-200k)
Total itemized deductions: $33,753 (reported on 4.7% of returns)
Here:
$33,753
State:
$40,428
(% of AGI for various income ranges: 195.7% for AGIs $25k-50k, 534.3% for AGIs $50k-75k, 583.1% for AGIs $100k-200k)
Charity contributions: $12,464 (reported on 3.5% of returns)
Here:
$12,464
State:
$18,201
(% of AGI for various income ranges: 28.6% for AGIs $25k-50k, 110.3% for AGIs $50k-75k, 517.5% for AGIs $100k-200k)
Taxes paid: $6,533 (reported on 3.8% of returns)
77859:
$6,533
State:
$7,821
(% of AGI for various income ranges: 13.5% for AGIs $25k-50k, 102.7% for AGIs $50k-75k, 128.1% for AGIs $100k-200k)
Earned income credit: $2,701 (reported on 28.6% of returns)
Here:
$2,701
State:
$2,584
(% of AGI for various income ranges: 180.7% for AGIs below $25k, 95.3% for AGIs $25k-50k)
Percentage of individuals using paid preparers for their 2020 taxes: 89.6%
Here:
90%
State:
92%
(% for various income ranges: 87.7% for AGIs below $25k, 89.4% for AGIs $25k-50k, 90.5% for AGIs $50k-75k, 95.2% for AGIs $75k-100k, 92.0% for AGIs $100k-200k, 100.0% for AGIs over 200k)
Averages for the 2012 tax year for zip code 77859, filed in 2013:
Average Adjusted Gross Income (AGI) in 2012: $39,555 (Individual Income Tax Returns)
Here:
$39,555
State:
$65,384
Salary/wage: $32,999 (reported on 86.2% of returns)
Here:
$32,999
State:
$52,524
(% of AGI for various income ranges: 81.9% for AGIs below $25k, 85.3% for AGIs $25k-50k, 81.7% for AGIs $50k-75k, 74.2% for AGIs $75k-100k, 66.3% for AGIs $100k-200k, 25.6% for AGIs over 200k)
Taxable interest for individuals: $1,159 (reported on 19.8% of returns)
This zip code:
$1,159
Texas:
$2,372
(% of AGI for various income ranges: 0.6% for AGIs below $25k, 0.5% for AGIs $25k-50k, 0.4% for AGIs $50k-75k, 0.3% for AGIs $75k-100k, 0.7% for AGIs $100k-200k, 1.1% for AGIs over 200k)
Ordinary dividends: $3,203 (reported on 9.7% of returns)
Here:
$3,203
State:
$9,721
(% of AGI for various income ranges: 1.1% for AGIs below $25k, 0.3% for AGIs $25k-50k, 0.6% for AGIs $50k-75k, 0.4% for AGIs $75k-100k, 0.9% for AGIs $100k-200k, 1.6% for AGIs over 200k)
Net capital gain/loss in AGI: +$14,273 (reported on 7.4% of returns)
Here:
+$14,273
State:
+$35,319
(% of AGI for various income ranges: 0.2% for AGIs below $25k, 0.5% for AGIs $25k-50k, 0.6% for AGIs $50k-75k, 1.5% for AGIs $75k-100k, 3.7% for AGIs $100k-200k, 12.6% for AGIs over 200k)
Profit/loss from business: +$8,188 (reported on 17.1% of returns)
Here:
+$8,188
State:
+$13,732
(% of AGI for various income ranges: 6.8% for AGIs below $25k, 2.3% for AGIs $25k-50k, 1.9% for AGIs $50k-75k, 4.0% for AGIs $75k-100k, 5.8% for AGIs $100k-200k)
Taxable individual retirement arrangement distribution: $13,612 (reported on 5.7% of returns)
77859:
$13,612
Texas:
$19,511
(% of AGI for various income ranges: 1.2% for AGIs below $25k, 1.1% for AGIs $25k-50k, 2.0% for AGIs $50k-75k, 1.8% for AGIs $75k-100k, 5.2% for AGIs $100k-200k)
Total itemized deductions: $20,202 (23% of AGI, reported on 14.1% of returns)
Here:
$20,202
State:
$24,724
Here:
23.0% of AGI
State:
15.9% of AGI
(% of AGI for various income ranges: 5.4% for AGIs below $25k, 7.1% for AGIs $25k-50k, 7.3% for AGIs $50k-75k, 9.6% for AGIs $75k-100k, 8.2% for AGIs $100k-200k, 5.8% for AGIs over 200k)
Charity contributions: $4,831 (reported on 9.7% of returns)
Here:
$4,831
State:
$6,808
(% of AGI for various income ranges: 0.4% for AGIs below $25k, 1.0% for AGIs $25k-50k, 1.2% for AGIs $50k-75k, 1.5% for AGIs $75k-100k, 2.0% for AGIs $100k-200k, 1.0% for AGIs over 200k)
Taxes paid: $4,043 (reported on 13.4% of returns)
77859:
$4,043
State:
$6,921
(% of AGI for various income ranges: 0.9% for AGIs below $25k, 1.1% for AGIs $25k-50k, 1.2% for AGIs $50k-75k, 1.6% for AGIs $75k-100k, 2.1% for AGIs $100k-200k, 1.4% for AGIs over 200k)
Earned income credit: $2,712 (reported on 32.6% of returns)
Here:
$2,712
State:
$2,570
(% of AGI for various income ranges: 11.4% for AGIs below $25k, 1.5% for AGIs $25k-50k)
Percentage of individuals using paid preparers for their 2012 taxes: 52.7%
Here:
53%
State:
51%
(% for various income ranges: 48.7% for AGIs below $25k, 52.0% for AGIs $25k-50k, 57.1% for AGIs $50k-75k, 62.5% for AGIs $75k-100k, 68.8% for AGIs $100k-200k, 75.0% for AGIs over 200k)
Averages for the 2004 tax year for zip code 77859, filed in 2005:
Average Adjusted Gross Income (AGI) in 2004: $30,320 (Individual Income Tax Returns)
Here:
$30,320
State:
$47,881
Salary/wage: $27,403 (reported on 87.7% of returns)
Here:
$27,403
State:
$41,947
(% of AGI for various income ranges: 117.5% for AGIs below $10k, 87.8% for AGIs $10k-25k, 87.7% for AGIs $25k-50k, 82.8% for AGIs $50k-75k, 77.5% for AGIs $75k-100k, 50.2% for AGIs over 100k)
Taxable interest for individuals: $1,964 (reported on 23.3% of returns)
This zip code:
$1,964
Texas:
$2,255
(% of AGI for various income ranges: 3.5% for AGIs below $10k, 1.4% for AGIs $10k-25k, 0.9% for AGIs $25k-50k, 1.7% for AGIs $50k-75k, 1.1% for AGIs $75k-100k, 2.1% for AGIs over 100k)
Taxable dividends: $1,597 (reported on 10.1% of returns)
Here:
$1,597
State:
$4,261
(% of AGI for various income ranges: 1.1% for AGIs below $10k, 0.4% for AGIs $10k-25k, 0.4% for AGIs $25k-50k, 0.6% for AGIs $50k-75k, 0.6% for AGIs $75k-100k, 0.7% for AGIs over 100k)
Net capital gain/loss: +$3,232 (reported on 9.5% of returns)
Here:
+$3,232
State:
+$16,110
(% of AGI for various income ranges: -1.5% for AGIs below $10k, 0.2% for AGIs $10k-25k, 0.4% for AGIs $25k-50k, 0.4% for AGIs $50k-75k, 0.8% for AGIs $75k-100k, 3.8% for AGIs over 100k)
Profit/loss from business: +$5,172 (reported on 15.1% of returns)
Here:
+$5,172
State:
+$11,013
(% of AGI for various income ranges: 9.3% for AGIs below $10k, 3.2% for AGIs $10k-25k, 1.0% for AGIs $25k-50k, 0.7% for AGIs $50k-75k, 3.8% for AGIs $75k-100k, 4.0% for AGIs over 100k)
IRA payment deduction: $3,472 (reported on 1.8% of returns)
77859:
$3,472
Texas:
$3,120
(% of AGI for various income ranges: 1.2% for AGIs below $10k, 0.2% for AGIs $25k-50k, 0.3% for AGIs $50k-75k, 0.5% for AGIs $75k-100k)
Total itemized deductions: $18,158 (28% of AGI, reported on 11.6% of returns)
Here:
$18,158
State:
$19,631
Here:
27.8% of AGI
State:
18.9% of AGI
(% of AGI for various income ranges: 6.2% for AGIs below $10k, 3.5% for AGIs $10k-25k, 6.7% for AGIs $25k-50k, 7.7% for AGIs $50k-75k, 8.6% for AGIs $75k-100k, 9.0% for AGIs over 100k)
Charity contributions deductions: $4,188 (6% of AGI, reported on 9.4% of returns)
Here:
$4,188
State:
$4,753
Here:
5.9% of AGI
State:
4.2% of AGI
(% of AGI for various income ranges: 0.5% for AGIs $10k-25k, 1.1% for AGIs $25k-50k, 1.4% for AGIs $50k-75k, 2.2% for AGIs $75k-100k, 1.8% for AGIs over 100k)
Total tax: $4,704 (reported on 58.1% of returns)
77859:
$4,704
State:
$9,058
(% of AGI for various income ranges: 3.3% for AGIs below $10k, 2.7% for AGIs $10k-25k, 5.4% for AGIs $25k-50k, 8.6% for AGIs $50k-75k, 11.3% for AGIs $75k-100k, 20.4% for AGIs over 100k)
Earned income credit: $2,102 (reported on 35.9% of returns)
Here:
$2,102
State:
$2,024
Percentage of individuals using paid preparers for their 2004 taxes: 59.2%
Here:
59%
State:
57%
(% for various income ranges: 50.9% for AGIs below $10k, 63.5% for AGIs $10k-25k, 60.2% for AGIs $25k-50k, 55.3% for AGIs $50k-75k, 64.8% for AGIs $75k-100k, 73.0% for AGIs over 100k)
Household received Food Stamps/SNAP in the past 12 months: 658 Household did not receive Food Stamps/SNAP in the past 12 months: 2,231
Women who had a birth in the past 12 months: 196 (36 now married, 153 unmarried) Women who did not have a birth in the past 12 months: 1,562 (532 now married, 1,034 unmarried)
Housing units in zip code 77859 with a mortgage: 544 (15 second mortgage, 16 both second mortgage and home equity loan) Median monthly owner costs for units with a mortgage: $1,478 Median monthly owner costs for units without a mortgage: $434
Residents with income below the poverty level in 2022:
This zip code:
23.2%
Whole state:
14.0%
Residents with income below 50% of the poverty level in 2022:
This zip code:
13.4%
Whole state:
7.4%
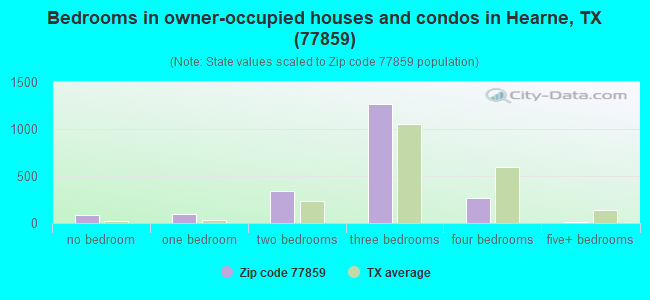
Median number of rooms in houses and condos:
Here:
5.6
State:
6.3
Median number of rooms in apartments:
Here:
4.2
State:
4.0
Notable locations in this zip code not listed on our city pages
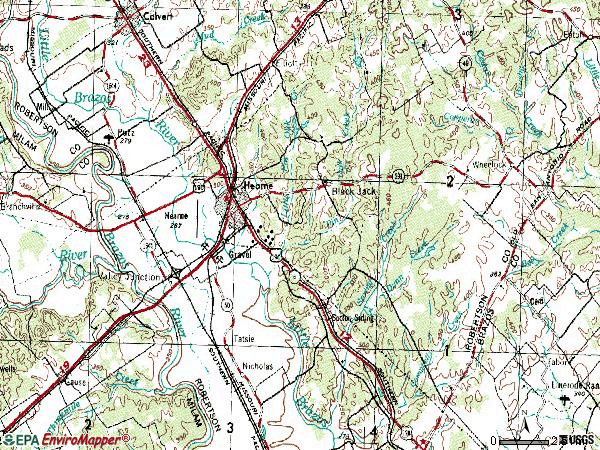
Notable locations in zip code 77859: Kings Highway (A), Blackjack Volunteer Fire Department (B), Brazos County District 2 Edge Station (C), Robert C Allen House (D). Display/hide their locations on the map
Churches in zip code 77859 include: True Light Church (A), Trinity Church (B), Bethany Church (C), Calvary Church (D), Hamilton Chapel (E), Lees Chapel (F), Manning Church (G), Saint Emmanuel Church (H), Saint Lukes Church (I). Display/hide their locations on the map
Cemeteries: Providence Cemetery (1), Saint Luke Cemetery (2), Norwood Cemetery (3), Edge Cemetery (4), Saint Lukes Cemetery (5), Cordey Cemetery (6), Concord Cemetery (7). Display/hide their locations on the map
Reservoirs: Matejka Lake (A), Pryor Lake (B), Stuewe Lake (C), McGuire Lake (D), McGuire Lakes Number 2 (E), Weaver Lake (F). Display/hide their locations on the map
Streams, rivers, and creeks: Smith Branch (A), Snake Branch (B), West Caney Creek (C), Suggs Branch (D), Pin Oak Creek (E), Cajka Branch (F), Parker Branch (G), Melton Branch (H), McDonald Creek (I). Display/hide their locations on the map
In group quarters: 6 (-1 institutionalized population)
Size of family households: 905 2-persons, 265 3-persons, 276 4-persons, 186 5-persons, 66 6-persons, 87 7-or-more-persons
Size of nonfamily households: 1,076 1-person, 20 2-persons
822 married couples with children.
512 single-parent households (10 men, 502 women).
80.8% of residents of 77859 zip code speak English at home.
16.1% of residents speak Spanish at home (81% very well, 4% well, 15% not well).
3.0% of residents speak other language at home (100% very well).
Foreign born population: 459 (6.2%) (37.4% of them are naturalized citizens)
This zip code:
6.2%
Whole state:
17.2%
66%Honduras
9%France
0%Greece
6%German
3%Irish
3%Swedish
2%Polish
2%American
2%Italian
2%Scotch-Irish
Year of entry for the foreign-born population
4322010 or later
1872000 to 2009
791990 to 1999
148Before 1990
Housing units lacking complete plumbing facilities: 7.7% Housing units lacking complete kitchen facilities: 3.9%
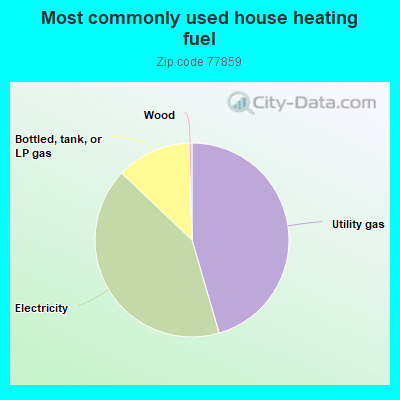
45.5%Utility gas
41.6%Electricity
12.4%Bottled, tank, or LP gas
0.5%Wood
Population in 1990: 7,655.
Place of birth for U.S.-born residents:
This state: 5,674
Northeast: 81
Midwest: 238
South: 317
West: 239
60% of the 77859 zip code residents lived in the same house 5 years ago. Out of people who lived in different houses, 58% lived in this county. Out of people who lived in different counties, 50% lived in Texas.
91% of the 77859 zip code residents lived in the same house 1 year ago. Out of people who lived in different houses, 34% moved from this county. Out of people who lived in different houses, 64% moved from different county within same state. Out of people who lived in different houses, 4% moved from different state.
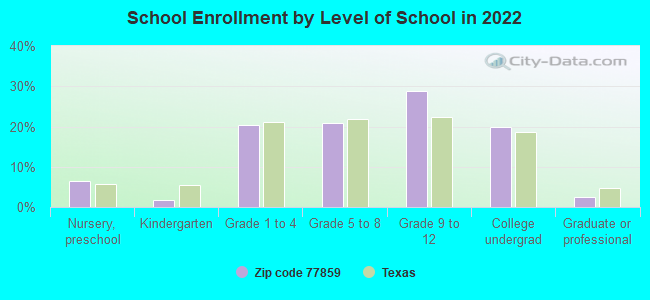
Private vs. public school enrollment:
Students in private schools in grades 1 to 8 (elementary and middle school): 142
Here:
22.5%
Texas:
8.8%
Students in private schools in grades 9 to 12 (high school):
Here:
0.0%
Texas:
8.0%
Students in private undergraduate colleges: 69
Here:
23.4%
Texas:
16.2%
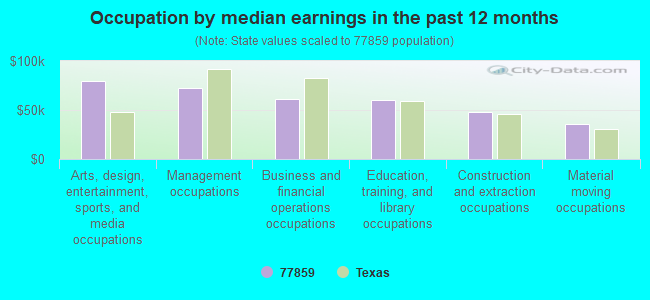
Occupation by median earnings in the past 12 months ($)
80,025Arts, design, entertainment, sports, and media occupations
72,193Management occupations
61,665Business and financial operations occupations
59,876Education, training, and library occupations
47,824Construction and extraction occupations
35,738Material moving occupations
Companies with federal contracts located in this zip code:
EAGLE DIPOSAL COMPANY (INC) (110 CEDAR ST in HEARNE, TX; small business)
$74,671 with U.S. Army Corps of Engineers - civil program financing only for Trash/Garbage Collection Services - Including Portable Sanitation Services. Signed on 1999-10-21. Completion date: 2000-09-30.
Top industries in this zip code by the number of employees in 2005:
Health Care and Social Assistance: Home Health Care Services (50-99: 1)
Health Care and Social Assistance: Nursing Care Facilities (50-99: 1)
Accommodation and Food Services: Limited-Service Restaurants (20-49: 2)
Accommodation and Food Services: Hotels (except Casino Hotels) and Motels (20-49: 1, 10-19: 1)
People in group quarters in 2010:
6 people in group homes for juveniles (non-correctional)
6 people in group homes intended for adults
People in group quarters in 2000:
70 people in nursing homes
Fatal accident statistics in 2014:
Fatal accident count: 1
Vehicles involved in fatal accidents: 1
Fatal accidents caused by drunken drivers: 0
Fatalities: 1
Persons involved in fatal accidents: 1
Pedestrians involved in fatal accidents: 0
Fatal accident statistics in 2013:
Fatal accident count: 2
Vehicles involved in fatal accidents: 3
Fatal accidents caused by drunken drivers: 2
Fatalities: 2
Persons involved in fatal accidents: 3
Pedestrians involved in fatal accidents: 0
2002 - 2018 National Fire Incident Reporting System (NFIRS) incidents
According to the data from the years 2002 - 2018 the average number of fires per year is 53. The highest number of reported fires - 284 took place in 2006, and the least - 4 in 2012. The data has an increasing trend.
When looking into fire subcategories, the most reports belonged to: Other (61.2%), and Outside Fires (28.4%).
Fire incident types reported to NFIRS in Zip Code 77859


 Nearest zip codes: 77867, 77857, 77807, 77837, 77808, 77856.
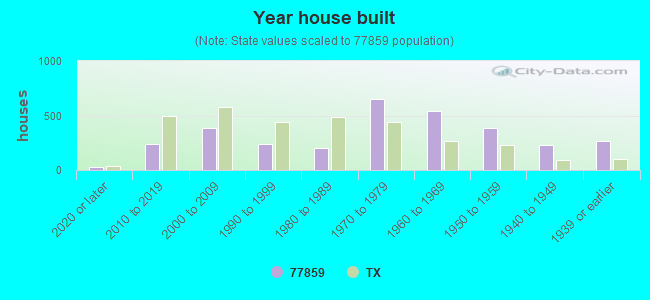


 According to the data from the years 2002 - 2018 the average number of fires per year is 53. The highest number of reported fires - 284 took place in 2006, and the least - 4 in 2012. The data has an increasing trend.
 When looking into fire subcategories, the most reports belonged to: Other (61.2%), and Outside Fires (28.4%).