Estimated zip code population in 2022: 576 Zip code population in 2010: 1,191 Zip code population in 2000: 1,298
Houses and condos: 222 Renter-occupied apartments: 23
% of renters here:
10%
State:
38%
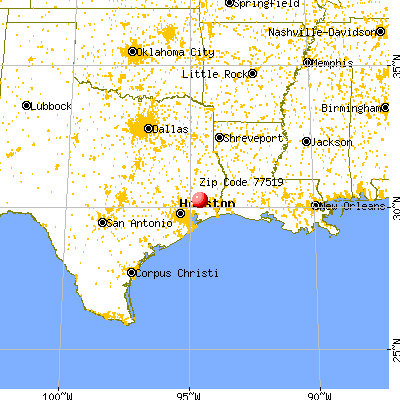
March 2022 cost of living index in zip code 77519: 79.2 (low, U.S. average is 100)
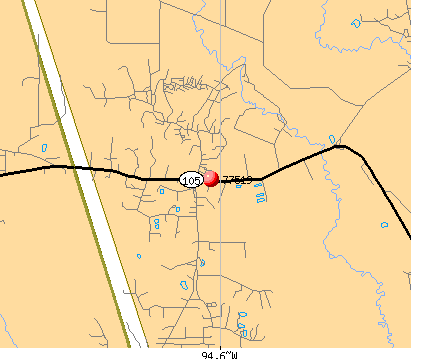
Land area: 41.4 sq. mi. Water area: 0.2 sq. mi.
Population density: 14 people per square mile
(very low).
OSM Map
General Map
Google Map
MSN Map
OSM Map
General Map
Google Map
MSN Map
OSM Map
General Map
Google Map
MSN Map
OSM Map
General Map
Google Map
MSN Map
Please wait while loading the map...
Median real estate property taxes paid for housing units with mortgages in 2022: $209 Median real estate property taxes paid for housing units with no mortgage in 2022: $1,235
Business Search- 14 Million verified businesses
Males: 304
(52.8%)
Females: 272
(47.2%)
For population 25 years and over in 77519:
High school or higher: 91.8%
Bachelor's degree or higher: 17.4%
Graduate or professional degree: 5.2%
Unemployed: 14.0%
Mean travel time to work (commute): 38.4 minutes
For population 15 years and over in 77519:
Never married: 26.8%
Now married: 40.8%
Separated: 0.0%
Widowed: 19.3%
Divorced: 13.1%
Zip code 77519 compared to state average:
Median house value significantly below state average.
Unemployed percentage significantly above state average.
Black race population percentage significantly below state average.
Hispanic race population percentage significantly below state average.
Median age significantly above state average.
Foreign-born population percentage significantly below state average.
Renting percentage significantly below state average.
Length of stay since moving in significantly below state average.
Number of college students above state average.
Percentage of population with a bachelor's degree or higher below state average.
Averages for the 2020 tax year for zip code 77519, filed in 2021:
Average Adjusted Gross Income (AGI) in 2020: $57,743 (Individual Income Tax Returns)
Here:
$57,743
State:
$77,054
Salary/wage: $56,010 (reported on 84.8% of returns)
Here:
$56,010
State:
$62,766
(% of AGI for various income ranges: 1155.5% for AGIs below $25k, 3428.9% for AGIs $25k-50k, 6568.3% for AGIs $50k-75k, 11453.3% for AGIs $75k-100k, 16850.0% for AGIs $100k-200k)
Taxable interest for individuals: $256 (reported on 19.6% of returns)
This zip code:
$256
Texas:
$2,665
(% of AGI for various income ranges: 13.6% for AGIs below $25k, 10.0% for AGIs $50k-75k, 3.3% for AGIs $100k-200k)
Profit/loss from business: +$1,320 (reported on 21.7% of returns)
Here:
+$1,320
State:
+$10,888
(% of AGI for various income ranges: 297.3% for AGIs below $25k, 13.3% for AGIs $75k-100k)
Taxable individual retirement arrangement distribution: $14,867 (reported on 6.5% of returns)
77519:
$14,867
Texas:
$24,740
(% of AGI for various income ranges: 405.5% for AGIs below $25k)
Earned income credit: $2,078 (reported on 19.6% of returns)
Here:
$2,078
State:
$2,584
(% of AGI for various income ranges: 106.4% for AGIs below $25k, 77.8% for AGIs $25k-50k)
Percentage of individuals using paid preparers for their 2020 taxes: 89.1%
Here:
89%
State:
92%
(% for various income ranges: 93.3% for AGIs below $25k, 90.0% for AGIs $25k-50k, 100.0% for AGIs $50k-75k, 80.0% for AGIs $75k-100k, 77.8% for AGIs $100k-200k)
Averages for the 2012 tax year for zip code 77519, filed in 2013:
Average Adjusted Gross Income (AGI) in 2012: $56,141 (Individual Income Tax Returns)
Here:
$56,141
State:
$65,384
Salary/wage: $54,734 (reported on 86.4% of returns)
Here:
$54,734
State:
$52,524
(% of AGI for various income ranges: 63.5% for AGIs below $25k, 82.1% for AGIs $25k-50k, 90.7% for AGIs $50k-75k, 86.7% for AGIs $75k-100k, 84.8% for AGIs $100k-200k)
Taxable interest for individuals: $218 (reported on 25.0% of returns)
This zip code:
$218
Texas:
$2,372
(% of AGI for various income ranges: 0.6% for AGIs below $25k, 0.1% for AGIs $25k-50k)
Ordinary dividends: $450 (reported on 4.5% of returns)
Here:
$450
State:
$9,721
Profit/loss from business: +$10,060 (reported on 22.7% of returns)
Here:
+$10,060
State:
+$13,732
(% of AGI for various income ranges: 11.3% for AGIs below $25k, 8.4% for AGIs $25k-50k, 9.2% for AGIs $75k-100k)
Total itemized deductions: $18,950 (22% of AGI, reported on 18.2% of returns)
Here:
$18,950
State:
$24,724
Here:
21.8% of AGI
State:
15.9% of AGI
(% of AGI for various income ranges: 11.5% for AGIs $25k-50k, 7.2% for AGIs $75k-100k, 7.2% for AGIs $100k-200k)
Charity contributions: $6,160 (reported on 11.4% of returns)
Here:
$6,160
State:
$6,808
(% of AGI for various income ranges: 4.0% for AGIs $50k-75k, 1.5% for AGIs $100k-200k)
Taxes paid: $2,962 (reported on 18.2% of returns)
77519:
$2,962
State:
$6,921
(% of AGI for various income ranges: 1.4% for AGIs $25k-50k, 1.6% for AGIs $75k-100k, 1.0% for AGIs $100k-200k)
Earned income credit: $2,056 (reported on 20.5% of returns)
Here:
$2,056
State:
$2,570
(% of AGI for various income ranges: 7.5% for AGIs below $25k, 1.3% for AGIs $25k-50k)
Percentage of individuals using paid preparers for their 2012 taxes: 70.5%
Here:
70%
State:
51%
(% for various income ranges: 66.7% for AGIs below $25k, 70.0% for AGIs $25k-50k, 83.3% for AGIs $50k-75k, 66.7% for AGIs $75k-100k, 71.4% for AGIs $100k-200k)
Averages for the 2004 tax year for zip code 77519, filed in 2005:
Average Adjusted Gross Income (AGI) in 2004: $33,628 (Individual Income Tax Returns)
Here:
$33,628
State:
$47,881
Salary/wage: $34,889 (reported on 87.7% of returns)
Here:
$34,889
State:
$41,947
(% of AGI for various income ranges: 126.5% for AGIs below $10k, 74.9% for AGIs $10k-25k, 95.4% for AGIs $25k-50k, 94.9% for AGIs $50k-75k, 83.6% for AGIs $75k-100k)
Taxable interest for individuals: $594 (reported on 25.1% of returns)
This zip code:
$594
Texas:
$2,255
(% of AGI for various income ranges: 1.0% for AGIs below $10k, 2.2% for AGIs $10k-25k, 0.2% for AGIs $25k-50k, 0.1% for AGIs $50k-75k, 0.2% for AGIs $75k-100k)
Taxable dividends: $125 (reported on 3.8% of returns)
Here:
$125
State:
$4,261
Profit/loss from business: +$3,224 (reported on 18.0% of returns)
Here:
+$3,224
State:
+$11,013
(% of AGI for various income ranges: 7.7% for AGIs below $10k, 14.3% for AGIs $10k-25k, -0.2% for AGIs $25k-50k, -1.2% for AGIs $50k-75k)
Total itemized deductions: $19,167 (35% of AGI, reported on 12.8% of returns)
Here:
$19,167
State:
$19,631
Here:
35.2% of AGI
State:
18.9% of AGI
Charity contributions deductions: $3,814 (6% of AGI, reported on 10.2% of returns)
Here:
$3,814
State:
$4,753
Here:
6.5% of AGI
State:
4.2% of AGI
Total tax: $3,317 (reported on 69.4% of returns)
77519:
$3,317
State:
$9,058
(% of AGI for various income ranges: 2.5% for AGIs below $10k, 4.2% for AGIs $10k-25k, 5.1% for AGIs $25k-50k, 7.8% for AGIs $50k-75k, 10.4% for AGIs $75k-100k)
Earned income credit: $1,745 (reported on 24.2% of returns)
Here:
$1,745
State:
$2,024
Percentage of individuals using paid preparers for their 2004 taxes: 64.5%
Here:
64%
State:
57%
(% for various income ranges: 58.0% for AGIs below $10k, 66.4% for AGIs $10k-25k, 59.3% for AGIs $25k-50k, 77.4% for AGIs $50k-75k, 58.6% for AGIs $75k-100k)
Household received Food Stamps/SNAP in the past 12 months: 28 Household did not receive Food Stamps/SNAP in the past 12 months: 197
Women who did not have a birth in the past 12 months: 155 (35 now married, 120 unmarried)
Housing units in zip code 77519 with a mortgage: 78 Median monthly owner costs for units with a mortgage: $942 Median monthly owner costs for units without a mortgage: $531
Residents with income below the poverty level in 2022:
This zip code:
2.9%
Whole state:
14.0%
Residents with income below 50% of the poverty level in 2022:
This zip code:
1.6%
Whole state:
7.4%
Median number of rooms in houses and condos:
Here:
5.8
State:
6.3
Notable locations in this zip code not listed on our city pages
Size of family households: 94 2-persons, 30 3-persons, 52 4-persons
Size of nonfamily households: 37 1-person, 10 2-persons
100.2% of residents of 77519 zip code speak English at home.
Foreign born population: 0 (0.0%)
:
0.0%
Whole state:
17.2%
103%English
9%American
Facilities with environmental interests located in this zip code:
AMERICAN TELEPHONE AND TELEGRAPH CORPORA (HIGHWAY 770 1.5 MI S in BATSON, TX)
(Resource Conservation and Recovery Act (tracking hazardous waste)) Alternative names: AMERICAN TEL & TEL CO LONG LINES
95.8%Electricity
4.7%Wood
Population in 1990: 1,071. Population change in the 1990s: +227 (+21.2%).
Place of birth for U.S.-born residents:
This state: 512
South: 49
West: 7
70% of the 77519 zip code residents lived in the same house 5 years ago. Out of people who lived in different houses, 36% lived in this county. Out of people who lived in different counties, 50% lived in Texas.
100% of the 77519 zip code residents lived in the same house 1 year ago.
Students in private schools in grades 9 to 12 (high school): 37
Here:
100.0%
Texas:
8.0%
Students in private undergraduate colleges:
Here:
0.0%
Texas:
16.2%
Top industries in this zip code by the number of employees in 2005:
Construction: Site Preparation Contractors (10-19 employees: 1 establishment)
Mining: Support Activities for Oil and Gas Operations (10-19: 1)
Mining: Crude Petroleum and Natural Gas Extraction (5-9: 1, 1-4: 1)
Other Services (except Public Administration): Religious Organizations (1-4: 2)
Real Estate and Rental and Leasing: Video Tape and Disc Rental (1-4: 1)
Health Care and Social Assistance: Offices of Physicians (except Mental Health Specialists) (1-4: 1)
Professional, Scientific, and Technical Services: Other Accounting Services (1-4: 1)
Fatal accident statistics in 2013:
Fatal accident count: 1
Vehicles involved in fatal accidents: 2
Fatal accidents caused by drunken drivers: 1
Fatalities: 1
Persons involved in fatal accidents: 3
Pedestrians involved in fatal accidents: 0
Fatal accident statistics in 2012:
Fatal accident count: 1
Vehicles involved in fatal accidents: 1
Fatal accidents caused by drunken drivers: 0
Fatalities: 1
Persons involved in fatal accidents: 1
Pedestrians involved in fatal accidents: 0
Home Mortgage Disclosure Act Aggregated Statistics For Year 2009 (Based on 4 partial tracts)
A) FHA, FSA/RHS & VA Home Purchase Loans
B) Conventional Home Purchase Loans
C) Refinancings
D) Home Improvement Loans
F) Non-occupant Loans on < 5 Family Dwellings (A B C & D)
G) Loans On Manufactured Home Dwelling (A B C & D)
Number
Average Value
Number
Average Value
Number
Average Value
Number
Average Value
Number
Average Value
Number
Average Value
LOANS ORIGINATED
6
$130,020
10
$100,055
11
$151,528
2
$53,160
1
$47,980
6
$43,633
APPLICATIONS APPROVED, NOT ACCEPTED
1
$73,290
4
$80,218
1
$205,760
1
$52,200
0
$0
2
$54,875
APPLICATIONS DENIED
2
$125,900
8
$76,601
6
$161,008
4
$33,525
1
$33,450
6
$55,995
APPLICATIONS WITHDRAWN
0
$0
0
$0
3
$121,453
1
$46,110
1
$50,190
0
$0
FILES CLOSED FOR INCOMPLETENESS
0
$0
1
$88,740
1
$158,060
0
$0
0
$0
0
$0
Aggregated Statistics For Year 2008 (Based on 4 partial tracts)
A) FHA, FSA/RHS & VA Home Purchase Loans
B) Conventional Home Purchase Loans
C) Refinancings
D) Home Improvement Loans
F) Non-occupant Loans on < 5 Family Dwellings (A B C & D)
G) Loans On Manufactured Home Dwelling (A B C & D)
Number
Average Value
Number
Average Value
Number
Average Value
Number
Average Value
Number
Average Value
Number
Average Value
LOANS ORIGINATED
4
$136,002
16
$107,090
9
$122,180
7
$32,296
0
$0
5
$39,358
APPLICATIONS APPROVED, NOT ACCEPTED
1
$114,570
4
$81,178
2
$128,620
1
$25,910
0
$0
3
$66,443
APPLICATIONS DENIED
1
$191,440
12
$75,523
9
$98,919
7
$33,333
1
$51,360
10
$50,100
APPLICATIONS WITHDRAWN
1
$59,730
1
$121,940
2
$143,340
1
$54,310
0
$0
0
$0
FILES CLOSED FOR INCOMPLETENESS
0
$0
1
$183,890
1
$76,840
0
$0
0
$0
0
$0
Aggregated Statistics For Year 2007 (Based on 4 partial tracts)
A) FHA, FSA/RHS & VA Home Purchase Loans
B) Conventional Home Purchase Loans
C) Refinancings
D) Home Improvement Loans
F) Non-occupant Loans on < 5 Family Dwellings (A B C & D)
G) Loans On Manufactured Home Dwelling (A B C & D)
Number
Average Value
Number
Average Value
Number
Average Value
Number
Average Value
Number
Average Value
Number
Average Value
LOANS ORIGINATED
1
$88,200
20
$109,403
9
$111,763
7
$36,951
0
$0
6
$43,752
APPLICATIONS APPROVED, NOT ACCEPTED
0
$0
5
$65,484
1
$134,260
1
$16,700
0
$0
5
$55,086
APPLICATIONS DENIED
0
$0
14
$65,763
16
$108,724
12
$41,559
1
$31,490
13
$47,794
APPLICATIONS WITHDRAWN
0
$0
1
$107,080
7
$99,079
1
$51,880
0
$0
1
$60,190
FILES CLOSED FOR INCOMPLETENESS
0
$0
2
$122,180
1
$85,610
0
$0
1
$97,240
0
$0
Aggregated Statistics For Year 2006 (Based on 4 partial tracts)
A) FHA, FSA/RHS & VA Home Purchase Loans
B) Conventional Home Purchase Loans
C) Refinancings
D) Home Improvement Loans
F) Non-occupant Loans on < 5 Family Dwellings (A B C & D)
G) Loans On Manufactured Home Dwelling (A B C & D)
Number
Average Value
Number
Average Value
Number
Average Value
Number
Average Value
Number
Average Value
Number
Average Value
LOANS ORIGINATED
3
$87,550
28
$81,715
10
$113,671
7
$32,064
3
$62,093
7
$35,671
APPLICATIONS APPROVED, NOT ACCEPTED
0
$0
5
$86,252
3
$50,753
2
$24,660
0
$0
3
$39,607
APPLICATIONS DENIED
1
$44,590
25
$56,059
10
$104,231
7
$34,896
1
$62,720
15
$38,711
APPLICATIONS WITHDRAWN
1
$32,470
3
$111,097
10
$111,897
2
$38,955
0
$0
0
$0
FILES CLOSED FOR INCOMPLETENESS
0
$0
2
$54,550
2
$119,740
0
$0
0
$0
0
$0
Aggregated Statistics For Year 2005 (Based on 4 partial tracts)
A) FHA, FSA/RHS & VA Home Purchase Loans
B) Conventional Home Purchase Loans
C) Refinancings
D) Home Improvement Loans
F) Non-occupant Loans on < 5 Family Dwellings (A B C & D)
G) Loans On Manufactured Home Dwelling (A B C & D)
Number
Average Value
Number
Average Value
Number
Average Value
Number
Average Value
Number
Average Value
Number
Average Value
LOANS ORIGINATED
2
$104,020
22
$80,178
13
$106,954
7
$37,003
1
$100,690
6
$41,025
APPLICATIONS APPROVED, NOT ACCEPTED
0
$0
9
$57,294
4
$70,738
2
$28,710
0
$0
6
$38,648
APPLICATIONS DENIED
1
$110,200
24
$44,228
16
$87,856
8
$46,625
0
$0
22
$40,290
APPLICATIONS WITHDRAWN
0
$0
4
$70,512
9
$116,193
3
$128,930
1
$94,250
0
$0
FILES CLOSED FOR INCOMPLETENESS
0
$0
2
$114,020
3
$117,933
1
$17,750
0
$0
0
$0
Aggregated Statistics For Year 2004 (Based on 4 partial tracts)
A) FHA, FSA/RHS & VA Home Purchase Loans
B) Conventional Home Purchase Loans
C) Refinancings
D) Home Improvement Loans
F) Non-occupant Loans on < 5 Family Dwellings (A B C & D)
G) Loans On Manufactured Home Dwelling (A B C & D)
Number
Average Value
Number
Average Value
Number
Average Value
Number
Average Value
Number
Average Value
Number
Average Value
LOANS ORIGINATED
2
$111,315
18
$86,216
20
$88,178
11
$24,448
2
$57,500
7
$38,454
APPLICATIONS APPROVED, NOT ACCEPTED
1
$65,990
5
$58,830
6
$76,528
2
$30,900
0
$0
4
$44,065
APPLICATIONS DENIED
1
$63,830
22
$48,730
15
$88,306
11
$23,320
1
$74,330
16
$46,272
APPLICATIONS WITHDRAWN
0
$0
3
$84,800
12
$83,258
2
$71,010
1
$40,930
0
$0
FILES CLOSED FOR INCOMPLETENESS
0
$0
1
$54,080
8
$100,918
1
$33,410
0
$0
0
$0
Aggregated Statistics For Year 2003 (Based on 4 partial tracts)
A) FHA, FSA/RHS & VA Home Purchase Loans
B) Conventional Home Purchase Loans
C) Refinancings
D) Home Improvement Loans
F) Non-occupant Loans on < 5 Family Dwellings (A B C & D)
Number
Average Value
Number
Average Value
Number
Average Value
Number
Average Value
Number
Average Value
LOANS ORIGINATED
3
$77,877
18
$75,976
33
$90,607
7
$27,960
1
$36,920
APPLICATIONS APPROVED, NOT ACCEPTED
0
$0
6
$57,627
5
$97,766
2
$27,165
0
$0
APPLICATIONS DENIED
2
$78,200
15
$53,299
26
$88,129
5
$16,302
1
$60,180
APPLICATIONS WITHDRAWN
1
$87,140
1
$43,580
14
$70,595
2
$23,335
0
$0
FILES CLOSED FOR INCOMPLETENESS
0
$0
1
$43,900
3
$60,377
0
$0
0
$0
Aggregated Statistics For Year 2002 (Based on 4 partial tracts)
A) FHA, FSA/RHS & VA Home Purchase Loans
B) Conventional Home Purchase Loans
C) Refinancings
D) Home Improvement Loans
F) Non-occupant Loans on < 5 Family Dwellings (A B C & D)
Number
Average Value
Number
Average Value
Number
Average Value
Number
Average Value
Number
Average Value
LOANS ORIGINATED
3
$65,900
16
$65,859
18
$89,604
5
$21,672
1
$85,910
APPLICATIONS APPROVED, NOT ACCEPTED
0
$0
7
$37,747
5
$70,434
3
$18,880
0
$0
APPLICATIONS DENIED
0
$0
16
$43,106
15
$62,773
4
$11,365
0
$0
APPLICATIONS WITHDRAWN
1
$36,950
1
$52,200
5
$74,298
0
$0
0
$0
FILES CLOSED FOR INCOMPLETENESS
0
$0
1
$150,150
3
$59,390
0
$0
0
$0
Aggregated Statistics For Year 2001 (Based on 4 partial tracts)
A) FHA, FSA/RHS & VA Home Purchase Loans
B) Conventional Home Purchase Loans
C) Refinancings
D) Home Improvement Loans
F) Non-occupant Loans on < 5 Family Dwellings (A B C & D)
Number
Average Value
Number
Average Value
Number
Average Value
Number
Average Value
Number
Average Value
LOANS ORIGINATED
2
$89,515
20
$67,918
17
$80,034
6
$12,247
2
$49,315
APPLICATIONS APPROVED, NOT ACCEPTED
0
$0
6
$47,833
3
$72,897
1
$8,280
0
$0
APPLICATIONS DENIED
0
$0
21
$39,145
11
$51,158
3
$11,310
0
$0
APPLICATIONS WITHDRAWN
0
$0
3
$42,147
8
$58,475
0
$0
0
$0
FILES CLOSED FOR INCOMPLETENESS
0
$0
1
$39,350
1
$79,810
0
$0
0
$0
Aggregated Statistics For Year 2000 (Based on 4 partial tracts)
A) FHA, FSA/RHS & VA Home Purchase Loans
B) Conventional Home Purchase Loans
C) Refinancings
D) Home Improvement Loans
F) Non-occupant Loans on < 5 Family Dwellings (A B C & D)
Number
Average Value
Number
Average Value
Number
Average Value
Number
Average Value
Number
Average Value
LOANS ORIGINATED
3
$56,163
18
$68,188
7
$77,789
4
$16,550
1
$53,190
APPLICATIONS APPROVED, NOT ACCEPTED
1
$29,270
5
$60,038
3
$59,640
0
$0
1
$45,090
APPLICATIONS DENIED
0
$0
20
$37,871
3
$66,720
3
$9,303
1
$31,830
APPLICATIONS WITHDRAWN
0
$0
3
$61,567
2
$72,735
0
$0
0
$0
FILES CLOSED FOR INCOMPLETENESS
0
$0
1
$33,410
1
$86,390
0
$0
0
$0
Aggregated Statistics For Year 1999 (Based on 2 partial tracts)
B) Conventional Home Purchase Loans
C) Refinancings
D) Home Improvement Loans
F) Non-occupant Loans on < 5 Family Dwellings (A B C & D)


 Nearest zip codes: 77585, 77564, 77533, 77561, 77374, 77659.


